Introduction
On Friday October 13th, Cboe (Chicago Boards of Exchanges) officially launched four new volatility credit indices. In the current high interest rate environment, investors are becoming increasingly wary of the aggregated impact of high rates on highly levered balance sheet, thus increasing the relevance of the new forward-looking indicators. The CDS VIX indices will provide new signals on implied volatility of corporate credit risk, and act as a barometer of the bond market sentiment both in the US and Europe. As the VIX index marks its 30-year anniversary, let’s take a look back at how it all started.
What is the VIX index:
The CBOE (Chicago Boards of Exchange) Volatility index (VIX) is a real time index that computes the implied volatility of the S&P500 Index (SPX). Derived from the prices of near and next term SPX options, it generates a 30 day forward projection of volatility. Also named the “fear index”, it is often seen as a strong indicator of market sentiment with its values ranging from 1 to 100 (1 being the least volatile). Values over 30 are generally considered to signal heightened volatility, while a lower than 20 reading commonly reflects confidence. As well as being used as an effective forward-looking indicator, it is also used today for the following purposes:
- Portfolio hedging: The VIX index historically had strong negative correlation with the SPX index. A long exposure to volatility can (generally) protect from the downsides of being long on the SPX.
- Trading pure volatility: The index provides an alternative to traditional option strategies (straddles, strangle). Indeed, traders can gain pure volatility exposure through a single index by buying futures, options, or ETF’s tracking the VIX.
- Volatility arbitrage: Historically, index options have priced higher expected than realized volatility. Market participants can follow volatility arbitrage strategies, using VIX options or futures to capture the difference.
More recently, a 2009 study from Carr and Wu showed that it could also represented investors risk aversion. Indeed, the VIX is the risk neutral expected volatility of the stock market over the next 30 days, and can be thought as the sum of two components: the expected actual volatility and a variance risk premium. The latter reflecting investors’ degree of risk aversion.
History of the VIX
The VIX index was created in 1993 by the Cboe to provide market participants an effective forward looking volatility indicator. But we can trace back its origins further back to two financial economic researchers: M. Brenner and D. Galai. In a series of papers dated from 1987-1989, they proposed the creation of an index based on stock market volatility, naming it the “Sigma Index”. As forward looking as their index was, they already had in mind its potential for trading: “A volatility index would play the same role as the market index plays for options and futures on the index.”
In 1992, Cboe commissioned Bob Whaley to build an index based on previous research. Creating a formula tailored to Cboe’s S&P 100 Index (OEX) option prices, the Market Volatility Index (VIX) was born on January 19th, 1993. It was a forward-looking index, representing the market’s expectations of 30-day future volatility of the S&P100, inferring it from at the money (ATM) option prices. It used S&P100 options as they were the most actively traded at the time on Cboe’s exchange.
In 2003, Cboe worked with Goldman Sachs to update the model, shifting its underlying to S&P500 (SPX) options. The lead developers on this project were Devesh Shah, Sandy Rattray, Tim Klassen from Goldman, and Joe Levin, John Hiatt from Cboe. Two main shifts were announced: 1) the change of underlying index, 2) the mathematical computation change from using ATM option prices to using a wide range of strikes. The first one reflects wider changes in volume traded, with the SPX becoming the most traded US equity index, the liquidity of the underlying being a necessary hedging condition (more on this later). Secondly, the improved methodology—transition from inferring volatility from ATM option prices to using a wide strike range—reflects a more accurate estimation of the 30-day implied volatility. This new computation also paved the way for VIX trading.
To give the reader some context, trading volatility was gaining traction after the 1990s; with the first variance swap early 1990. Before the dotcom bubble, mainstream equity desks didn’t particularly need to trade volatility as the equity market was flourishing. But when it crashed, people started thinking of alternative sources of business. Variance swaps are derivative contracts used to hedge (or speculate) on the magnitude of changes in price of an underlying security. If the realized variance is higher than the strike price variance, there is a positive payoff. Although it provided direct volatility exposure, the product was too sophisticated for the clients. From there emerged one question: why can’t we trade the most known measure of equity volatility in the world, one which investor clearly understood its key drivers.
A few months after the revamped index was launched, VIX futures began to trade on Cboe’s future exchange. Coming back to the notion of liquidity in the SPX option market, you must understand that all these futures must be hedged by its seller. If the VIX had stuck to S&P100 options, the underlying’s lack of liquidity would have caused more than just hedging challenges for the banks selling this product, impairing the final product’s commercial impact. Initially, the futures didn’t have this much of a success; until the financial crisis saw the VIX topping unpreceded levels (closing at 89 on October 24, 2008). This was a turning point, as from then on investors increasingly seeked to hedge themselves against the increasing volatility risk. By 2009, the number of future contracts had increased three-fold from 2006. Cboe also introduced Mini VIX futures, which share all the same characteristics than “traditional futures” except for the size (1/10th of the standard contract). This led to additional flexibility in volatility risk management, especially for small investors. Symbol of the index success, more than 200,000 VIX futures were traded daily in 2023.
As well as futures, Cboe introduced options on the VIX in February 2006 in a response to market demand for more versatile volatility products. This led to an increased use of the VIX for hedging purposes, as well as further democratizing the access to volatility trading.
Another key milestone for the index was the inclusion of SPX weeklies in 2014. The shift from standard monthly options to weekly options enhanced the preciseness of the index, allowing to better match the 30-day targeted time frame. Indeed, this allows the computations to be based on SPX options with more than 23 days and less than 37 days to expiration, incorporating a more accurate reflection of investor’s expectations and sentiment in the index’s calculations.
Today, VIX futures and options represent more than 6% of the Cboe’s overall revenues, highlighting the importance of this market.
VIX’s methodology
Volatility can be measured by two different methods: historical (or realized) volatility and implied volatility. The VIX uses the second method, inferring its value from option prices. Indeed, option prices are positively correlated with volatility. To put it simply, a higher implied volatility (IV) means a higher probability for the call/put to reach the strike price, therefore requiring a higher option premium for the option’s writer.
The VIX Index exhibits a characteristic known as mean reversion. In contrast to equity indices, which can experience sustained upward trends, the VIX will generally return or move back to its historical average. Volatility is not a limitless upward trajectory; it cannot increase indefinitely. Furthermore, it doesn’t have the capacity to reach zero, and historically, it has not fallen below the level of nine.
VIX values are calculated using the CBOE-traded standard SPX options, which expire on the third Friday of each month, the weekly SPXW options, which expire on all other Fridays, and the US Treasury yield curve rates. The considered SPX options have an expiry period lying within more than 23 days and less than 37 days.
The generalized formula used to compute the VIX index is:
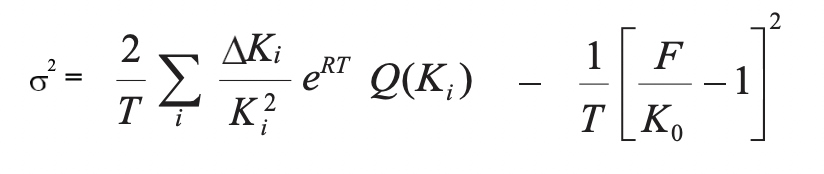
where T is time to expiration (in years), F is the option implied forward price, Ko is the first strike price equal to or immediately below the forward index level F, Ki is the strike price of the i-th out of the money (OTM) option (both calls and puts), Ki is the interval between successive strike prices (half the difference between the strike price on either side of Ki, R is the risk free rate, and Q(Ki) is the midpoint of the bid-offer spread for each option with strike Ki. The standard deviation is then multiplied by 100 to give the final index value.
The VIX formula uses two sets of options: near term options (more than but close to 23 days to expiration) and next term options (less than but close to 37 days to expiration). On the left-hand side of the equation, the goal is to build a weighted average price of all the selected options by their market prices—here indicated by Q(Ki). The overall weighting is then multiplied by a fraction of time to expiration. Time to expiration is given a fraction of time to expiry in minutes over minutes in a year (525,600). The purpose of F is to determine K0 which is the strike closest to the price of the forward. More details can be found in the Cboe’s VIX methodology paper.
Other significant volatility indices
Alongside the VIX (which has as underlying the SPX and aims to reflect 30-day implied volatility), other volatility indices have emerged in recent years. This reflects the strong appetence from investors towards volatility indicators in various markets and maturities. Let’s walk through each asset class and their main respective volatility indices.
1. Equity
Still with the SPX as underlying, Cboe developed in recent years implied volatility (IV) indices for various maturities. The most followed are the short-term Volatility index (VXST) reflecting 9-day IV, the 3-month (VXV), and the 6-months volatility index (VXMT).
This spring (2023), Cboe also launched a one-day volatility index (VIX1D). To do so, it aggregates the weighted prices of P.M. settled options (near term) as well as those closest with near term expirations, next term. For example, to calculate VIX1D on a Tuesday, the calculation would use Tuesday expiration as near-term options and Wednesday expiration as next term options. It differs in calculation from the traditional index due to time to expiration of current day expiry options declining to zero as their contract expire, impacting the 1/T factor in the generalized formula (above). To counter this, when time to expiration is less than 60 minutes, the single term volatility of the near term will be the last valid minute and persisted until the near-term expiration time. During this period, the weights will be redistributed and concentrated towards next-term options. At the near-term expiration time, the VIX1D Index will fully converge to the volatility of the next term. A key aspect of this index relies in its high volatility. This reflects shorter dated options’ higher delta, faster time decay, and overall higher vega values. Intuitively, a relevant news for the option’s underlying tends to highly affect its price in the short term, leading to increased short-term volatility.
Cboe also calculates a volatility index for other underlying such as the Nasdaq 100, the Dow Jones Industrial Average (DJIA), the Russell 2000.
Across the Atlantic, the Euro Stoxx 50 is one of the main equity indices (in terms of volume). Eurex Exchange (Europe’s largest derivative exchange) introduced in 2002 the Euro Stoxx 50 Volatility Index (VSTOXX). This index measures the 30-day implied volatility of the Euro Stoxx 50 Index options and is often considered the European equivalent of the VIX. Other versions of this index exist with different maturities.
2. Fixed Income
Looking at fixed income volatility instruments, let’s start with those focused-on rates. The MOVE Index, or Merrill Lynch Option Volatility Estimate Index reflects interest volatility in the US Treasuries Market over the next 30 days. It follows similar methodology than the VIX, inferring its value from a range of options. It is a yield curve weighted index of the normalized implied volatility on 1-month Treasury options which are weighted on the 2, 5, 10, and 30 year contracts. It is important to note that when referring to options in fixed income, one usually means an option on the respective future of this fixed income instrument, as it is the case for the MOVE Index.
This Friday 13th October 2023, Cboe released 4 new CDS indices representing implied volatility credit risk for both IG and HY, in US and Europe. All these indices have a one-month maturity, tracking CDS prices for US high yield (VIXHY), US investment grade (VIXIG), EU iTraxx high yield (VIXIE), and EU iTraxx investment grade (VIXXO). They provide strong implied volatility indicators for their respective markets, allowing investors to better manage aggregate corporate credit risk.
3. Commodities
The Cboe Crude Oil ETF Volatility Index (CVOL) measures the implied volatility of the United States Oil Fund (USO), an ETF that tracks the price of crude oil. The mathematical computation resembles the VIX’s, as it computes its value based on ATM and OTM options with various expiration dates. However, in comparison to the VIX which publicly discloses its methodology, the CVOL Index doesn’t as it also considers “other relevant data” to compute its final value.
Critics to the VIX
Economic policy uncertainty leads to low VIX?
On many occasions did market participants and the news report that the “VIX was broken”. Much literature has been written on this subject, notably on the extremely low level of the index between 2016 and 2017. To bring this back into context, this was a moment of great political and economic policy uncertainty brought up post US election (Trump’s election) and the Brexit in the UK. Levels of economic policy uncertainty (EPU) reached new high levels during this period.
In an empirical study, J. Białkowski, H. Dang, and X. Wei prove that exceptional performance of the stock market can outweigh the risk of economic policy uncertainty, overall lowering both the political risk premia and market volatility. This comes as an opposition to the strong evidence laying a positive correlation between stock market volatility and economic policy uncertainty—because of higher risk premia and more volatile returns (Sum and Fanta, 2012; Liu and Zhang, 2015; Li et al., 2016; Goodell et al., 2020). The former’s research shows that in spite of high economic policy uncertainty, low quality political signals result in rate updates in investors’ beliefs, overall leading towards lower political risk premia and lower market volatility. This may come as a surprise to many, but the results of this shows how intricate the underlying factors driving volatility are.
Vixmageddon
Volatility trading can also prove to be dangerous, as highlighted by the Vixmageddon. If you’re interested in vol trading, you’re probably familiar with this term. If not, this refers to a significant and abrupt surge in the VIX index that took place on February 5, 2018. This event was triggered mainly for two reasons: 1) Market volatility due to concerns regarding potential inflation, increasing interest rates and geopolitical tensions; 2) Structural issues linked to derivate products which exhibited unexpected behaviour under extreme market condition, leading to amplified volatility. The first point is quite self-explanatory, but let’s dive into some of the key structural issues that led to a more than 100% jump in the VIX’s value.
1. Leveraged and Inverse ETP’s (Exchange traded products)
These products are designed to provide amplified returns relative to the VIX’s daily movements. However, due to compounding effect, these products experienced substantial deviations from their expected performance during times of heightened market volatility.
2. Rolling of VIX and illiquidity
To hedge their positions, most of the ETP’s need to roll their future VIX contracts to maintain sufficient exposure. However, due to the increase market volatility, the cost of rolling these contracts significantly increased during this period. This led to increased tracking errors between the ETPs and the VIX itself, exacerbating losses for investors. To make things worse, some of these ETPs faced significant liquidity issues in times of market stresses, hampering the efficient functioning of the market. This led to distorted pricing and substantial losses for investors who were unable to execute trades at desired levels.
Overall, this led to a sharp decline in major equity indices around the world, with investors suffering important losses from due to extreme market volatility (especially from significant short positions on the VIX). This also temporarily eroded investors’ confidence in the index, emphasizing the need to diversify hedging strategies.
Conclusion
To conclude, the VIX index launch was a revolution as it was the first forward looking volatility indicator, reflecting 30-day US equity implied volatility. Overtime, it facilitated volatility trading, created new risk management tools, and has become an important diversification solution (due to its strong negative correlation with US equity). It also led the way for the development of volatility indices many other underlying, another demonstration of its broad success.
References
[1] Volatility Index®Methodology: Cboe Volatility Index®.
[2] White Paper CBOE Volatility Index. https://www.sfu.ca/~poitras/419_VIX.pdfAccessed 14 Oct. 2023.
[3] Sum and Fanta, 2012; Liu and Zhang, 2015; Li et al., 2016; Goodell et al., 2020
[4] Wigglesworth, Robin. “An Oral History of the Fear Index.” Financial Times, 20 Sept. 2023, www.ft.com/content/5c840fbe-9949-43ab-9058-633023031582. Accessed 14 Oct. 2023.
[5] “Cboe Global Markets, Inc. – Cboe Global Markets Launches 1-Day Volatility Index, Designed to Measure Volatility over Current Trading Day.” Ir.cboe.com, ir.cboe.com/news/news-details/2023/Cboe-Global-Markets-Launches-1-Day-Volatility-Index-Designed-to-Measure-Volatility-Over-Current-Trading-Day-04-24-2023/default.aspx. Accessed 14 Oct. 2023.


0 Comments