Introduction
The Capital Asset Pricing Model (CAPM) gives a linear relation between expected excess returns and exposure to aggregate market risk. In symbols, the Security Market Line (SML) states that an asset’s expected excess return equals its beta times the market risk premium. In reality, however, several investors, such as retail or pension funds, are constrained by the amount of leverage they can use, facing explicit or implicit margin constraints. Therefore, rather than using leverage, many investors compensate for this constraint by tilting towards high-beta assets. This causes prices to adjust, compressing the risk-return trade-off.
Taking this into account, in this article, starting from the paper of Frazzini and Pendersen (2013), we investigate whether an unconstrained investor can exploit this anomaly, generating a return premium. In particular, we are interested in finding out if this strategy might work in the current environment. The aim is to generate a return by betting against beta through a market-neutral long-short factor that goes long a portfolio of low-beta stocks and short a portfolio of high-beta stocks, isolating therefore this pricing spread. We consider rescaling each portfolio to have unit market beta. This is the Betting-Against-Beta (BAB) factor.
Estimation of ex-ante betas
At the end of each month t, we estimate pre-ranking betas from daily excess returns. We denote  and
and  the volatilities of stock i and the market. Also, we define
  as their correlation. Therefore, the estimated beta for a stock i is:

In addition, to reduce the influence of outliers, we shrink, following Vasicek, the time series estimation of beta toward one with a common weight w, which we keep constant across different stocks. We assign the value of one to the cross-sectional mean  .
.

Construction of Betting-Against-Beta (BAB) factors
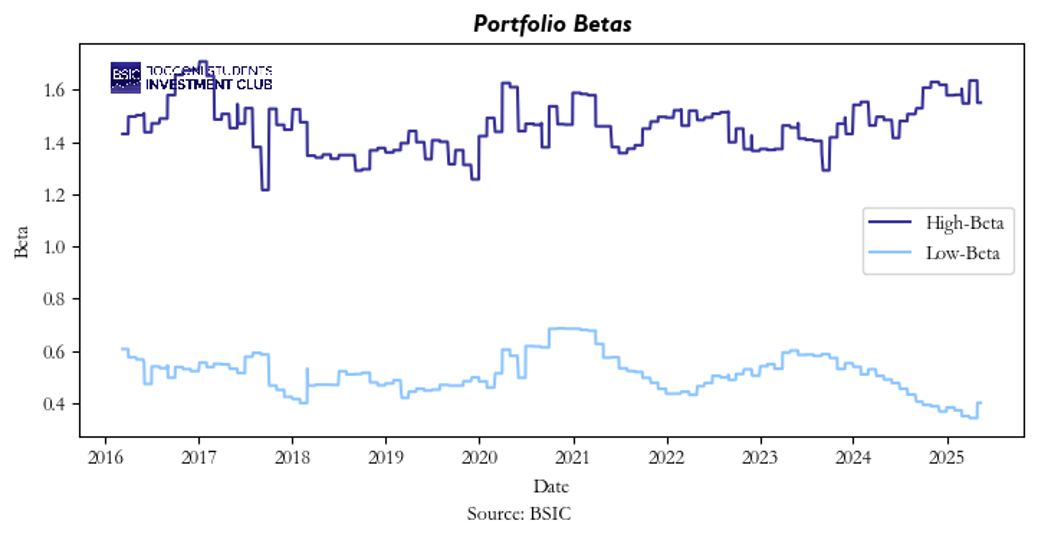
We now create our portfolios that are long low-beta stocks and short-sell high-beta sones: the BAB factors. We sort stocks in our portfolios in ascending order by the value of beta. Then we convert beta ranks into portfolio weights. Let  and
and  be the average rank. Considering a normalizing constant k, the high-beta and low-beta weights are:


With


Let  be the vector of next-month excess returns and
  be the vector of shrunk betas at t. Then the weighted excess returns of the two portfolios for month t+1 and their pre-scale market betas at t are:


Both portfolios are then scaled to unit market beta at creation. The BAB return over month t+1, is the self-financing, zero-beta combination of the two scaled portfolios,

therefore, long and short market exposures cancel at formation, and the factor isolates the pricing spread between low and high beta stocks.
Data and Universe
For the purpose of our research, we restrict attention to the S&P 500, considering a monthly calendar rebalancing. We consider dividend-adjusted total returns, the market return is the S&P 500 total-return series, and the risk-free leg is the 1-month U.S. Treasury bill. Returns are measured in simple terms and then converted to excess returns by subtracting the T-bill rate.
Results
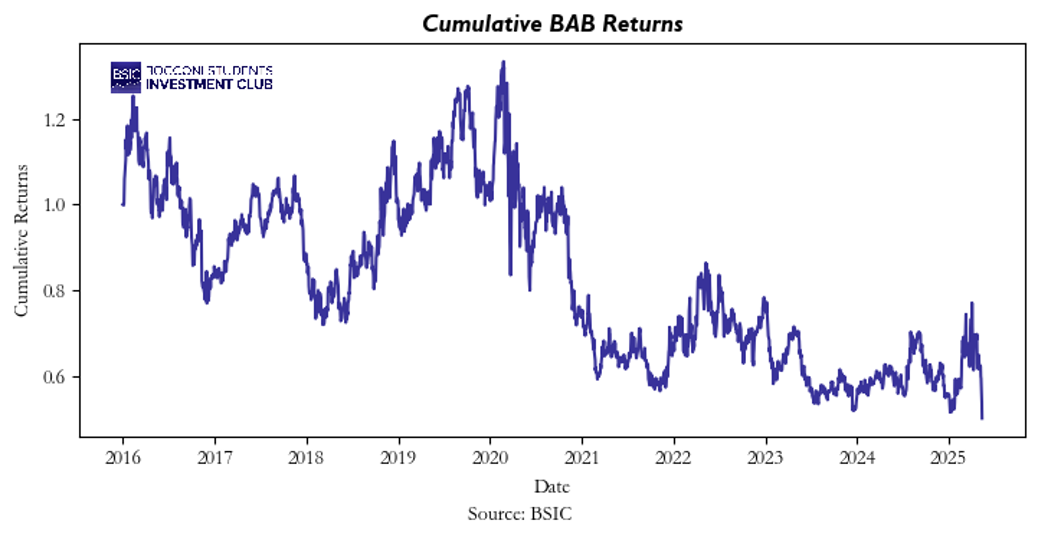
Looking at BAB cumulative returns, it is clear to see that the strategy has struggled in the most recent period, especially from 2020 onwards. However, as we will discuss later in our conclusions, this is not very unusual for BAB in risk-on regimes where high-beta stocks generate returns on the market.
An important consideration is that, although the factor is created to have zero market beta at formation, the realized beta shifts significantly from that value between rebalancing dates, as they are not very frequent.
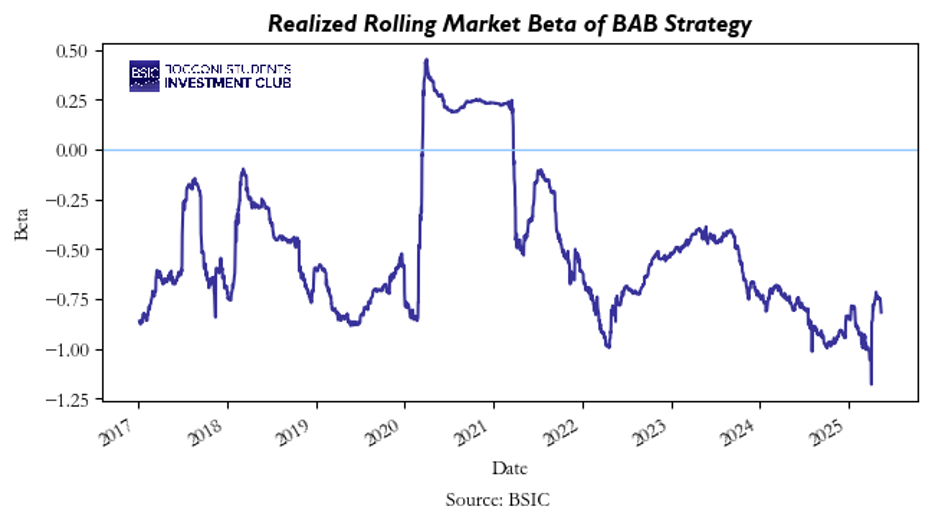
In particular, over our sample, the mean realized beta is -0.5130, and the simple 95% confidence interval is [-0.5280, -0.4979], which lies entirely below zero, indicating a persistent negative market exposure in realized returns. This divergence occurs because portfolios are rebalanced only every month, while individual betas and relative volatilities vary continuously. As a result, the long and short portfolios do not offset as intended until the next rebalance, creating this discrepancy seen in the graphs.
The monthly Fama-French five-factor regression gives us a strong confirmation that our strategy is correctly constructed with respect to the theory presented above. In particular, the regression indicates no statistically significant alpha, as the intercept is basically zero. Also, the portfolio’s market beta is near zero and statistically insignificant. One of the most significant results is the strong negative exposure to SMB, perfectly in line with BAB. In addition, profitability (RMW) is positive and significant, as low-beta stocks often have higher profitability.
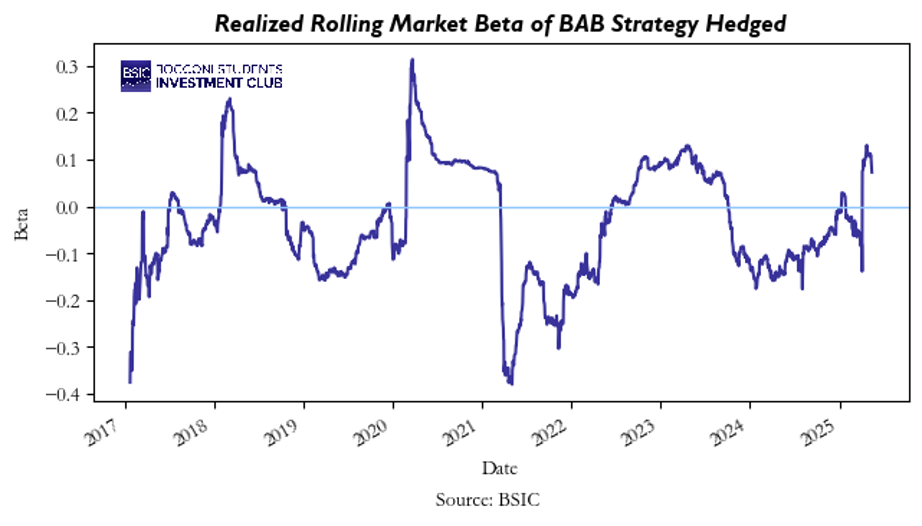
Results with hedging
We also run a rolling CAPM hedge to further neutralize any short-term discrepancies in realized returns. Each day we hold the BAB and take an offsetting position in the market index, therefore reaching market neutrality. The resulting return is:
x
Where:

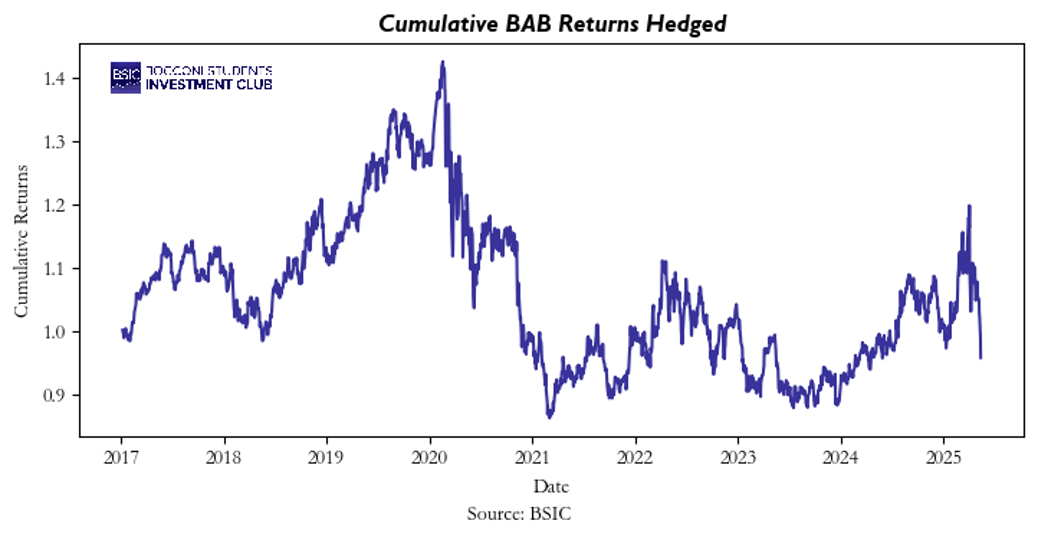
Despite a more rigorous market neutrality, with now beta centered around zero, with mean of -0.0353 and simple 95% CI in range [-0.0405, -0.0302], cumulative BAB returns remain weak over the recent period. Realized beta is now much closer to 0, but not exactly that value. This is due to noise in estimations of gamma that may affect the hedge ratio, in fact hedge gaps and volatility in the market can still shift realized beta from zero.
Even in this case the regression gives us similar results. Alpha, substantially equal to zero, remains statistically insignificant, while beta stays again closer to zero and not significant. In addition, SMB remains negative and significant, as expected for BAB and materially explains returns. RMW is positive and significant as in the previous case.
Conclusions
There are several reasons that can explain the weak performance of this strategy in the recent period. First, high financing costs had a negative impact on returns, as the BAB uses leverage. Another important factor to take into account is that since Frazzini and Pedersen came out with their paper in 2013, capital has flowed into low-beta and defensive strategies, making low-beta stocks inevitably overbought and therefore reducing future expected returns. In addition, beta dispersion has compressed over the past year, shrinking the BAB spread and lowering the strategy’s expected payoff. Lastly, is crucial to consider the fact that the main drivers of the market rally in the last year are high-beta and growth stocks, mostly tech, small caps and speculative names. This makes the short portfolio outperform the long one, with consequently losses for the BAB.
References
- Frazzini, Andrea; Pedersen, Lasse Heje, “Betting against Beta”, 2013.


0 Comments