Recent drivers of the Euro/USD exchange rate
Despite the divergence in monetary policies between the hawkish FED and dovish ECB, the Euro has been appreciating against the Dollar since the beginning of 2017, registering a +13.44% increase on 1st September. However, in the last two weeks it fell under pressures of the result of German elections, releases of macroeconomic data and speeches by the FED Governors, loosing 1.84% from the 2-year high $1.2036 on Wednesday 8th.

Chart 1: EUR/USD spot rate and daily change (Source: Bloomberg)
On Sunday 24th September, Angela Merkel’s party CDU won 32.7% of the vote, while the Social Democrats won 20.2% and the right-wing AfD 13.4%. Even if the CDU showed to be the strongest force in the elections, Ms Merkel will have to find a more complex coalition with two other parties (the Green and the Free Democrats) for her fourth term as German chancellor.
The other intimidating outcome of the election is the growth of consensus to the Alternative for Germany (or AfD) party. Because populist movements seemed to have lost attractiveness in Europe after Emmanuel Macron was elected Prime Minister in France in May, the return of a right-wing party in the German parliament for the first time after the NSDAP was somewhat unexpected. Even if the odds that the other parties will engage with the AfD are low, its presence in the Parliament is the sign of an increasing political antagonism within the strongest European economic power and, given the country’s influence on the other European nations, the increased political risk weighted on the whole Eurozone (Eurostoxx 50 lost 0.1% on Monday closing) and the single currency, which lost 0.86% against the dollar on Monday closing.
At the same time, the dollar is gaining strength after the speech of Janet Yellen on Tuesday. She declared that the FOMC should “be wary of moving too gradually” in rising interest rate in order to avoid overheating the labour market and creating excess inflation. In the last three weeks, the probability of a December rate hike implied by the market participants has more than doubled, from 30% to over 60%, giving a solid foundation for the dollar to strengthen against the other developed market peers, Euro included.

Chart 2: Probability of a December rate hike implied in futures’ prices (Source: CME)
The Euro recovered on Friday, when data about US Personal Income and Personal Spending in August confirmed an expected decrease from the previous month (respectively +0.2% and +0.1% month over month, compared to +0.3% and +0.3% in July). After the release, the dollar index fell by 0.1% on Friday, while the Euro gained 0.23%.
Overview on the recent Fed hikes
Here, we will provide a brief overview on the path of Federal Funds Rate and actions taken by the Federal Open Market Committee (FOMC). The FOMC holds eight regularly scheduled meetings during the year and other meetings as needed. At scheduled meetings, the FOMC makes any changes it sees as necessary, particularly changes with regards to federal funds rate and the discount rate.
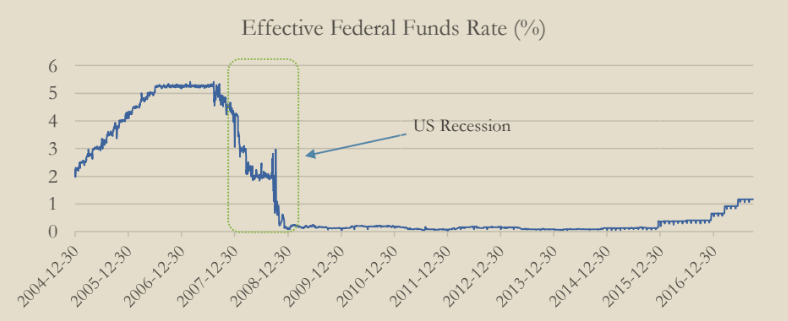
In August 2007, the Fed’s target for the federal funds rate was 5.25%. However, year and a half later, with the financial crisis and recession in the US economy, the FOMC had lowered the target for the federal funds rate to nearly zero, thereby entering the unfamiliar territory of having to conduct monetary policy under zero-lower bound (ZLB) conditions.
In August 2007, the Fed’s target for the federal funds rate was 5.25%. However, year and a half later, with the financial crisis and recession in the US economy, the FOMC had lowered the target for the federal funds rate to nearly zero, thereby entering the unfamiliar territory of having to conduct monetary policy under zero-lower bound (ZLB) conditions.
US Recession

Chart 3: EFFR (Source: FRED Database)
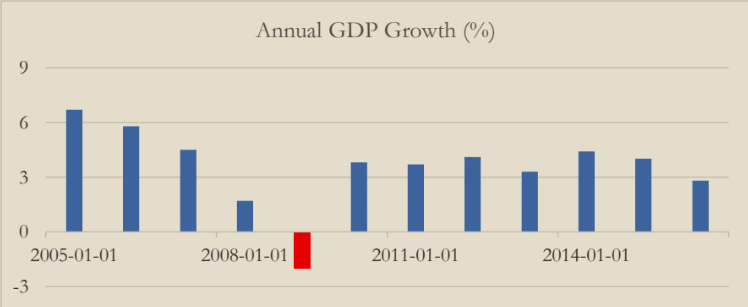
However, as it can be observed from the following charts, the US economy has started improving.

Chart 4: annual GDP Growth (Source: FRED Database)
In 2008, the US economy has entered recession, with the annual growth of -2%. Nevertheless, monetary and fiscal stimulus proved to be successful, and in the next years the US economy has been growing at the rate higher than 3%.

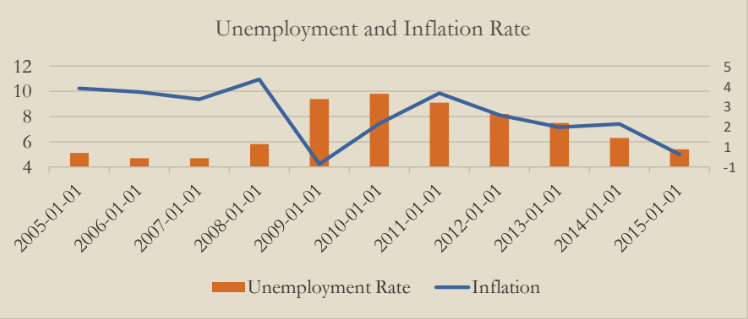
Chart 5: Unemployment and Inflation rate (Source: FRED Database)
The US unemployment rate has also improved. In fact, from 9.8% in 2010, it dropped to 5.4% in 2015 which is close to the Non-Accelerating Inflation Rate of Unemployment (5.3%).
The improvement of the macroeconomic variables has resulted in the shift of the Fed policy. On 16th of December 2015, for the first time after June 2006, the Fed increased the Federal Funds Rate. The hike was from the range 0% – 0.25% to the range 0.25% – 0.5%. Moreover, as the economic activity has been expanding and labor market has continued to strengthen, the Fed again increased the Fed funds rate on the 14th of December 2016. This time Fed increased the Fed Funds corridor from 0.25% – 0.5% to 0.5% – 0.75%. Finally, in 2017 there have been two rate hikes (March and June) of 25 bps. This resulted in the Fed Funds Rate reaching the corridor of 1% – 1.25%.
| Date | Fed Funds Rate |
| Jun 14, 2017 | 1.00%–1.25% |
| Mar 15, 2017 | 0.75–1.00% |
| Dec 14, 2016 | 0.50–0.75% |
| Dec 16, 2015 | 0.25–0.50% |
| Jun 22, 2011 | 0.00–0.25% |
Table 1: Fed Funds Rates
Econometric Analysis on the Impact of Rate Hike on USD/EUR
In this section, we will estimate the impact (if any) of the FOMC announcement of the rate hike on the USD/EUR exchange rate.
Econometric Model:

where t= 01 Jan 2015, 02 Jan 2015, …, 14 Sept 2017
USD/EUR represents the spot exchange rate between Dollar and Euro
Spread represents the difference between the yield on 3-month Treasury and yield on 3-month German Bund
D represents a dummy variable, which takes value 1 in the period surrounding the rate hike, 0 otherwise.
We were interested in estimating the average impact on the exchange rate for different periods surrounding the rate hike. Firstly, we observed seven days before and after the announcement of the hike. Secondly, we observed the period of 30 days before and after the day when FOMC decided to raise interest rates.
Our results show that for the seven-day period that surrounds the rate hike, the US Dollar is on average 3.4% stronger. With respect to the time frame of 30 days, the effect of announcement is even higher. In fact, in the period of 30 days before and after the rate hike, the USD on average appreciates 4.2%.
Finally, we also estimated the impact of the announcement on period of 30 days after the rate hike. The result suggests that USD is on average 3.1% stronger in the 30-day period after the hike than in “normal times”. The obtained result is smaller in absolute terms than the result produced in the analysis that included period of 30 days before as well as after the rate hike. The possible explanation for this deviation could be that market participants price in their expectations about the possible future rate hikes.
When referring to the expectations, it is worth mentioning that today (01/10/2017) the market-implied odds of a US rate rise to 125-150 bps on December meeting are 76.4%. On the other hand, the implied probability that rates will stay at the same level (100-125 bps) are 22.1%.
| One week before/after the hike | One month before/after the hike | One month after the hike | |
| Constant | 0.1001 | 0.1019 | 0.1001 |
| Standard Error | 0.0016 | 0.0014 | 0.0016 |
| P-Value | 0.0000 | 0.0000 | 0.0000 |
| Spread | 0.0001 | 0.0003 | 0.0002 |
| Standard Error | 0.0000 | 0.0000 | 0.0000 |
| P-Value | 0.0000 | 0.0000 | 0.0000 |
| Dummy Variable | -0.0297 | -0.0424 | -0.0309 |
| Standard Error | 0.0042 | 0.0025 | 0.0035 |
| P-Value | 0.0000 | 0.0000 | 0.0000 |
Table 2: Output of the regression


0 Comments