Introduction: Rebalance Timing Luck
Every trading strategy has some turnover in its portfolio constituents; otherwise, it would simply be a buy-and-hold strategy. Equally, every index has some periodical rebalancing (and turnover) in its constituents. Often, the point in time at which this reshuffling of the portfolio takes place is periodical, e.g., once a month or once a year. However, both the point in time at which a portfolio is rebalanced as well as the time frame between rebalancing are chosen arbitrarily and often little thought is given to the differences that other arbitrary timing schedules could make.
Consequently, two portfolio managers or index providers could create strategies/indices with differing returns, even though they use the same underlying methodology. In other words, there is a luck component in having the “correct” timing which cannot be foreseen ex ante. This luck component is otherwise known as “Rebalance Timing Luck”. While this notion is not new to most academics and practitioners in finance, it is often overlooked for various reasons such as data availability, ignorance, or simply not knowing the magnitude of return differences.
Some first literature was published on this effect by Blitz et al. [1] in 2010 who showed that changing the calendar month of rebalancing in a trading strategy with annual rebalancing creates large return differences. Building on this work, Hoffstein and co-authors have coined the phrase “Rebalance Timing Luck” and have evidenced that this phenomenon is present in index investing [2], equity factor investing [3], and options strategies [4].
In this article, we want to shed further light on the implications of rebalance timing luck using two examples. Firstly, we show how the rebalancing frequency of an equal-weight portfolio of the S&P500 changes the return, especially when factoring in trading costs. Secondly, we investigate how different rebalancing schedules of a simple momentum strategy can affect returns.
The Role of Rebalancing Frequency in Portfolio Construction
While differing rebalancing frequencies might not completely fit the bill of rebalance timing luck, we still believe that examining their implications can motivate the general theme of arbitrary portfolio construction decisions having a large impact on returns.
In order to investigate the effects of differing rebalancing frequencies, we construct equal weight portfolios for the S&P500. While the regular S&P500 is market capitalization weighted, using equal weights for the constituents is simpler to implement and is equally helpful in showing the effects of rebalancing frequency choices. The constituents of the S&P500 are the 500 largest companies listed on US stock exchanges and are chosen every third Friday in March, June, September, and December and this rebalancing creates around 4% turnover in constituents per year. For ease of return calculation, we assume perfect foresight in which companies will leave an index for a given time rebalancing period and exclude them from the calculations; therefore, the index we use will contain a few less constituents than the actual S&P500, but this difference should be negligible in the grand scheme of things. Daily data for constituents and their respective returns is gathered from WRDS and spans a time frame from the start of 1980 to the end of 2022.
Specifically, we run a strategy that rebalances the weights of the constituents back to equal weights every 1, 10, 20, 30, 40, 50, 100, 150, 200, and 250 days. Looking at the returns of a sample of different rebalancing frequencies, it becomes evident that more frequent rebalancing increases returns with returns almost monotonically with the 200-day rebalancing frequency (marked in red) being the worst performing strategy.
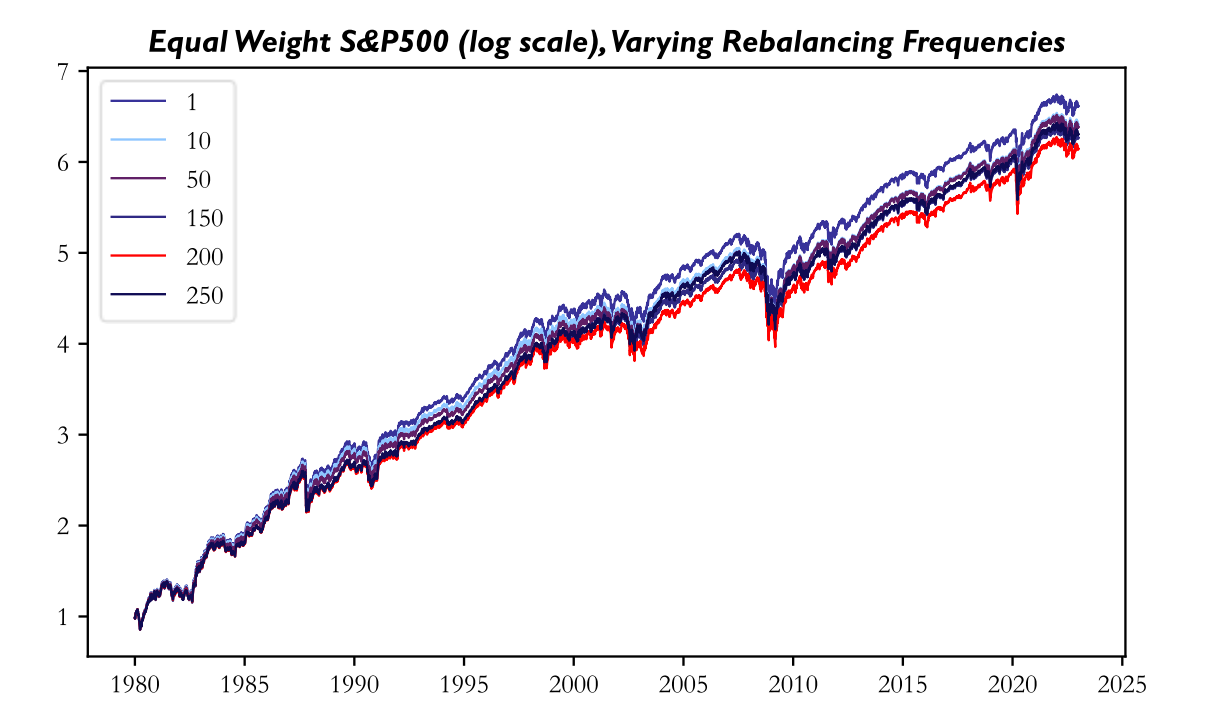
Source: BSIC
In the above timeframe, the annual return difference between the daily rebalancing strategy and 200-day rebalancing strategy is a sizeable 123 bps p.a. Evidently, the frequency of rebalancing plays a large role in portfolio construction.
A possible reason for the increased performance of more frequent rebalancing is the short-term reversal factor present in equity returns by which stocks with lower returns (and therefore lower weights when not rebalancing) tend to outperform stocks with higher returns. Rebalancing more frequently increases the weights of these stocks and decreases the weights of high-return stocks and could therefore contribute to outperformance.
To better gauge the differing return characteristics between the strategies, we calculate annualized tracking errors of strategies with lower rebalancing frequencies with the daily rebalancing strategy. For reference, the tracking error is the volatility of outperformance of a strategy regarding its benchmark. We choose the daily rebalancing frequency as a “benchmark” since it comes closest to a continuously rebalanced equal weight strategy. As expected, annualized tracking errors increase monotonically for less frequent rebalancing and range from an already substantial 43 bps for 10-day rebalancing to a large 175 bps for 250-day rebalancing.
While the above analysis may be helpful in showing the presence of a form of rebalance timing luck, the first objection any finance professional would have to choosing a higher rebalancing frequency would be the presence of transaction costs. Therefore, we repeat the previous portfolio construction exercise while factoring in 5 bps of transaction costs per transaction. We choose this transaction cost as it is in line with median transaction costs of institutional investors for US stocks (to read more on modelling more accurate transaction costs, please refer to this BSIC article).
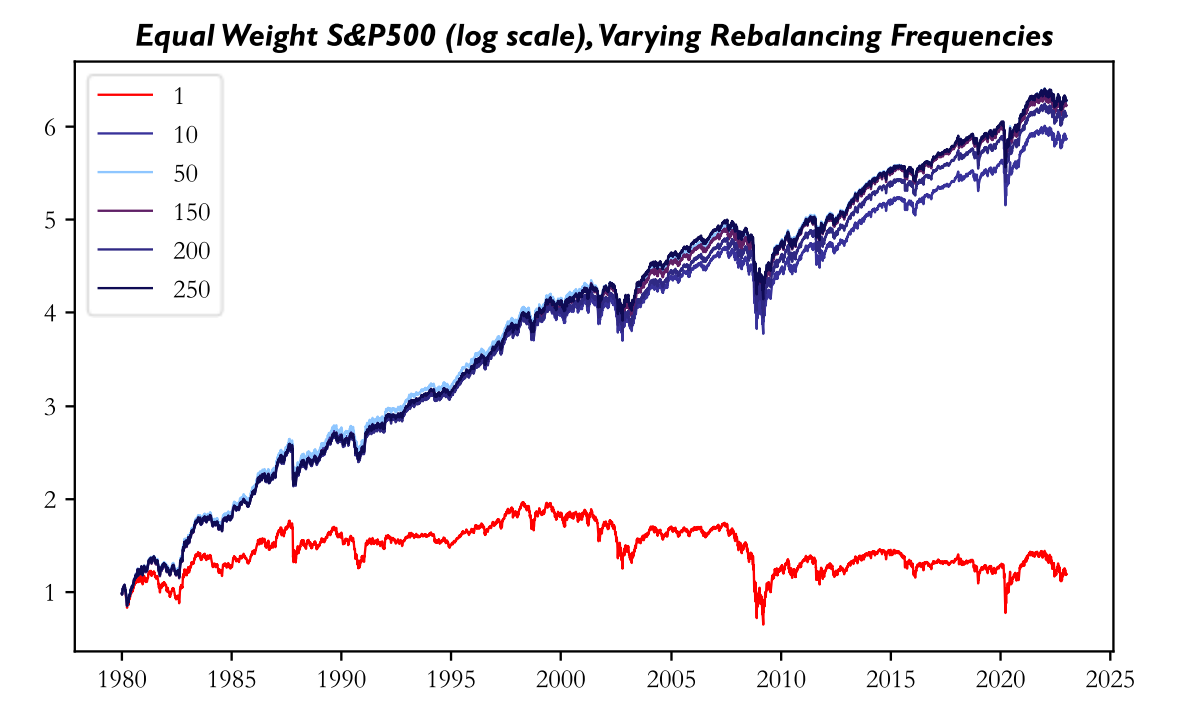
Source: BSIC
As is evident from the above picture, transaction costs drastically diminish the returns of those strategies that rebalance more often while the daily rebalancing strategy has more or less flat returns. In fact, the strategy with the highest return now is the strategy that rebalances the least frequently, namely the 250-day rebalancing strategy.
The Role of Rebalance Timing Luck in Portfolio Construction
For the second example, we construct a simple momentum strategy using the same universe of S&P500 stocks. Inspired by Jegadeesh and Titman [5], our long-only momentum strategy ranks all constituents based on their performance over the past year, buys the top 10th percentile of stocks and holds them for 20 days (which corresponds to a holding period of approximately one month). We then vary the day of the “month” from which the strategy starts, i.e., the baseline strategy starts after the first training set of 250 days, another strategy starts a day later, …, the last strategy starts 19 days after the baseline strategy, all while keeping the holding period of 20 days fixed. In order to account for the up to 19 days of missing strategy returns, we assume that all those strategies that start after the baseline strategy first invest in the baseline strategy until their starting point, rebalance to their own constituents and then use their own rebalancing points.
With this methodology, we get the below sample of cumulative returns. While these returns are all inferior to those of the equal weight indices calculated above, this is likely due to two reasons: 1. the strategy is long-only and momentum strategies also rely on the short leg, 2. the strategy has an investment universe of only large-cap stocks while momentum strategies achieve better returns for small-cap stocks.
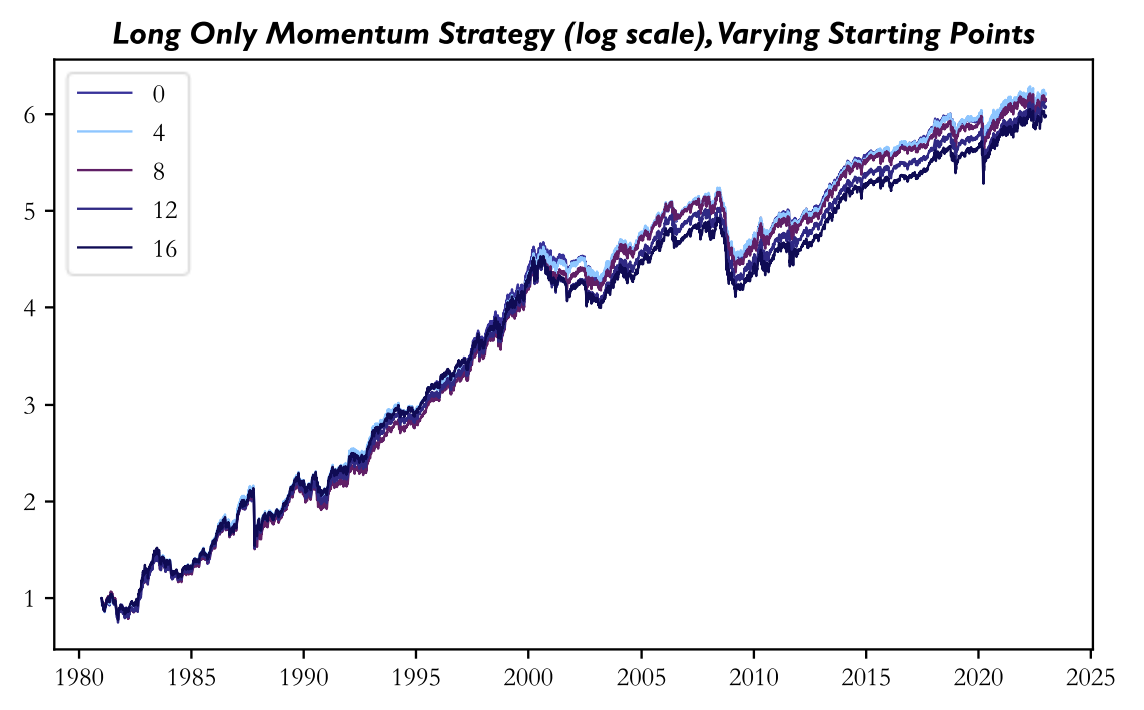
Source: BSIC
Note that the number of the strategy in the legend corresponds to the offset from the baseline strategy with 0 being the baseline strategy. Again, there is a large differential in returns with the best strategy (offset 3) earning 89 bps more p.a. than the worst strategy (offset 16). This differential is in line with those differentials found in the previously mentioned examples of rebalance timing luck. Below, you can find the returns of the best and worst strategy, and of the baseline strategy.
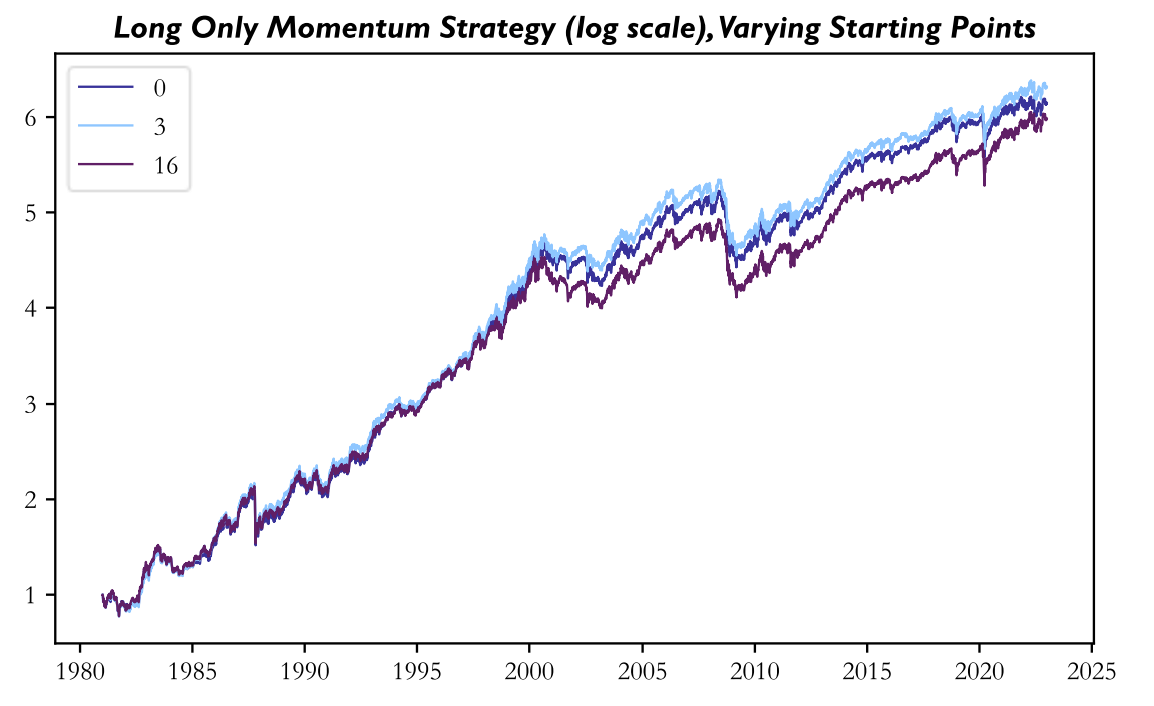
Source: BSIC
To further show that this differing performance is simply due to luck, we show the first 1000 trading days of the above three strategies after which the worst strategy in the full sample becomes the best strategy of the three.
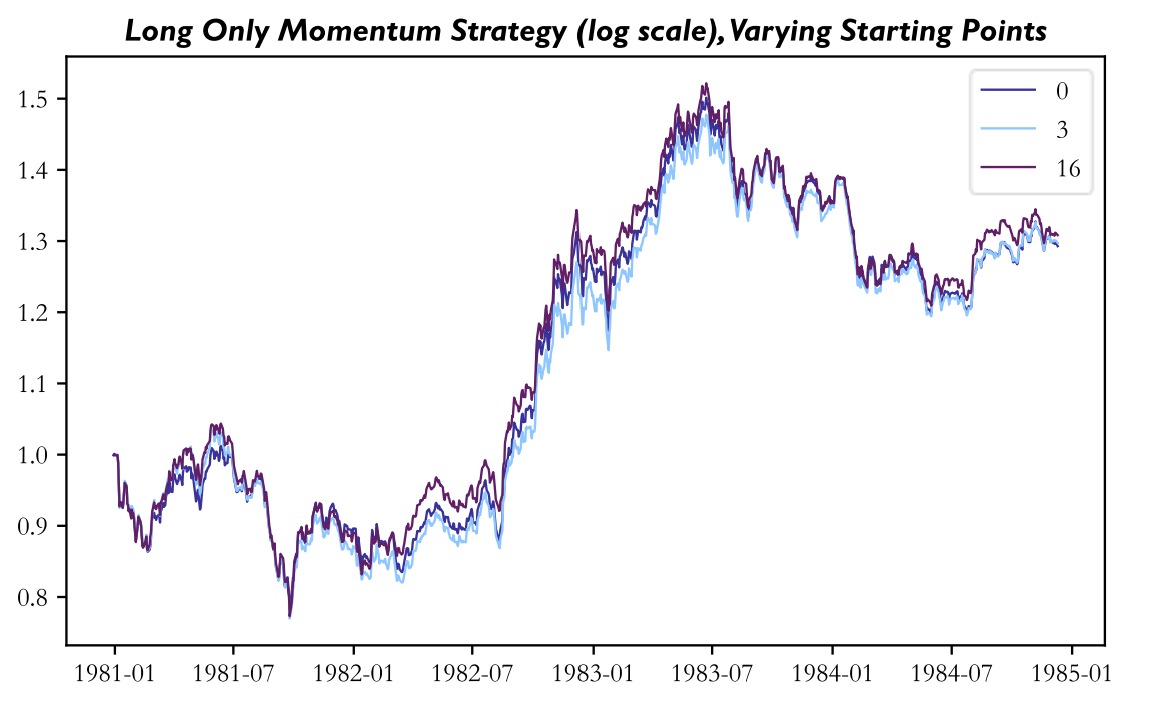
Source: BSIC
Implications for Strategy Backtesting and Implementation
As shown in the previous examples, there is a significant luck factor in implementing a trading strategy; in fact, this luck factor can often account for a return difference of around 1 percentage point per year. This has important implications for the backtesting methodologies of practitioners and academics alike. To illustrate, many strategies are backtested using returns spanning one calendar month; if, out of sheer luck, this exact rebalancing schedule shows particularly high returns, false conclusions could be drawn from a backtest. This is especially important for practitioners since 1. most systematic, periodically rebalanced strategies do not rebalance at the very start of a given month in practice, and 2. even if the same rebalancing strategy were used, returns could easily diminish after the backtest, out of sheer (bad) luck.
We therefore recommend that different rebalancing timings are used when backtesting a strategy in order to find out the true nature of its returns. The most apparent solution to minimizing rebalance timing luck in practice is running several portfolios of the same strategy, with them only differing in their rebalancing schedule. In fact, Hoffstein [6] mathematically proves that this portfolio construction methodology minimizes rebalancing luck. Still, there are drawbacks to this methodology, namely the increased operational complexity and transaction costs. Nevertheless, applying this methodology to the 20 sub-portfolios formed for our momentum strategy, we get the following returns which lie between the best and worst strategy.
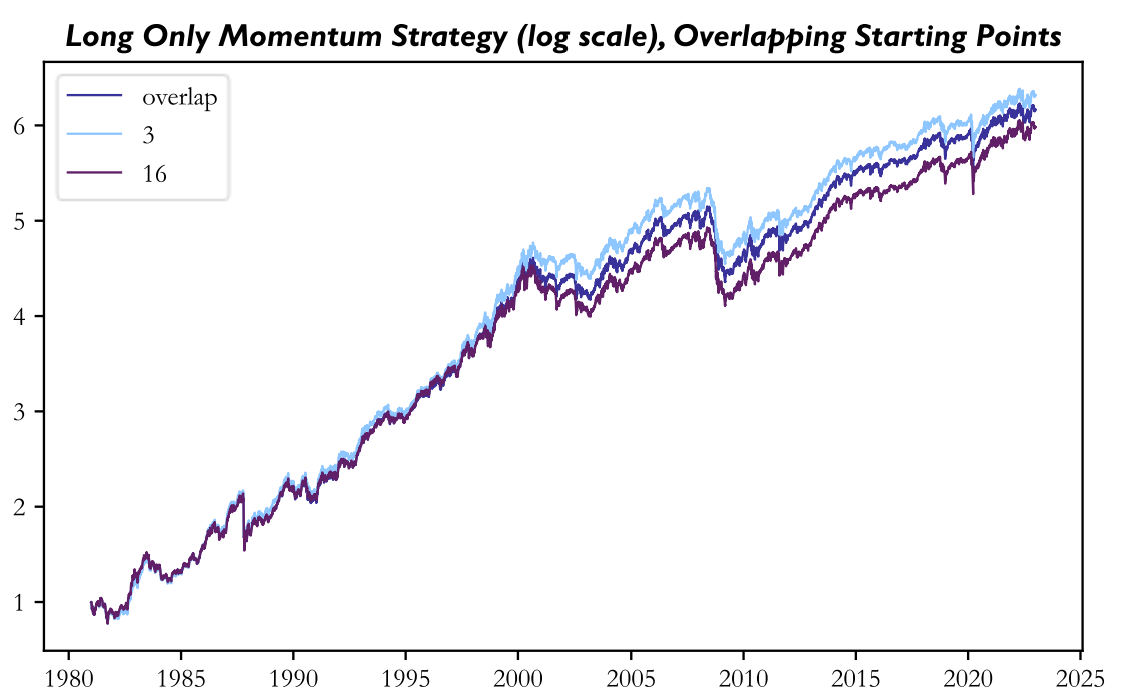
Source: BSIC
References
[1] Blitz, D., van der Grient, B., van Vliet, P., „Fundamental Indexation: Rebalancing Assumptions and Performance”, 2010, The Journal of Index Investing
[2] Hoffstein, C., Sibears, D., Faber, N., „Rebalance Timing Luck: The Difference between Hired and Fired”, 2019, The Journal of Index Investing
[3] Hoffstein, C., Faber, N., Braun, S., “Rebalance Timing Luck: The (Dumb) Luck of Smart Beta”, 2020, SSRN
[4] Braun, S., Hoffstein, C., Israelov, R., Nze Ndong, D., „The Hidden Cost in Costless Put-Spread Collars: Rebalance Timing Luck”, 2023, The Journal of Alternative Investments
[5] Jegadeesh, N., Titman, S., “Returns to Buying Winners and Selling Losers: Implications for Stock Market Efficiency”, 1993, The Journal of Finance
[6] Hoffstein, C., “Quantifying Timing Luck”, 2018, available at blog.thinknewfound.com


0 Comments