Introduction
The efficiency of football odds has been widely debated over the past years, especially as competition grew in the industry and forced bookmakers to improve their predictive power on the back of lower margins. In this article, we explore some of the biases present in the football betting industry and backtest the past 19 competitive seasons of the Premier League and Serie A to see if they persist through time. After giving an overview of the industry, we implement some basic strategies based on these biases to check for profitability. Lastly, we run Monte Carlo simulations to check if there is also statistical noise in this market aside from biases.
Overview of the Sports Betting Industry and its Biases
Sports betting markets are financial markets, as a bet on a team is very similar to buying a stock in a company.
In financial markets, efficiency implies that market participants cannot use strategies to beat the market and profit financially. Transferred to sports betting, market efficiency implies that betting odds (the assets) reflect all available information. Accordingly, there are no systematic strategies that would enable bettors to generate positive returns. In this article we want to investigate whether market inefficiencies are systematic and persist over time, or whether their appearance is of temporary and random nature.
Another motivation for continuing to investigate betting market systems is the development of the market itself. With the spread of online betting platforms, bettors benefit as bookmakers’ margins have decreased. It remains to understand whether bookmakers have improved their ability to predict events, compensating for the reduction in margins.
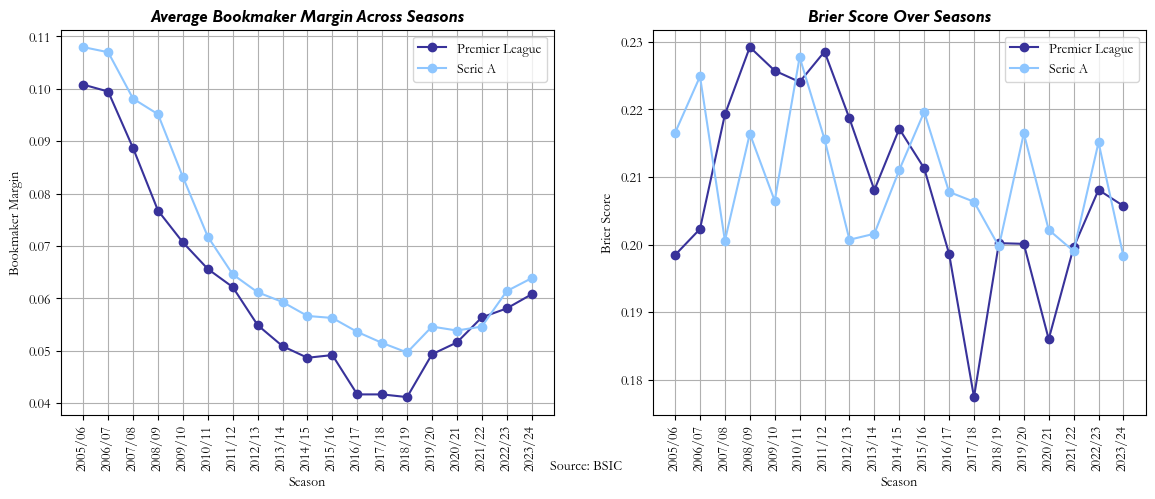
The panel below shows the average margins calculated as  for matches m = 1, . . . , M from seasons 2005/06 to 2023/24. In the two leagues covered, average margins decreased from more than 10% at the start of our observation period to about 5% in the 2017/18 season. We can then observe how COVID-19 had a positive impact on bookmakers’ margins, which persists even today. To remain profitable despite decreasing margin, bookmakers would have to improve their predictive power. We investigate this assumption by considering the Brier score which is given as:

where denotes the implied probability of bet i according to the bookmakers’ odds and indicates whether the bet won ( = 1) or lost ( = 0). Perfect predictions would lead to a Brier score of 0, while Brier scores increase in the inaccuracy of predicted game outcomes.
Comparing both panels, we observe that relatively high (low) Brier scores co-occur with high (low) margins. Spikes in the Brier score are observable in the two leagues considered, indicating that the predictive power of bookmakers’ odds varies considerably between seasons.
As it stands, we will focus on four main biases that have been mostly researched across academic papers, that will represent the cornerstone for our further analysis and strategies implementation.
The favourite-longshot bias represents the tendency of bettors to overvalue underdogs and undervalue favourites, potentially as a result of risk preference. Bookmakers could in turn deviate the actual betting odds away from the fair odds and offer lower returns on underdogs and higher returns on favourites. If such deviation is large enough, bettors can generate positive returns by simply betting on favourites. Similarly, the reverse favourite-longshot bias inversely suggests undervalued underdogs and positive returns when betting on them. In a later section, we will show that these biases are consistently present in the data.
The home bias refers to increased (lowered) payouts for the home (away) team compared to the fair odds, as bettors very often overestimate the driving force of the spectators. If the bias is large enough, a profitable strategy would suggest to systematically bet on the home team. Biased odds can also result from bettors’ sentiment, referred to as sentiment bias in the literature. Here, betting odds are found to be biased towards the more popular teams, quantified based on their average attendance in home games, resulting in positive returns when betting on them. Lastly, we analyse a bias towards newly promoted teams each season. We will later discover that all of these can be found in the data but usually do not persist over consecutive seasons.
Data & Methodology
To start with, we extracted the data for each football match in the Premier League and Serie A starting from 2005/06 to 2023/24, including final scores and odds for each outcome from the 5 most relevant bookmakers, from Football-Data (www.football-data.co.uk). The attendance data was sourced from https://www.transfermarkt.it/ for the Premier League and from stadiapostcards.com for Serie A. Data was analyzed for each season individually to reflect both specific aspects to that season and potential trends through time.
The first step in our data analysis was to fill the missing odds data with existent odds from other bookmakers and create a column with the average odd of the 5 bookmakers, for each outcome. Subsequently, a few binary variables are created: ‘Home’, reflecting whether the bet was placed on the home team or not; ‘OnPromH’, equal to 1 if the bet was placed on a newly promoted team playing at home; ‘OnPromA’, equal to 1 if the bet was placed on a newly promoted team playing away; ‘VsPromH’, representing bets against newly promoted teams playing at home; and ‘VsPromA’, representing bets against newly promoted teams playing away. A ‘DiffAttend’ variable was also created for each match, to show the difference in average attendance between the two teams across the respective season. Lastly, a binary variable ‘Won’ is created to show whether the bet was won or not.
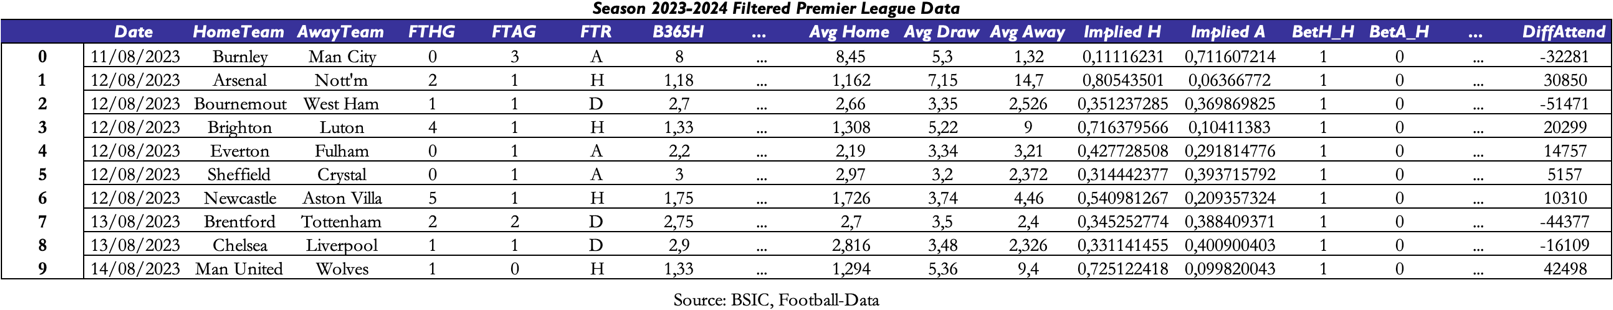
The following table represents a sample data frame for the Premier League 2023-2024 season, showcasing only the first nine matches rather than the complete dataset of 379 matches for that year. Important variables including the home team, away team, the full-time result (FTR) and the full-time home goals (FTHG) are included in this sample. It also includes the betting odds from Bookmaker 365, such as the B365H (home team odds). On the other hand, the B365A (away team odds), as well as the B365D (draw odds), and the other bookmakers’ odds are not shown, due to limited space. Furthermore, the sample data frame does not include the average odds for home, away, and draw across all five bookmakers. However, it does show the binary variables that were created for the BetH_Home (1) and the BetA_Home (0), to differentiate between home and away team bets. Yet, due to space constraints, the sample data frame does not include several other binary variables: BetH_OnPromH and BetH_OnPromA indicate bets on newly promoted home and away teams, respectively, while BetH_VsPromH and BetH_VsPromA reflect bets against these teams in home and away matches. Similarly, BetA_OnPromH and BetA_OnPromA represents bets on away teams against newly promoted teams, while BetA_VsPromh and BetA_VsPromA track bets against newly promoted away teams, providing insights into market perceptions and biases related to these teams. These variables are later used for the trading strategies involving promoted teams. Lastly, the DiffAttend variable captures the difference in average attendance between the two teams, offering insights into sentiment bias and its impact on betting behavior.
The Favourite-Longshot Bias
To check whether underdogs and favourites are correctly priced by bookmakers, we will compare the implied probabilities of a home win or away win outcome with the probabilities predicted by a logistic regression model. The model will use the ‘Implied Bet Probability’, ‘Home’ and ‘DiffAttend’ as independent variables and ‘Won’ as dependent variable, for a simplistic approach where the pricing of odds is analyzed based on the team the bet was placed on (home bias) and on how popular that team is versus its opponent (sentiment bias).
The ‘Implied Bet Probability’ variable is derived from the bookmakers’ odds for each outcome as follows:

where  is the implied probability of the bet, represents the average bookmakers’ odds for outcome i = {home, draw, away} and
  .
.
Using the logistic regression, we can predict the implied probability of a specific bet implied by the model and visually compare it to bookmakers’ implied probabilities. To do the following, we utilized all available data from the 2005-06 season to the 2023-2024 season, allowing us to assess potential biases over a comprehensive timeframe. The data was divided into two sets: one for home matches and another for away matches. For the away matches, we used the Implied Away Probability and DiffAttend as predictor variables, with the dependent variable indicating whether the away team won. For home matches, we incorporated the Implied Home Probability, a binary indicator for bets placed on the home team, and DiffAttend as a sentiment measure, with the outcome variable reflecting whether the home team secured victory. We then fitted independent logistic regression models to each dataset. This helps identifying any prevailing biases in how bookmakers’ price these outcomes over seasons by allowing us to quantify the links between the predictors and the likelihood of winning.
In turn, it also improves our understanding of betting market inefficiencies by gaining important insights into the alignment (or misalignment) of bookmakers’ odds with actual winning probability by examining the estimated coefficients and forecasted probabilities.
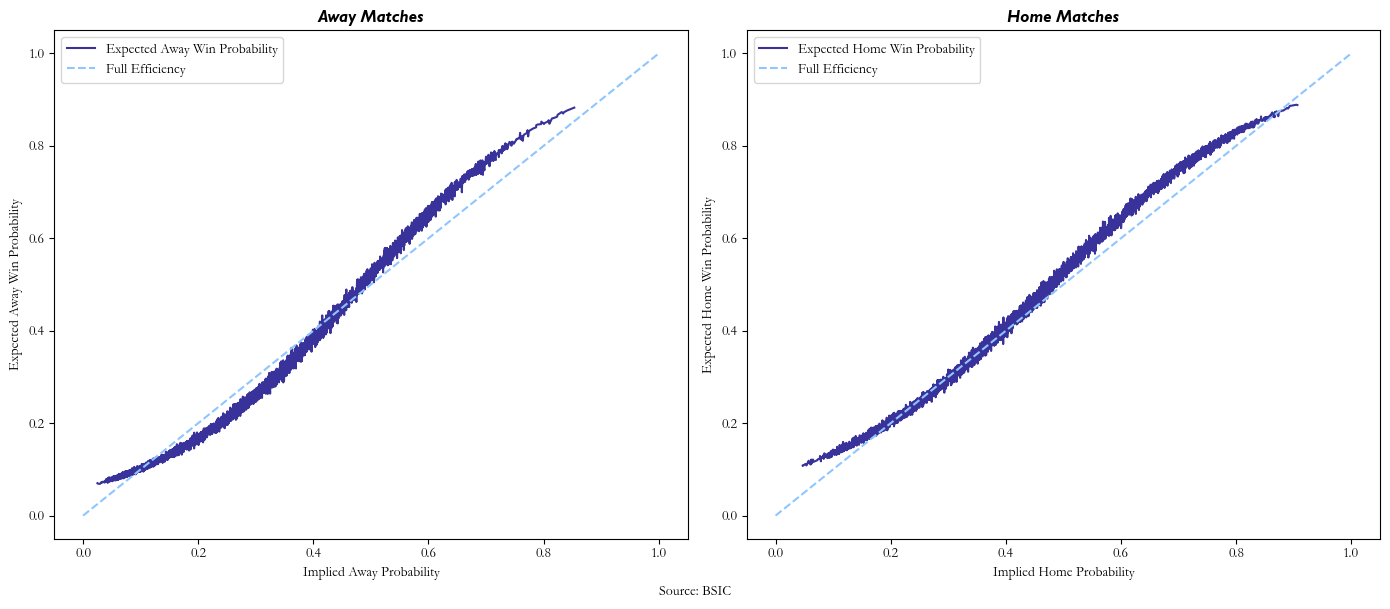
As the charts show, across seasons in the Premier League, bookmakers tend to undervalue favourites with implied probabilities between 0.5 and 0.8 playing at home, as the expected probabilities implied by the model is higher within this interval, whereas they tend to overvalue underdogs with implied probabilities between 0.2 and 0.4 playing away, as the expected probabilities implied by the model are lower for this interval. These findings signal the existence of a persistent favourite-longshot bias, in line with previous academic research done by Direr (2011) and Franke (2020).
Similarly, the outcomes of the logistic regression study for Serie A closely matched those of the Premier League. A consistent favourite-longshot bias was seen, with bookmakers overvaluing underdogs with implied probabilities between 0.1 and 0.4 when they played away and undervaluing favourites with indicated probabilities between 0.5 and 0.8 when they played at home.
Checking for Profitable Strategies
In this section, we are going to check whether the biases presented above persist over time or not and correspondingly see if bettors can exploit them and consistently make a profit through simple strategies. We are going to run three types of strategies, based on home bias, promotion bias and sentiment bias. All of them bet the same amount on each match, as a proportion of the total notional.
The first strategy places a bet on the home team for all the matches taking place during a season. The second, third and fourth strategies place money on matches involving only one newly promoted team, in the following sequence: betting on promoted teams playing at home, betting against promoted teams playing at home and betting against promoted teams playing away. We removed the strategy placing bets on promoted teams playing away as we considered that suboptimal in comparison to the others. The last strategy is based on the popularity of teams, and only places bets when the difference in average attendance between the two teams exceeds the 95th quantile of the variable “DiffAttend”.
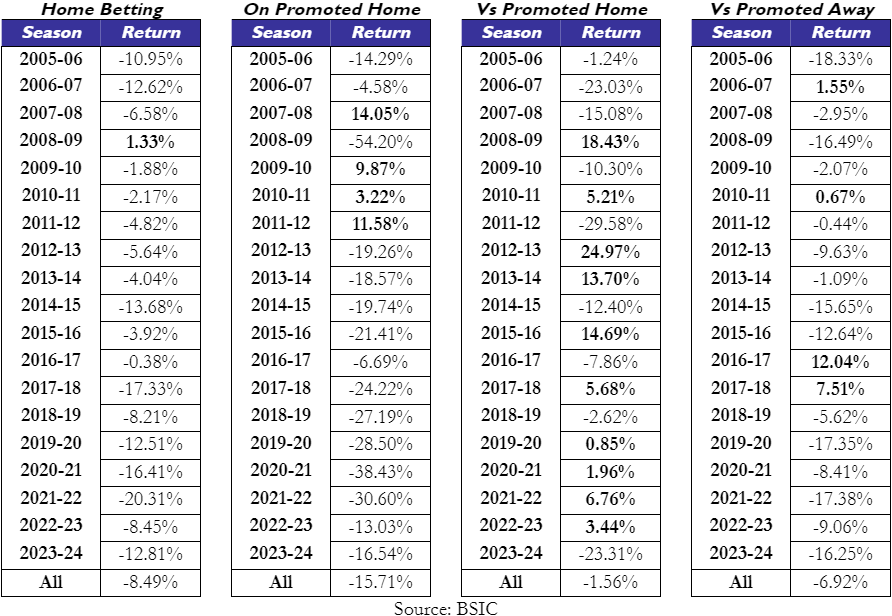
Below are the results of the first four strategies for the Premier League, showing both the returns for each individual s ason and the weighted average across all the seasons.
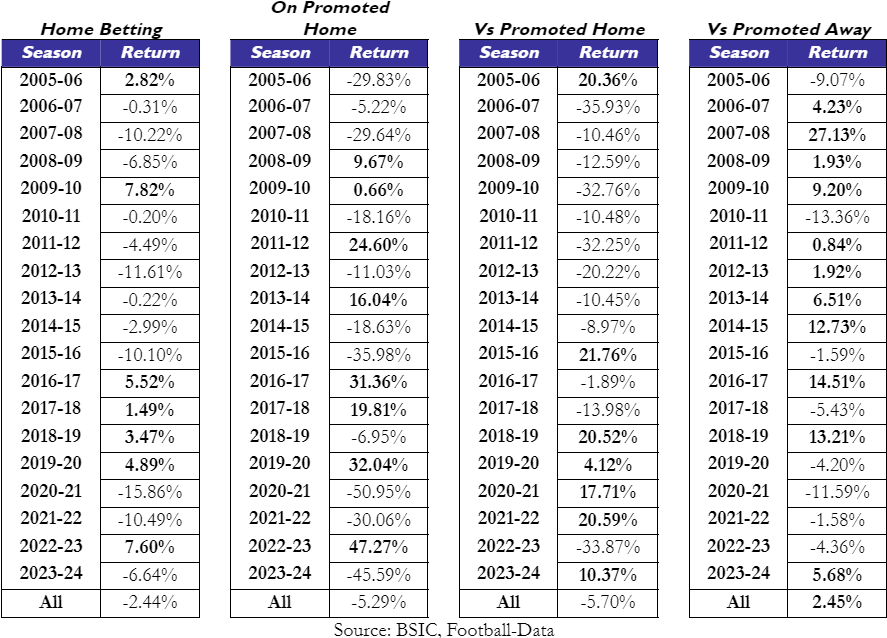
As can be seen above, consistently betting on the home team in the Premier League does not yield positive results in the long-term. Although betting on the home team increases the probability of winning a bet according to our previous model, this strategy delivers positive returns in only 7 out of 19 seasons considered. The only period seeing consecutive seasons associated with positive returns is from 2016/17 to 2019/20; however, using the same strategy going forward in 2020/21 would have erased all the gains. Overall, the negative returns exceed the positive ones in absolute value, making the weighted average over the period considered negative. As for the strategies involving newly promoted teams, betting only on the home games of these teams, as one can expect, would yield worse returns than the previous strategy. Since the number of matches considered per season is only 51 compared to 380 previously and the odds for promoted teams are considerably higher, there are some seasons like 2019/20 or 2022/23 that could deliver outsized returns following favourable outcomes. However, the strategy exhibits a lot of variance and is unattractive in the long run. When it comes to betting on teams playing against the promoted ones, it might be surprising that betting against promoted teams playing at home is less profitable on average than betting on them. Even though the strategy delivered positive results in 5 out of the past 6 seasons, the variance profile is very similar to the previous strategy’s one, making it daunting for bettors. Lastly, betting against promoted teams when they play away appears to be profitable, at least for the period considered, delivering about 2.45% per season, on average. The strategy presents positive returns in 11 out of the 19 seasons considered; however, most of these come in the first part of the period considered, potentially showing that bookmakers adjusted their odds through time and that the strategy is not as profitable as before.
Below are the results of the first fours strategies for the Serie A.
The conclusion is very similar for Serie A, although the results differ a lot. While 7 seasons of the Premier League generated positive returns in the “home betting” strategy, only 1 of the 19 managed to do so in the Italian league, with a weighted average of -8.49% for the period considered. Although betting on the promoted teams when playing at home yielded positive returns in 4 seasons, the average return Is twice as bad for this strategy. Betting against promoted teams when playing at home appeared to be even better than betting against them away, as the former delivered positive returns in 10 out of 19 seasons (but regardless the strategy’s average return is slightly below par), whereas the latter only saw 4 seasons of positive performance, with the past 6 seeing massive drawdowns. Thus, none of the strategies presented delivers positive returns on average over the timeframe considered in Serie A.
Lastly, we have the results of the “sentiment bias” strategy for both the Premier League and Serie A, which excludes the 2019-20 and 2020-21 seasons during which spectators were banned due to COVID-19.
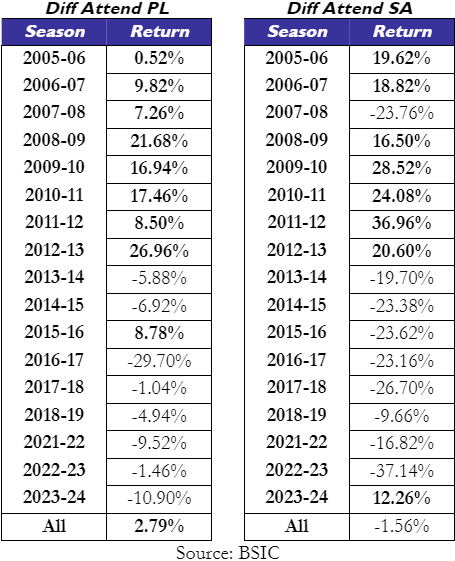 This strategy presents an interesting picture for both leagues. While it delivered astonishing returns until 2012/13, the strategy has only managed to generate positive returns in only one of the past 9 seasons. One of the reasons for this, alongside the decay in returns for other strategies performing well in the first part of the timeframe considered, could be that matches have become more balanced in the recent seasons.
Although betting against promoted teams playing away or on the most popular teams by fanbase in the Premier League brought positive returns on average for the period considered, we cannot consider this an inefficiency of the market as the return is still a few percentage points below bookmakers’ margin. As shown in the tables above, the results of strategies created based on assumed existing biases do not lead to the expected results.
Testing the Efficiency of the Market using Monte Carlo Simulations
To assess whether the biases observed in betting markets are due to chance rather than real inefficiencies, we conducted a simulation-based experiment on 17 seasons of English Premier League data. In a fully functioning market, the probability of an outcome should be entirely determined by the odds published by the bookmakers. To test this hypothesis, we used Monte Carlo simulation to generate 6460 simulated achievements of results (home win, draw, away win) for each of the games between the 2005/06 and 2023/24 seasons, based on the implied probabilities suggested by the odds. We will use p=0.1, p=0.05 and p=0.01 as significance levels and check what percentage of the simulations have a statistically significant bias for at least k seasons, where k=1, 2…,17.
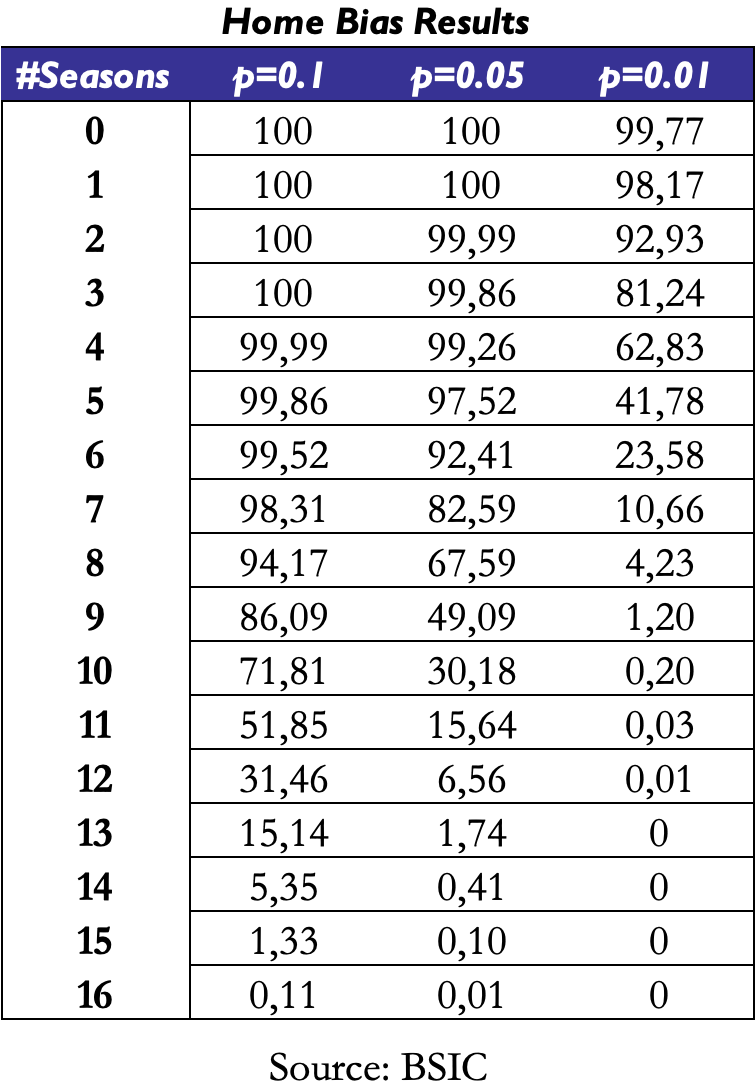
Even when assuming fully efficient markets, in 100% of our simulation runs we find at least one season with significant home bias on the 10% and 5% significance level. This implies that home teams consistently perform better than expected, particularly over short time frames. However, as we extend our analysis to cover more seasons and apply stricter alpha levels, we observe a clear decline in the detection of significant biases. The proportion of runs detecting substantial impacts at the 1% level falls to just 0.01% by the time we get to the 16th season. This trend suggests that although home biases are visible in lone instances, they become much less strong and consistent over time, indicating that those patterns are not as robust as they initially appear.
The outcomes of our Monte Carlo simulation thus underscore an important point: rather than being caused by actual market inefficiencies, statistical noise frequently influences the biases found by the logistic regression. Even if it is possible to have solid returns in specific season, these outcomes can just be the result of random fluctuations rather than market anomalies. These biases vanish when we examine more seasons or use more stringent significance thresholds, proving that they are not trustworthy markers of long-term inefficiencies. Given this, we draw the conclusion that there are not any long-term viable winning strategies. Although the biases that are frequently mentioned in the literature can be formed randomly and have no consistent statistical relevance, they may occur in some instances. This is particularly crucial for academics and bettors to take into account when analyzing past betting data. The idea that there are enduring market inefficiencies is undermined by the fact that, despite the appearance of exploitable inefficiencies, short-term abnormalities tend to disappear over long periods of time, according to our data. These results also highlight the difference between genuine market biases and random statistical noise.
It is important to distinguish between the potential for short-term financial gain and the presence of a systematic advantage in the market. According to our findings, inefficiencies are frequently the product of transient, random changes that have no lasting relevance. Hence, while biases can appear under specific conditions, the broader betting market remains largely efficient over time, with no reliable long-term strategies for exploiting these temporary deviations. Given the economic significance of these markets and their close ties to the sport itself, research on betting markets will remain interesting.
References
- Winkelmann D., Ötting M. and Deutscher C., “Betting Market Inefficiencies in European Football – Bookmakers’ Mispricing or Pure Chance?”, 2020
- Meier P.F., Flepp R. and Franck E., “Are sports betting market semistrong efficient? Evidence from the COVID-19 pandemic”, Internation Journal of Sport Finance, 2021
- Angelini G. and De Angelis L., “Efficiency of online football betting markets”, 2017
- Daunhawer I., Schoch D. and Kosub S., “Biases in the football betting market”, 2017
- Direr A., “Are betting markets efficient? Evidence from European Football Championships”, 2011
- Franke M., “Do market participants misprice lottery-type assets? Evidence from the European soccer betting market”, 2020


0 Comments