Introduction
The photovoltaic (PV) industry experienced remarkable growth in 2022, as evidenced by the record-breaking new solar installations of 268GW worldwide, an 60% increase from 2021. This surge in demand was primarily fueled by the growing awareness of energy safety and supportive government policies. While the environmental benefits of solar energy are common sense, the technology, the supply chain, and the planning of global governments behind the industry are not so well-known. For anyone who holds further curiosity about the photovoltaic industry, this article is a must-read.
The PV Panel Manufacture: A Helicopter View
Needless to say, the heart of the photovoltaic industry is solar panels. A solar panel is, essentially, a combination of dozens of solar cells. Nowadays, in general, there are three kinds of solar cells represented by three different technologies: Crystalline Silicon (c-Si) Solar Cells, Thin Film Solar Cells, and Third-generation Solar Cells. Today, 95% of the solar panels we can see in the market are composed of c-Si solar cells, while thin-film cells are usually used as Building Integrated Photovoltaics (BIPV). As for third-generation cells, they are unfortunately still in the lab stage, without economical methods for mass production.
The c-Si cells are processed from crystalline silicon (c-Si) wafers, which, in turn, are sliced from large silicon ingots. It may take up to a month for silicon ingots to grow, which can take the form of single crystals used for monocrystalline solar panels, or multiple crystals used for polycrystalline solar panels. While polycrystalline cells are moulded by melted silicon, monocrystalline cells are cut into shape, thus being more wasteful and expensive. The higher price is usually accompanied by better quality, and solar cells are no exception: monocrystalline cells are more energy efficient and stable than polycrystalline ones. As technologies such as diamond saws developed over the last five years, nowadays around 90% c-Si solar cells on the market are monocrystalline cells. The number of cells in a solar panel can vary from 36 to 144, while the most popular ones today are 60-cell and 72-cell.
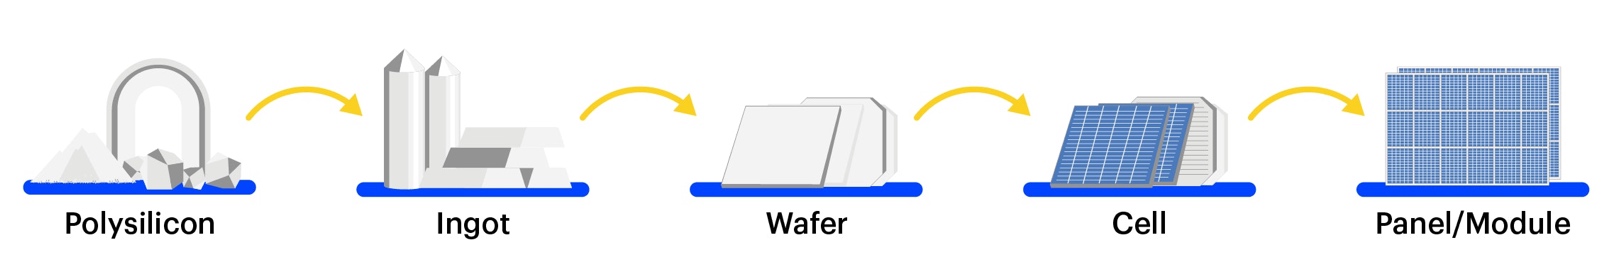
Figure 1 Source: Special Report on PV Global Supply Chains, IEA
Thin film solar cells, on the other side, are made from amorphous silicon (a-Si) and are the cheapest option for producing solar panels. However, while crystalline silicon cells can convert around 20% of the sunlight they receive into electricity, thin film cells only reach around 7% efficiency. Third-generation solar cells combine the best features of crystalline silicon and thin-film solar cells, providing high efficiency and improved practicality for use. Once the mass production problem is solved, third-generation cells are likely to dominate the market.
Increasing Capacity, Decreasing Cost
While the demand for solar PV grew rapidly over the last decade, the supply chain expanded even faster. At the end of 2022, global capacity for manufacturing wafers, cells, and modules exceeded demand by at least 100%. Even considering that 30-40% of the current manufacturing capacity was commissioned before 2018 and therefore requires modernization to comply with the latest technology standards, markets for wafers, cells, and modules are still oversupplied. The tightest supply comes from the most upstream resource, polysilicon, whose price skyrocketed during the pandemic due to labor and mobility issues. However, solar and storage advisory Clean Energy Associates (CEA) predicts that polysilicon production capacity could reach from 295 GW in 2022 to 536 GW by the end of 2023, so its supply will not be a concern in the short term.
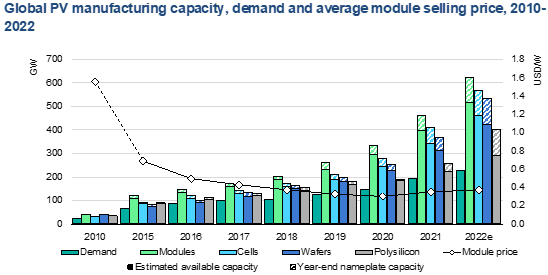
Figure 2. Source: IEA analysis based on BNEF (2022a), IEA PVPS, SPV Market Research, RTS Corporation and PV InfoLink.
The key driving factors of the manufacturing capacity are economies of scale and continuous innovation throughout the supply chain, which have significantly decreased manufacturing costs at every step of the process. Consequently, module prices have fallen more than 80% in the last decade, with 2021 being the only year in which the average price of modules increased, due to higher commodity and freight costs. Nowadays, geopolitical factors also kick in to elevate the module price. However, in the medium run, the trend of cost reduction is mostly expected to remain, as the development of new technology continues to improve material and energy efficiency.
Among all the materials needed for a c-Si module, polysilicon and silver together represent two-thirds of the total material cost while make up less than 5% of total material weight. More astonishingly, this is the result after decades of technological innovation, which cuts the polysilicon usage per Watt of a finished cell by 80% from 2004 to 2020 and silver usage by 75% from 2009 to 2018. We can imagine how dominant crystalline and silver were in the cost of a solar panel 20 years ago.
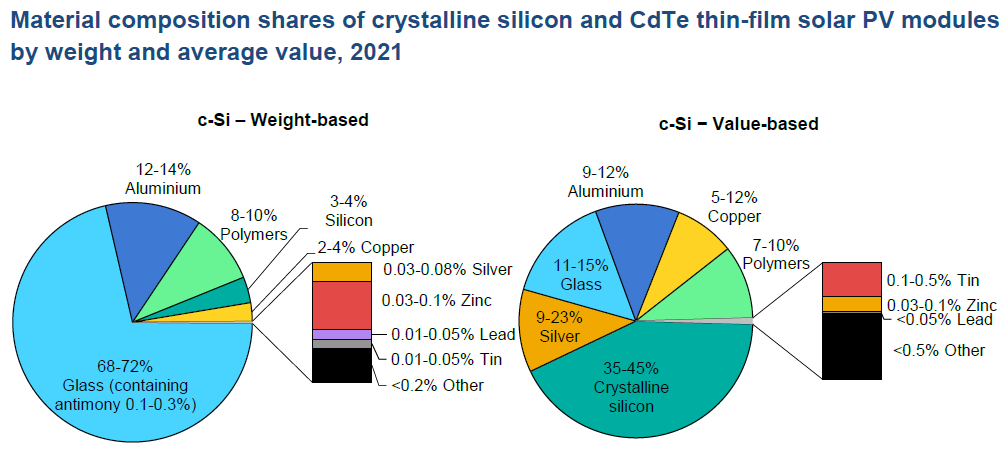
Figure 3. Source: IEA
Speaking of innovations in more detail, the introduction of the diamond wire saw in 2018 enabled a significant reduction of silicon consumption in the ingot-cutting process. The continuous increase of the wafer size and the switching from polycrystalline to monocrystalline wafers also contributed to improved material and energy efficiency in production.
China As The Dominant Player: The Supply Chain Risk
The past decade has seen a major geographical shift in solar PV manufacturing capacity. While European companies initially led the industry, China is now the global leader in solar PV production at all stages of the supply chain, where its share exceeds 80%, against its 36% share in global solar deployment. More specifically, Chinese companies are responsible for around 95% of the global wafer supply, 80% of the global polysilicon supply, and almost 90% of the global solar cell supply. The market share of Japan, Germany, and the US companies was gradually squeezed out and bitten up by Chinese companies during the past decade, raising some supply chain safety concerns.
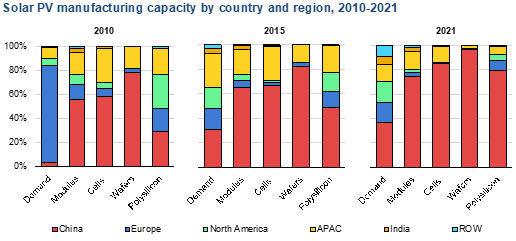
Figure 4. Source: IEA analysis based on BNEF (2022a), IEA PVPS, SPV Market Research, RTS Corporation and PV InfoLink
Responsible for 80% of global PV production, China is the only country where solar PV capacity exceeds demand. However, there are no signs that the capacity growth of the country will stop in the upcoming years. In 2021, China announced the addition of another 350 GW of polysilicon capacity and another 300 GW of wafer capacity, which will be functioning before 2024.
Meanwhile, Europe is also planning a major ramp-up of solar PV-based electricity to address its energy needs and the climate-neutral society target by 2050. This will require the region to significantly decarbonize the electricity grid and become less reliant on energy imports. To demonstrate its resolution, the EU has announced its target to realize 750 GW of installed PV capacity by 2030, more than triple its 224 GW capacity in 2022. This target translates to annual PV installation from 26 GW in 2021 to 70 GW in the second half of the decade. Being the country most impacted by the energy crisis, Germany alone plans to add some 160GW of new capacity by 2030.
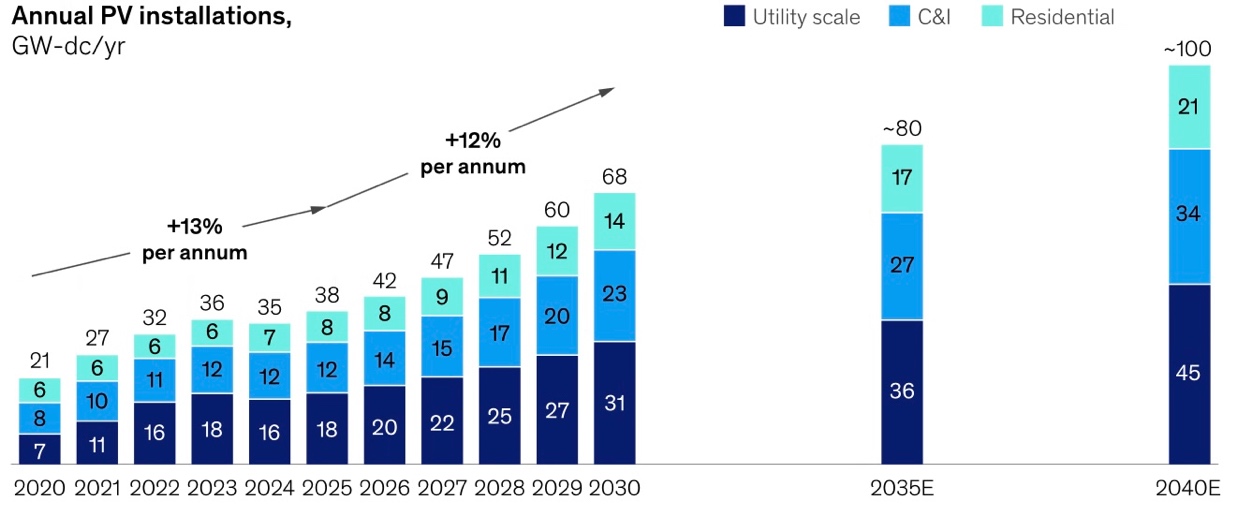
Figure 5. Source: McKinsey & Company
However, Europe currently relies almost entirely on China’s supply. While PV panels made in China are economical, the Ukraine conflict has exposed the severe risks of relying too much on imports for energy. To further address the challenges, the Energy Commission launched the Solar Photovoltaic Industry Alliance in December 2022, with the aim of developing a European solar-PV ecosystem that will secure and diversify supplies. Currently, Europe has between 6GW and 8GW of module capacity, approximately 1GW of cell capacity, and 2GW of wafer capacity, accounting for less than 1% of global capacity. By producing PV panels domestically, Europe is likely to incur a 20/25% cost increase across the full value chain against the current market levels, due to a higher cost of labor, materials, utilities, and capital. Nonetheless, Mckinsey predicts that a few factors could pave a potential path for leading European solar companies to achieve competitiveness in the market. While retail consumers are likely to be willing to pay a premium between 10% and 20% for European-made panels with full traceability, energy-intensive players, especially large ones, will still be sensitive to these smaller differences, which puts an emphasis on the need to close the structural gap as much as possible.
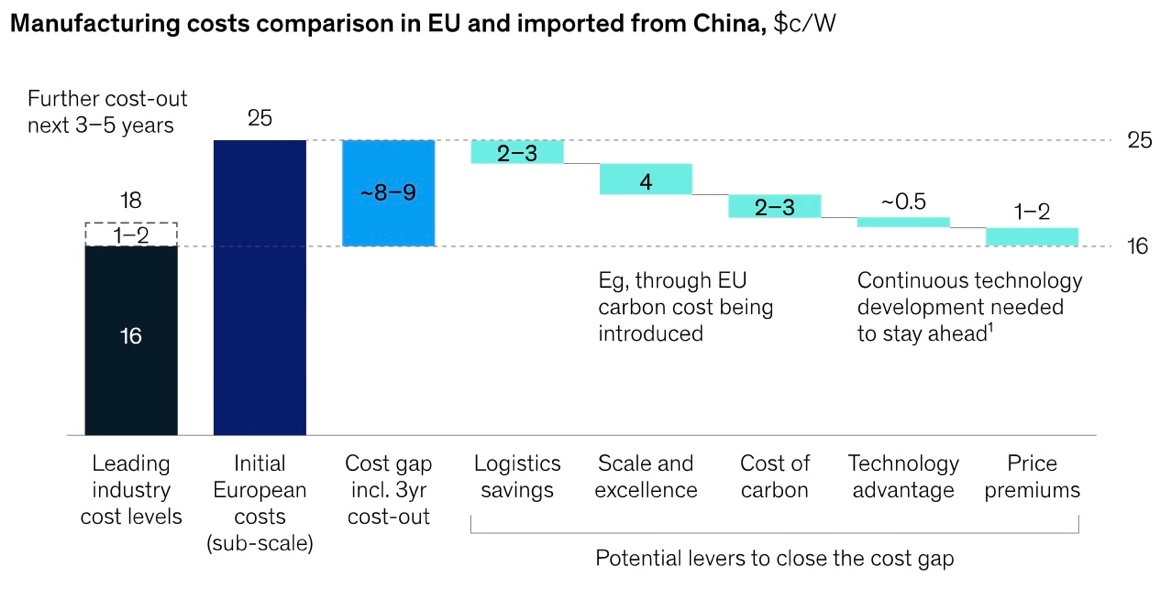
Figure 6. Source: McKinsey & Company
The Policy-Driven Solar Panel Demand: A Global Perspective
One does not need to be a photovoltaic industry expert to understand that the demand for solar panels is likely to increase over the next few years. The main reason is that solar panels do not emit any pollutants during use, making them a very clean energy generator. As the world works together to keep the global average temperature within 2.0 degrees Celsius above pre-industrial levels, governments around the globe are promoting the adoption of solar panels as an alternative energy source to carbon-intensive fossil fuels. To understand how the demand for solar panels will evolve in the future, it would be helpful to take a close look at the approaches adopted by different regions individually.
The first region we consider is the US. A couple of days ago, the US House of Representatives voted to restore import tariffs on solar panels from some Southeast Asian countries, while Biden had removed these tariffs just a few weeks ago. The House’s aim is, of course, to protect domestic manufacturers of solar panels, as panels from Asia are far cheaper. However, the vote incurred strong opposition from US solar panel buyers, who benefit greatly from the lower-cost Asian panels flooding the US market. Recent estimates show that Chinese solar panels are, on average, 30% cheaper per Watt than their US competitors, with Chinese panels costing around $0.35 per Watt, while US ones cost $0.5. The aforementioned event embodies the two competing priorities within US climate change policies: the protection of the local industry against the guarantee of people’s economic benefits. This problem will continue to affect the penetration of solar power in the US, but in general, we can expect the demand for solar panels in the US to grow substantially over the following years, thanks to the recently passed Inflation Reduction Act. The act seeks to subsidize both consumers’ and companies’ purchases of solar panels, among many other things. Specifically, the law introduces a $10bn investment tax credit and $30bn production tax credit aimed at clean manufacturing, which includes the installation of solar panels. Consumers will receive a 30% tax credit for the installation of solar panels, and this program will last until 2032. This means that consumers can effectively apply a 30% discount to what they actually have to pay for the installation of solar panels.
The passing of the Inflation Reduction Act in the US has been met with enthusiasm from business leaders, who see it as a necessary government support to economically shift their companies towards climate neutrality. However, the policy primarily focuses on supporting the production and installation of clean energy products, including solar panels, in the US. This means that the EU must find a way to stay competitive when the US is handing out subsidies so generously. Currently, the climate policy in the EU is more focused on control and command without compensating the actors for their investments in clean energy. To stay competitive, the EU would need to come up with an equivalent plan. Even if such a program does not come to fruition, there are other programs, such as the European Green Deal, that mandate countries to hit certain climate goals and help them manage this energy transition with EU funds in excess of €100bn. Additionally, in 2021, the EU Commission proposed increasing the Bloc’s renewable energy target from 32% to 40% by 2030, before being further increased to 45% in May of last year. In addition to these EU rules, there are also rules on a national level that will increase the demand for solar panels. For example, Germany recently introduced a law that will ban the installation of new oil heating systems in houses starting in 2026, meaning that some who previously would have installed oil heating systems will now install solar panels.
In terms of Asia, its policy differs moderately from Europe and the US, as the continent is generally less committed to going off fossil fuels. China, for instance, has decided to remain heavily reliant on coal power plants for heating. This means that there are fewer comprehensive subsidization programs in the continent for going off fossil fuels. Nonetheless, the solar panel sector has seen tremendous growth in the past five years in Asia. Five out of the ten countries with the most solar power generation capacity are Asian countries, including China and Vietnam. China’s solar power generation capacity has exploded from 1GW in 2010 to 307GW in 2021. Hence, despite the lack of the same subsidization as in Europe or the US, the sector is still experiencing massive growth due to the low cost of acquiring solar panels and the favorable weather conditions for solar panel use in large parts of the Asia Pacific region. The Chinese government, in particular, is focused on increasing the adoption of clean energy, mandating that 18% of its power generation should be derived from wind and solar by 2025. India, which recently became the world’s most populous country, committed to having 50% renewable power generation by 2070 (up from the 22% it currently has), meaning that it too will substantially increase its demand for solar panels, as these were explicitly stated as the main medium the country wishes to use to attain its goals. We should anticipate this growth in demand from Asia to continue, as energy demand in Asia will continue to grow exponentially as the region’s countries develop.
In conclusion, we can expect further growth in demand for solar panels in major regions of the world, not only because solar panels are good for the environment, but also because they are cost-effective. Poorer countries in hot areas may also start demanding solar energy, due to their geographic location making this type of energy source ideal. The additional prospect of the EU mimicking the US subsidies for clean energy projects further gives the outlook for very strong demand growth for solar panels. However, we should note that the development of new energy sources, such as nuclear fusion, could reduce demand for solar panels in the medium to long run, rendering solar energy obsolete.
Major Players In The Industry
Now that we know the big picture of the demand and supply of the solar photovoltaic industry, we can take a close look at specific leading companies from China, the United States, and Europe that are present across the industry’s value chain.
LONGi Green Energy Technology – China
Founded on February 14th, 2000, and based in China, LONGi Green Energy Technology is the world’s largest manufacturer of solar panels. It has five established business sectors: silicon ingots and wafers, solar cells and modules, commercial & industrial distributed solar solutions, green energy solutions, and hydrogen equipment. During 2022 alone, LONGi exported an eye-watering number of 100 million solar panels. Currently, the company has seven domestic production facilities, and two overseas factories in Malaysia and Vietnam, with another one under construction in India.
Adjusted to US Dollars, the firm in 2022 reaped revenue of $19.15bn and realized a net income of $2.2bn. During the past 5 years, the company has enjoyed a revenue CAGR of 51%, which has built and strengthened its status as the world’s largest photovoltaic panel producer. As of mid-April 2023, LONGi is valued at around $41.3bn, representing a trailing P/E ratio of 24x and an EV/EBITDA ratio of 18x.
For its upcoming future, the firm aims to maintain its global market share of monocrystalline silicon wafers at around 45% and increase its share in solar modules to over 30%. As of 2020, the company supplied around 19% of solar modules worldwide. Furthermore, the company plans to invest $6.7bn to build a production plant in the Shaanxi province, capable of producing 100 GW of solar wafers and 50 GW of solar cells every year. This will be the world’s largest solar factory, and it will more than double its current PV wafer and cell capacity, strengthening its market share. However, the company must make production adjustments and seek new markets, among other things, to compensate for the decrease in US imports because of tariffs.
First Solar – United States
First Solar is a leading American photovoltaic technology company and a global provider of solar modules. Founded in 1999, the company remains unique among the world’s ten largest solar manufacturers for being the only US-headquartered player on the list with no manufacturing capacity in China. In the United States, for the Solar Panel Manufacturing industry, the firm accounts for an estimated 20.9% of the total revenue. The company has the largest solar manufacturing plant in Ohio and is in the process of expanding its production capacity by planning on commissioning a fourth manufacturing facility by 2025. Furthermore, the company is aiming to have a global manufacturing capacity of around 21 GW/year by 2026.
In 2022, the firm had revenue of $2.6bn, but had a negative net income of $44.2m. The company blamed the rising costs of raw materials, the supply chain bottlenecks, and the elevated freight costs, which clearly affected them as they hold most of their products in the United States, as part of the reasons for their financial downturn. Furthermore, over the past years, the company has struggled, and its total sales have diminished.
During the past 5 years, the company has enjoyed a revenue CAGR of -2%, which shows the difficulties it has been going through lately. Additionally, as of mid-April 2023, First Solar is valued at around $20.09bn, representing a worrisome EV/EBITDA ratio of 69x. Nonetheless, with the passing of the IRA, which extends green energy subsidies, the company is expected to benefit. Furthermore, the opening of new plants will help their financial performance.
In the upcoming future, the firm is expected to continue growing and capture a larger market share. In the past few years, the company has struggled, primarily because it never shifted most of its production abroad and benefited from lower costs, as many other firms did, and because the tariffs to protect the US solar industry that have been in place since 2018 have been proven highly ineffective. Nonetheless, the firm is expected to receive significant benefits thanks to the IRA program established by the US government. Furthermore, they are expecting to inaugurate a plant in India in the second semester of 2023, which will help them produce at lower costs and expand their geographic presence.
Wacker – Europe
Wacker is a leading German firm specializing in the production of chemical products. With a portfolio of over 3,200 products, they are focused primarily on silicon-based products. The firm was a pioneer and is currently the world’s market leader in the production of polysilicon. At its three polysilicon manufacturing locations, in Burghausen, Nünchritz, and Charleston (US), the company has an annual production capacity of over 80,000 metric tons, which represents around 20 GW of polysilicon production. Furthermore, the firm now offers a portfolio of products along the entire solar value chain. Overall, the firm has 27 production sites in 11 countries and is divided into four business divisions: silicones, polymers, bio-solutions, and polysilicon.
Adjusted to US Dollars, the firm in 2022 made a revenue of $8.6bn and had a net income of $1.3bn. Compared to the past years, the firm has been experiencing continuous substantial growth, with an increase in revenue of about $3bn over the past 2 years as well as a six-fold increase in their net income. Furthermore, during the past 5 years, the company has enjoyed a revenue CAGR of 9%, which has helped them consolidate its position as a global leader. As of mid-April 2023, Wacker is valued at around $9.7bn, representing a trailing P/E ratio of 6x and an EV/EBITDA ratio of 3.25x. Strong demand in the photovoltaic industry, as well as an overall increase in demand for semiconductors, will drive Wacker’s revenues for the upcoming years, further consolidating it as a global leader.
In terms of its own plan, Wacker is aiming to increase its market share in the solar polysilicon industry from 11% to 12% in 2025 by growing its production to 53 GW/year. It is estimated that this will cost them around €120 million per GW. Furthermore, the company expects to grow its sales to €10bn and have an EBITDA margin greater than 20% by 2030.


0 Comments