Introduction
The European Union’s Emissions Trading System is undergoing major changes as part of the EU’s ambitious “Fit for 55” climate package. These reforms tighten the carbon market in unprecedented ways to help meet a 55% emissions reduction by 2030. Three key developments are reshaping the EU carbon market landscape: the phase-out of free carbon permits that were previously given to industries for free, a steep decline in the overall emissions cap, and the introduction of a Carbon Border Adjustment Mechanism (CBAM) that puts a carbon cost on certain imported goods. We examine these changes and their implications, from how EU carbon allowance futures and energy markets are reacting, to investment trends in clean energy, to the companies and sectors affected.
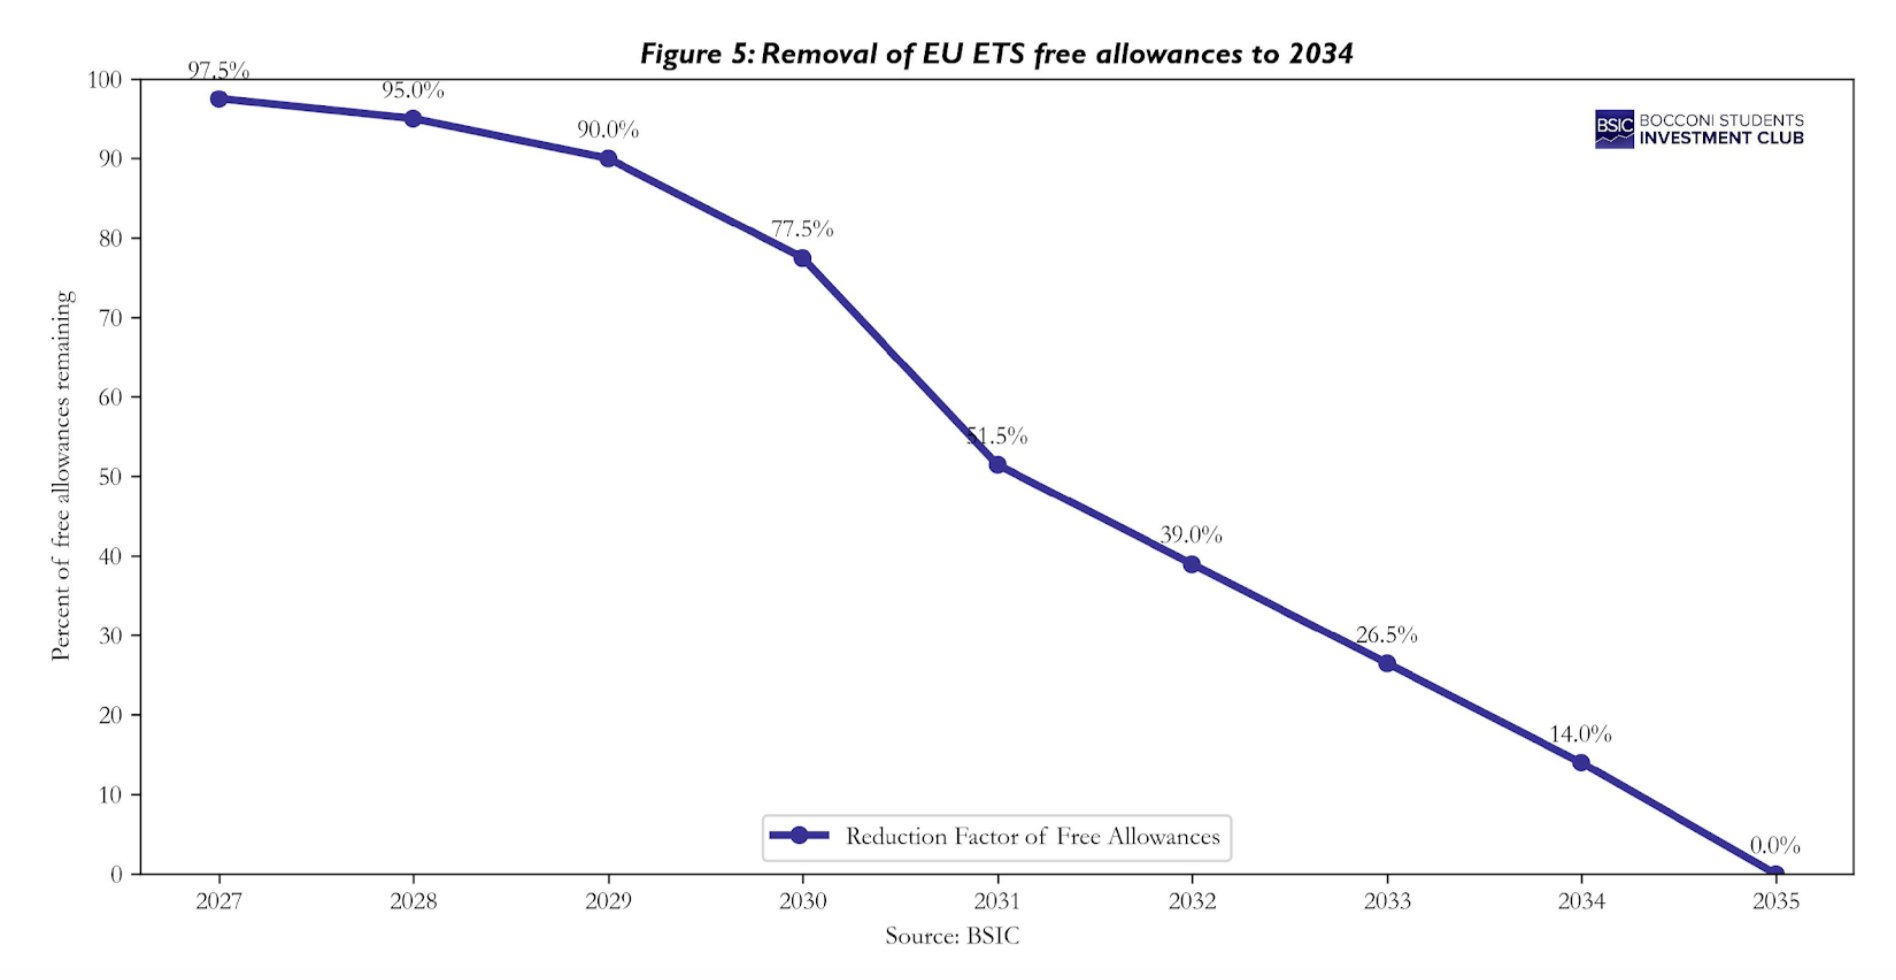
How the phase out works:
2025 will be another transitional year for the EU Emissions Trading System market. In 2026, the first year of CBAM’s definitive operation, which implies free allocations for CBAM-covered sectors, will be almost full, accounting for around 97.5% of the benchmark emissions still given for free. Each subsequent year, the share of free allowances shrinks and the CBAM obligations increase on a matching schedule to “level the playing field”. For example, free allocation is slated to drop to 51.5% of emissions by 2030 and to only 14% by 2033. In 2034, the free allocation becomes zero, meaning companies must buy allowances for all their emissions, with CBAM fully in place to cover imports.
In tandem with phasing out free permits, the EU is tightening the overall cap on emissions in the ETS. The emissions cap represents the total number of allowances available each year across the system, i.e. the “carbon budget” for covered sectors. Under the recent reforms, this cap is being steeply reduced over 2024–2030 to align the ETS with more ambitious climate targets. The cap decline is achieved through two mechanisms: an increase in the annual Linear Reduction Factor (LRF); the percentage by which the cap shrinks each year, and one-time “rebasing” cuts that permanently remove a chunk of allowances from the system.
In addition to the higher LRF, policymakers agreed to permanently cancel 117 million allowances by 2026 through two one-off adjustments. Specifically, the cap was rebased down by 90 million permits in 2024 and will be cut by another 27 million in 2026. It’s worth noting that even as the cap declines, the ETS is expanding in scope, adding new sectors like maritime shipping, and a parallel new ETS for buildings and road transport by 2027. Although, measures are in place to prevent these expansions from undermining the cap integrity.
The big question: What is CBAM?
One of the most significant and novel policies accompanying the ETS reform is the Carbon Border Adjustment Mechanism (CBAM). The CBAM is essentially a carbon tariff on imported goods, and it aims to equalize the carbon costs paid by EU domestic industries and those faced by foreign producers selling into the EU. This mechanism addresses carbon leakage in a new way: instead of giving free permits to EU industry to keep them competitive, it makes foreign exporters pay an equivalent carbon price on carbon-intensive goods. Starting in 2026, importers of certain products will need to purchase CBAM certificates for the emissions embedded in those goods, at a price indexed to the EU ETS carbon price. Furthermore, The EU has been planning to extend the scope of the CBAM to all EU ETS products by 2030. As a result, imported construction materials with high carbon footprints will become more costly, since importers must buy certificates that reflect the amount of CO₂ emitted in their production. However, while the initiative is putting pressure on high carbon-leakage industries, it is paving a way for the uprising of cutting-edge technology and showing investment initiatives towards renewable energy (a topic discussed later in the article).
CBAM will initially cover imports in a limited set of emissions-intensive sectors that are at high risk of carbon leakage. These are cement, iron and steel, aluminum, fertilizers, electricity, and hydrogen, as well as some precursor materials and a few downstream products in these categories. These mirror the sectors whose free allowances are being phased out. The inclusion of electricity means imported power will also face carbon costs under CBAM. Notably, the CBAM regulation will also account for indirect emissions in some cases to prevent a sort of “carbon arbitrage”. Over time, the scope could expand to other products (the EU will assess adding more sectors or downstream products), but for now the focus is on these core heavy industries.
Implications for the ETS system and EU energy sector
Operational since 2005, the European Union Emissions Trading System (EU ETS) is the oldest cap-and-trade system in force and the largest in terms of the trading volume and value. It remains a cornerstone instrument of the EU’s policy framework to combat climate change and reduce GHG emissions cost-effectively. But recently, speculative investment in carbon has grown as many see EUAs as a bet on tightening climate policy. During periods of structural scarcity (like the one expected post-2026 when supply drops), financial investors anticipate price surges and may take long positions accordingly. Indeed, the expectation of future scarcity can lead to early position-building, analysts noted that some investors might treat 2025 as a chance to accumulate EUAs relatively “cheap” before the big supply crunch hits in 2026 when the REPowerEU extra auctions end.
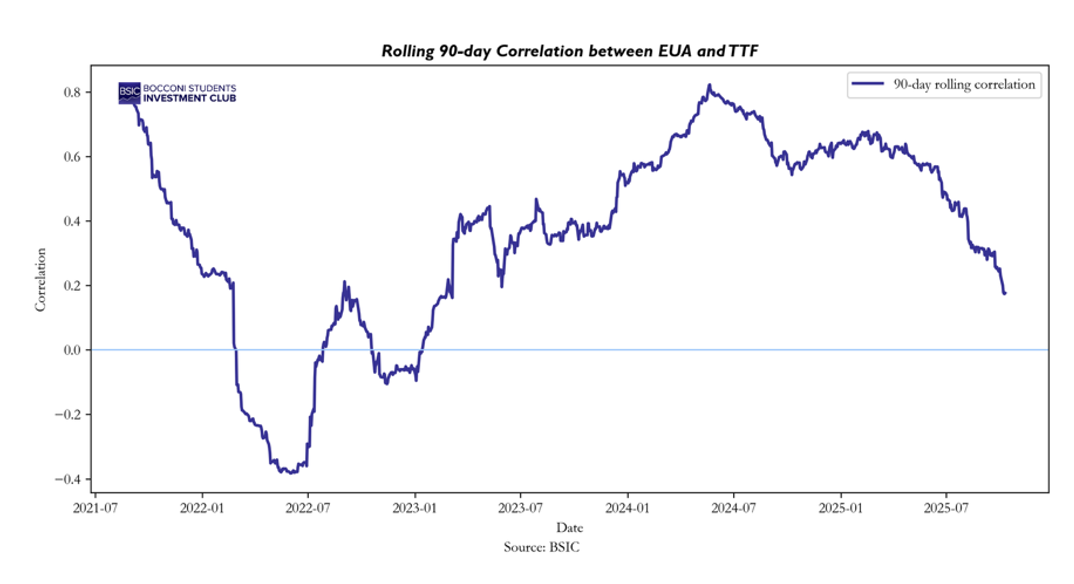
However, the carbon market can be volatile. Short-term price swings often occur due to energy market fluctuations and technical trading. A clear example is the strong correlation that has developed between EU carbon prices and natural gas prices. Data show that in late 2024, the correlation between front-month TTF gas and front-December EUA futures was over 0.8. This means when gas prices spike, carbon prices tend to rise in tandem. The mechanism is that expensive gas makes coal more competitive for power generation, which results in higher carbon emissions and thus greater demand for allowances, so carbon traders closely watch gas market signals.
The power generation sector in Europe is directly affected by carbon pricing, and the recent market moves intensify those impacts. Power companies must hold EUAs for every tonne of CO2 they emit, so high carbon prices significantly raise the cost of fossil-fueled electricity. This has accelerated the shift from coal to cleaner sources. In the mid-2010s, carbon prices were too low to influence the power mix; but by 2021, with prices surging over €50, utilities began switching from coal to gas to save on carbon costs.
More recently, as carbon prices went even higher (€80–100), natural gas plants face high costs, making renewables and nuclear energy extremely competitive by comparison. In effect, the carbon price gets factored into electricity prices: when coal or gas plants set the market price, they pass through their carbon permit costs to the power price. This means low-carbon generators (wind, solar, hydro, nuclear) can earn higher revenues without incurring these carbon costs, improving their profitability.
In the long term, a strong carbon price incentivizes energy companies to invest in clean generation and phase out coal. We have seen major European utilities respond accordingly: companies like RWE in Germany have accelerated coal plant closures and invested heavily in renewables, explicitly citing carbon costs and climate targets as driving factors. France’s Engie moved out of coal and into renewables, and Italy’s Enel set plans to go carbon-neutral, all under the expectation of rising carbon prices. The oil & gas majors, while not directly under the ETS for upstream emissions, participate via their refinery and power assets, and also trade carbon. They have trading divisions that are active in carbon markets, and some have even mentioned carbon trading profits in earnings. These companies are also investing in low-carbon technologies (renewables, biofuels, hydrogen) that stand to benefit from a high carbon price environment, where fossil-based competitors become relatively more expensive. It’s telling that a carbon price of around €100/ton has been cited as a threshold to make green hydrogen cost-competitive with conventional hydrogen made from natural gas.
As a result, the evolving carbon market is creating clear winners and losers in the corporate world. On one side, companies that provide climate solutions or operate with low emissions are in a stronger position. On the other, firms with carbon-intensive operations and no mitigation strategy face growing cost pressures and competitive disadvantages.
Market trends
On a historical note, the price of EU Allowances has climbed from single digits a few years ago to record highs, reflecting the tightening measures described earlier. In February 2023, the EUA price hit €100 per ton for the first time, a symbolic and real milestone that underscored the cost of polluting in Europe reaching new heights. In fact, the benchmark Dec-2023 contract traded as high as €101.25 on Feb 21, 2023. This rally was fueled by the agreement on ETS reforms in late 2022 and a wave of compliance buying before the April deadline for 2022 emissions, among other factors.
More recently, after the early-2023 peak, carbon prices have seen some oscillation but generally remained in a historically high range, roughly €75–€95 per tonne through 2023 and into 2024. According to EU regulator data, EUA prices averaged around €83 per ton in 2023. Interestingly, after the big run-up, prices eased in mid-2023 due to a combination of factors: weaker industrial output in Europe, falling natural gas prices, continued growth in renewable electricity (cutting power sector emissions), and an increase in supply from the extra auctions under the REPowerEU program. Volatility remained relatively low during that period. By late 2024, the price again showed strength: for instance, the Dec-2025 futures rose to €76 in early January 2025 after a holiday rally, and at the time of writing (October 2025) EUAs trade around the high €70s per ton for front-year contracts. This is nearly an order of magnitude higher than the low prices common in the mid-2010s, illustrating how dramatically the market has tightened.
Future forecast
Europe’s carbon market stands at a turning point. The combination of weaker industrial activity and subdued energy demand has kept EUA prices volatile and range-bound through 2025. Yet beneath this near term softness lies a tightening structural foundation. The gradual removal of free allowances, the steeper annual emissions cap, and the upcoming full implementation of the Carbon Border Adjustment Mechanism will steadily reduce the supply of permits and expand demand from both domestic and imported industries.
Furthermore, energy prices and fuel switching dynamics as noted, has a strong correlation with natural gas prices in the short term. When gas is cheap, it displaces coal and reduces CO2, easing EUA demand.
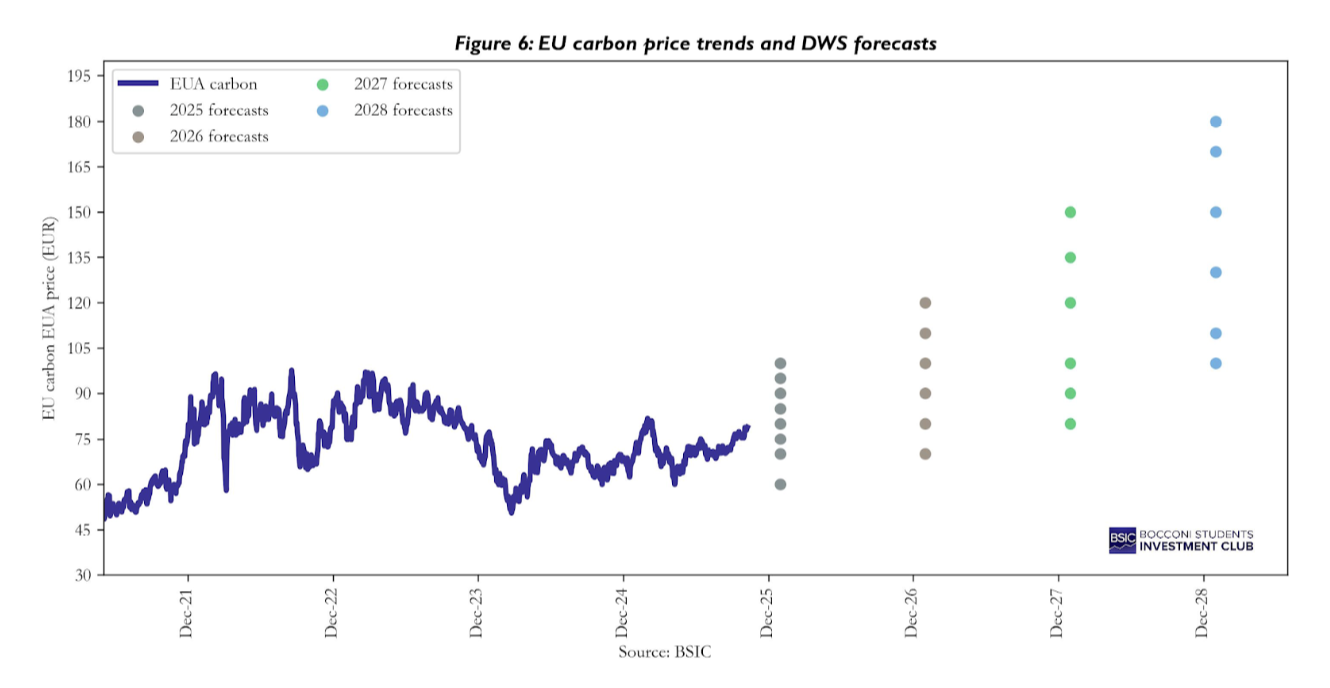
However, the futures curve for EUAs provides insight into expectations. As of 2025, the futures curve is in a slight contango, reflecting carrying costs and perhaps anticipated tightening. Five-year forward EUA prices are notably higher than current, in 2023, 5-year forwards were around €105, implying that by the late 2020s the market expects significantly higher prices. Professional forecasts align with this: for example, Bloomberg New Energy Finance projects the EUA price could reach €145 by 2030 and €175 by 2036 under its base case. Such expectations are driven by the knowledge that the cap will keep shrinking and no major alternative to decarbonization is available in Phase 4. If innovations like hydrogen scale up massively, they could dampen prices by reducing emissions, but those are likely post-2030 impacts. In the medium term, many analysts foresee a structural supply crunch around 2026-2030: once the REPowerEU program stops injecting extra allowances in 2026, and as the linear reduction bites, the net supply will drop sharply. Some market participants are already positioning for this by purchasing allowances now in anticipation of a steep rally in the later 2020s.
Considering the structural tightening underway in the EU carbon market, our long-term strategic view is to maintain a bullish bias toward EUA prices, recognizing that carbon scarcity will intensify as free allocations fade and compliance demand broadens. However, this view must remain sensitive to policy dynamics beyond 2030, when the EU’s decarbonization pathway becomes increasingly steep and politically complex. Achieving deep emissions cuts in the 2030s will require faster technological adoption and industrial transformation, areas where execution risk remains high. Consequently, the trade extends beyond the carbon market itself: it also supports selective long positions in companies positioned to benefit from the green transition, such as RWE, which is accelerating its shift toward renewable generation, and SSAB, a leader in low-emission steel technology. These firms are likely to gain from sustained policy incentives, higher carbon prices, and a market that rewards genuine progress in decarbonization while penalizing laggards.
Trade Idea:
We developed a strategy to test our main idea of correlation between:
- EU Carbon Futures (EUA) traded on ICE Endex
- Dutch TTF Natural-Gas Futures, the benchmark European gas contract
The purpose of this strategy is to examine the relative valuation dynamics between the European Union Allowance (EUA) carbon futures and the Dutch Title Transfer Facility (TTF) natural gas futures. Both instruments represent core components of the European energy complex. Natural gas serves as a key input to power generation and industrial production, while carbon allowances capture the cost of emissions associated with these activities. Because both are influenced by industrial activity, weather, and policy expectations, their price paths exhibit co-movement but not perfect correlation. This opens the possibility that short term deviations from their long run equilibrium may be mean reverting.
The central hypothesis is that the price spread between EUA and TTF futures oscillates around a stable relationship determined by fuel switching economics and emissions policy. By dynamically estimating this relationship and trading deviations from it, an investor can build a market-neutral position that captures relative mispricing while hedging broader energy market direction.
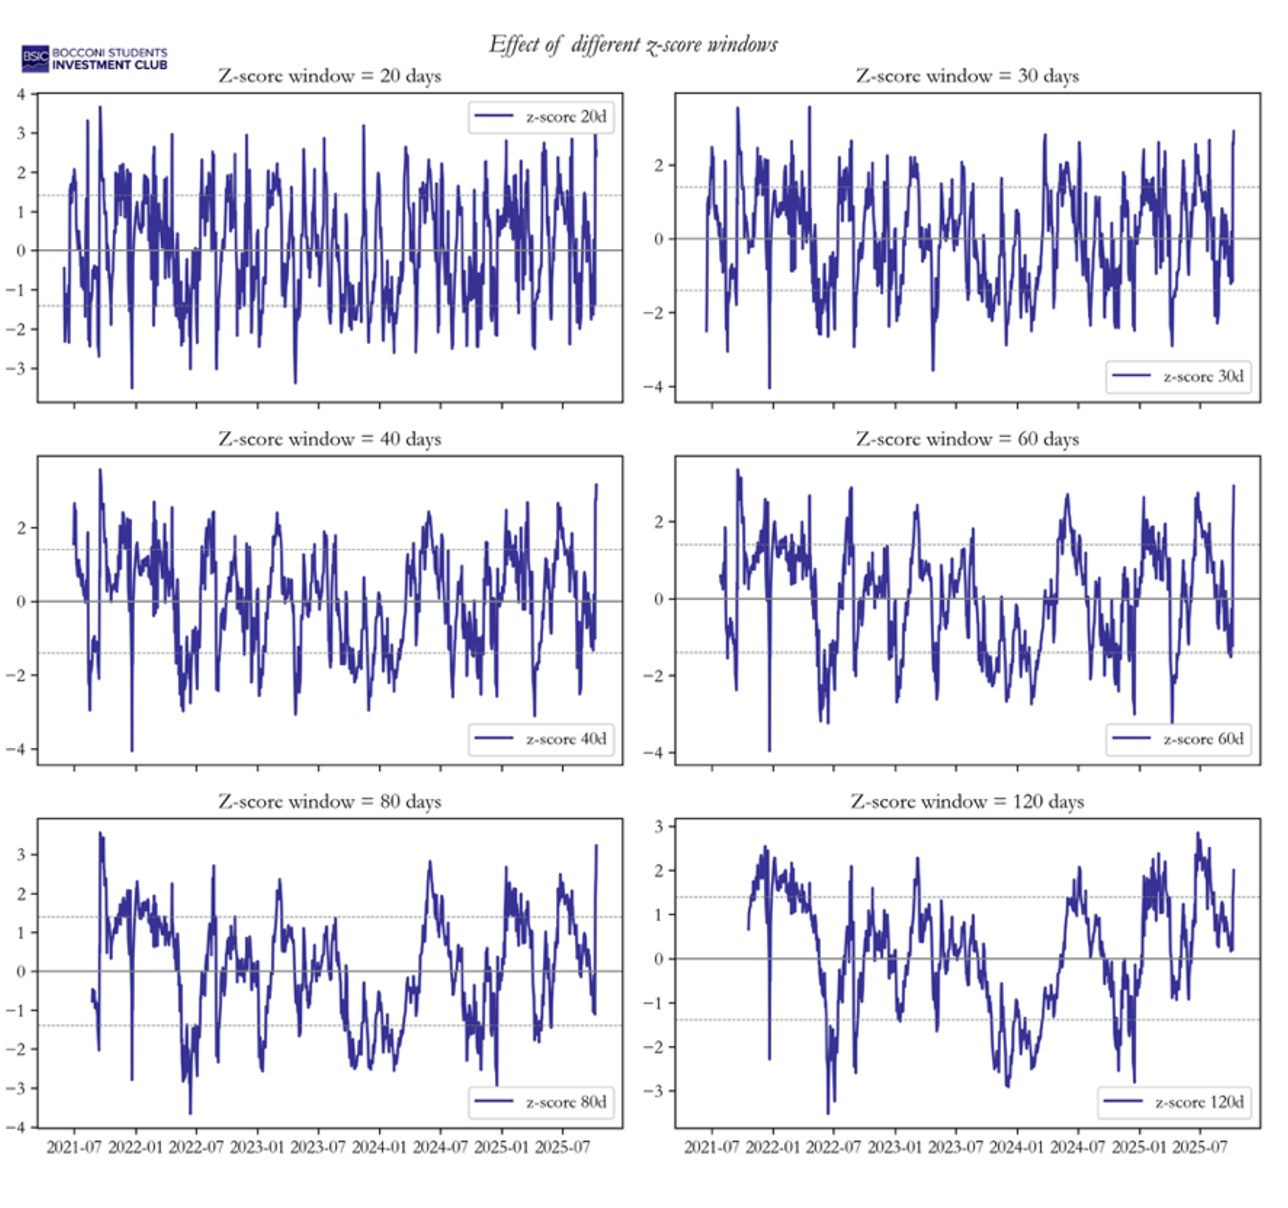
To neutralize common energy shocks, we estimate a rolling 20 day OLS beta of EUA on TTF using daily log returns:

A 20 day window is intentionally short: it allows the hedge to adapt to rapid regime shifts (storage headlines, policy auctions) at the cost of higher estimation noise. We lag the hedge by one day when constructing positions to avoid look-ahead. We define the hedge-adjusted price-level spread:

where P denotes the settlement level. Positive St indicates EUA is “rich” relative to TTF under the current hedge; negative St indicates “cheap.” We standardize the spread with a 20 day rolling mean and standard deviation:

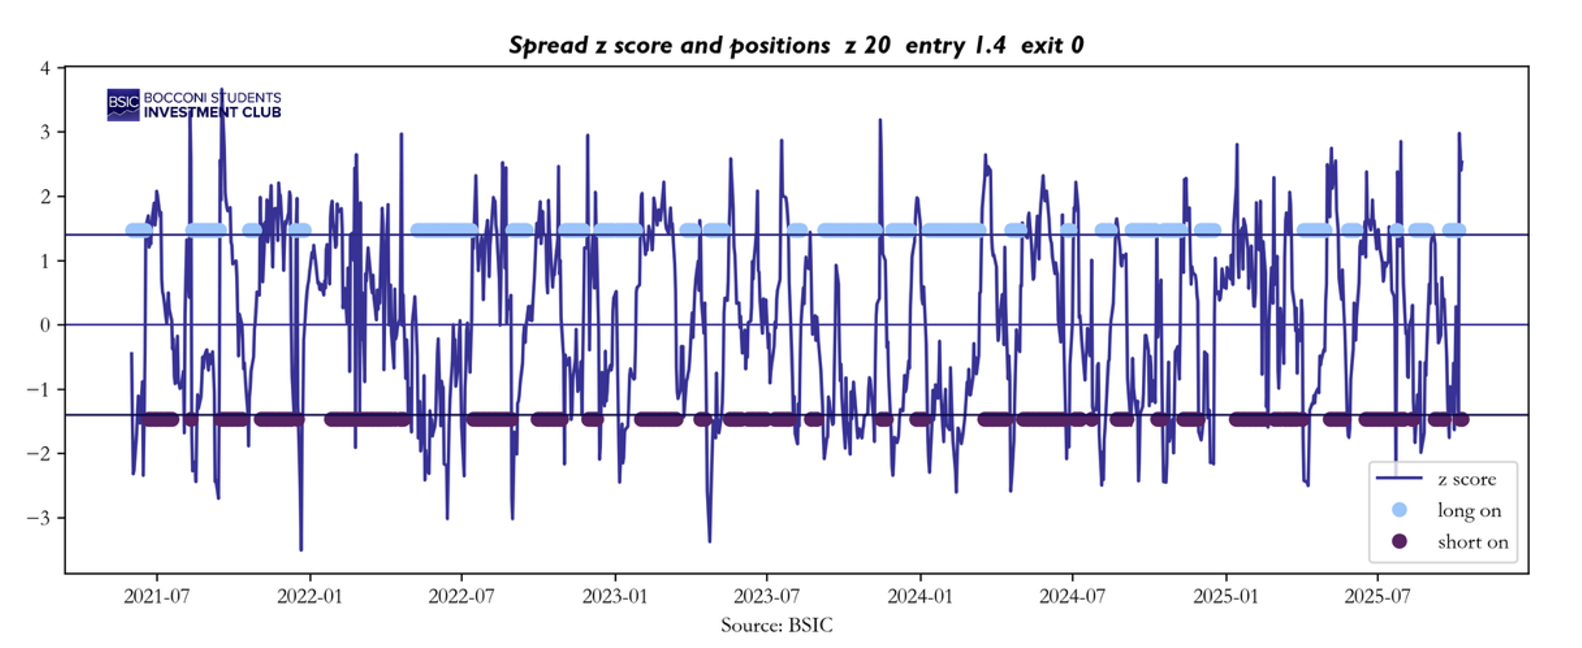
Our trading rule (symmetric mean reversion).
- Enter long spread (long EUA, short β x TTF when zt < -1.4.
- Enter short spread (short EUA, long β x TTF) when zt > +1.4.
- Exit to flat when the signal crosses 0 (i.e., mean reversion achieved)
This is a tight, short horizon specification with moderately selective entry, designed to exploit month to month micro dislocation.
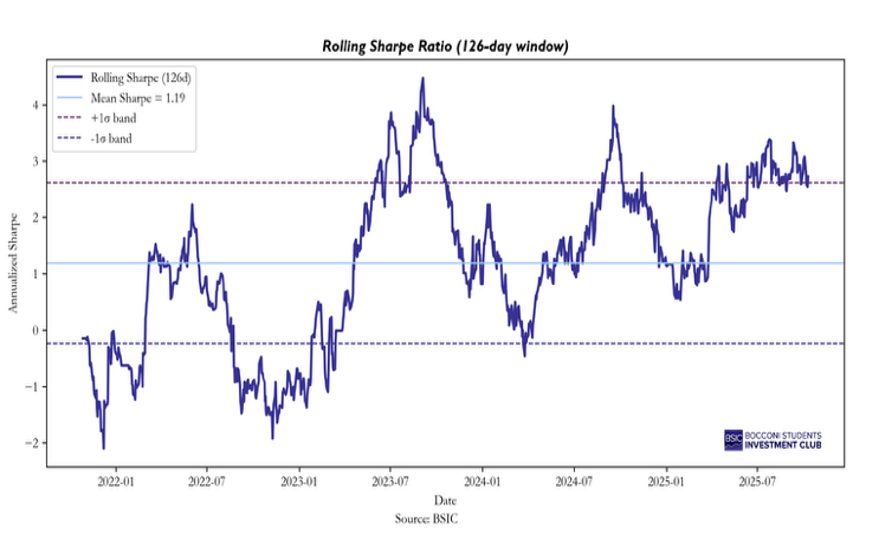
The back test of the EUA TTF mean reversion strategy with a twenty day estimation window for both the hedge ratio and the z-score, an entry threshold of ±1.4 standard deviations, and an exit at the mean (zero) yields an annualized compound growth rate of 25.8 percent with a volatility of 30.8 percent, corresponding to an annualized Sharpe ratio of approximately 0.9.
Over the sample of 1158 daily observations, roughly four and a half years of data, the strategy demonstrates moderate profitability for a market neutral relative value framework. Nevertheless, the maximum drawdown of 42 percent indicates that performance is vulnerable to structural breaks in the EUA TTF relationship, such as those driven by major policy revisions or energy supply shocks.
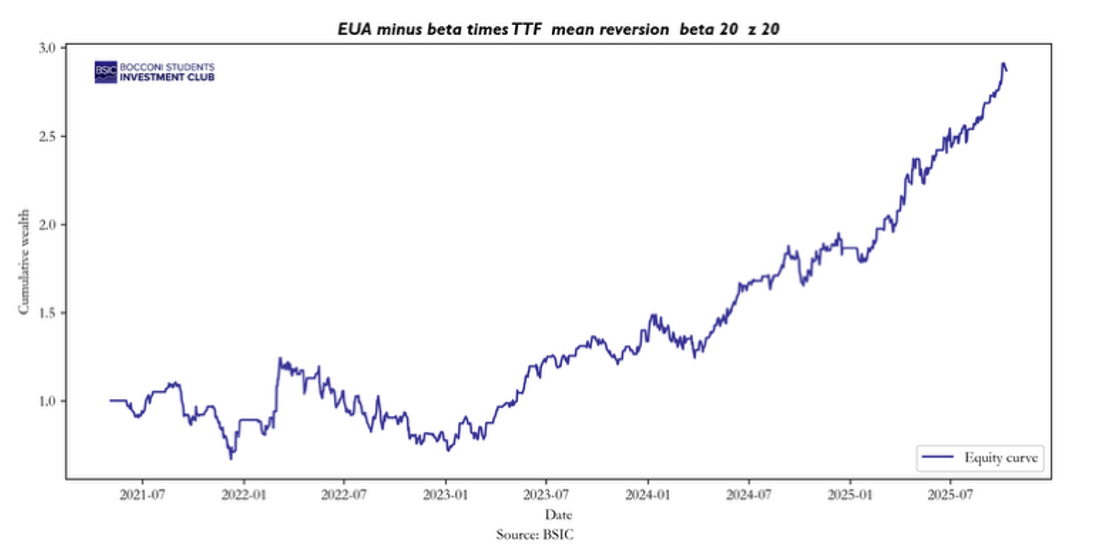
The relatively low win rate of 36 percent reflects the inherently contrarian nature of the rule: profits depend on a limited number of large mean reversion episodes rather than on frequent small gains. The average holding period of about four trading days and an annualized turnover of roughly forty signal a high frequency implementation that reacts quickly to deviations but also incurs substantial position turnover.
Taken together, these statistics depict a short horizon, high volatility strategy that performs well during periods of stable correlation between carbon and gas prices yet suffers during regime shifts. In academic terms, the results confirm that the spread between EUA and TTF exhibits temporary dislocations that can be exploited, although the associated risk of non stationarity remains significant and calls for additional robustness measures such as volatility scaling, longer estimation windows, or explicit regime filtering.
In conclusion, after transition years in 2024 and 2025, the EU ETS market is likely to tighten from 2026 onwards and make an increasingly meaningful impact on carbon emissions. The longer-term outlook for carbon prices under the EU ETS is therefore probably upwards and this could be an increasingly interesting asset class for investors. However, as history also suggests, short-term price volatility is possible due to the difficulties or matching supply and demand. However, as carbon prices are closely linked to multiple short- and long-term drivers. Much of the foundation for the current bullish trend in the EUA market stems from European environmental policy developments, which, as past experience has shown, are vulnerable to delays and unmet expectations. Unexpected policy reversals, whether within the EU or from external actors, could reshape the regulatory landscape. In addition, technological breakthroughs represent a structural risk to a long EUA position. Rapid progress in clean technologies such as large-scale hydrogen adoption or industrial electrification could accelerate emissions reductions faster than expected, easing compliance demand and putting downward pressure on carbon prices. The overall rationale for the EU carbon market will remain good, however, particularly with carbon abatement costs likely to remain high.
References
[1] ICAP, EU ETS factsheet and news
[2] Deutsche Bank CIO Report, March 2025, “EU carbon market: more to come”
[3] Homaio, Aug 2024, “How big is the EU ETS as a financial market?”
[4] Carbon Market Watch, July 2025, “CBAM must not be used to export pollution”


0 Comments