Introduction to the Yield Curve and its Evolution
15 August 1971, the day the Bretton Wood System was dissolved, will remain an important moment in economic history, representing a major shift in our international monetary system, a change in approach to perceived market risk and a departure from the gold standard. Floating exchange rates induced a paradigm shift in bond trading where rather than thinking of each maturity (5-year, 10-year, 30-year etc.) as a different marketplace, bond traders began drawing a curve through all their yields.
The yield curve is the term structure of interest rates and depicts the “time horizon of money”. Any point on the curve represents the rate premium that investor’s demand over that period of time to compensate them for the changes in interest rates over time. A normal yield curve has lower rates on the short end of the curve and higher rates on the long end of the curve for a debt instrument of the same credit quality.
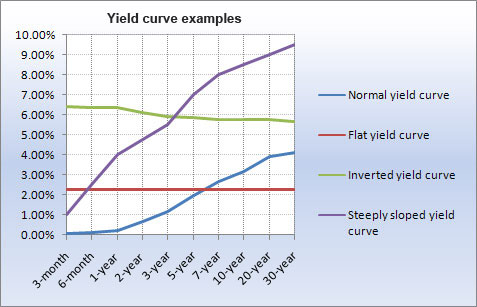
Chart 1: different shapes of the yield curve (Source: bankrate.com)
There are several factors that can influence the shape of the yield curve. It is important to remember that the interest rates of bonds are influenced by monetary policies and macroeconomic data but are ultimately market determined. Main drivers of the yield curve include:
• Growth: Forecasts of strong future economic growth, triggering higher future inflation and thus countered by higher interest rates, will suggest a steep positive yield curve. A sharply inverse curve suggests the opposite and a flat curve suggests investors are unsure about future economic growth and inflation;
• Inflation: Rising inflation induced by strong economic growth or increases in the money supply will typically be held in check by central banks via rate hikes. Rate reductions are an option that central banks will resort to during deflationary/recessionary times to stimulate economic growth and lower the cost of capital;
• Employment, Retail Sales, Housing Market: Strong employment, Retail Sales and Housing Market data may be an indicator of a robust economy and future economic growth, thus inducing inflation and countered by a central bank raising rates;
• Business and consumer confidence: Consensus belief about growth ramping up and the subsequent increase in investment to capitalize on said perceived growth is a self-fulfilling reflexive relationship, holding all else constant;
• Exchange rate: Anticipation of higher interest rates attracts foreign investment, increasing the demand for and value of a domestic currency. Inbound fund flows can affect economic growth and indirectly influence metrics that may lead to hawkish central bank action, and vice versa with outbound fund flows that may indirectly influence metrics leading to dovish central bank action.
The Yield Curve in Practice

Chart 2: US Yield Curve in Nov. 2017 and Nov. 2016 (Source: U.S. Department of the Treasury, treasury.gov)
As seen by the US Treasury Bond yield curve one week after the 2016 US Presidential Election, the narrative was that we would get a much steeper yield curve. The spread between 2 and 10 Year Treasury Bonds was 121 bps in mid-November 2016, compared to the 74 bps spread that it is today. This is indicative of a flattening yield curve.
The interpretation of shallower, flatter yield curve historically has been that there are real economic problems on the horizon in the near term. However, how the flattening yield curve narrative has been presented to investors is incredibly important. Fed Chair Yellen and the US Federal Reserve have been particularly keen on labelling their recent rate hike path as a counter to an economy successfully revived from post Global Financial Crisis quantitative easing efforts. This is a reminder that interest rates can rise for good and bad reasons.
Note that the yield will invert in times of recession such as during the Global Financial Crisis. Central banks will take action to lower rates on the short end, which is done with the intention of flattening the curve at first. Then raising rates again on the short end, in hopes of growth and inflation again acting on the long end of the curve – steepening it up. However, please be reminded that this is all in theory.
Returning to changes in US Treasury Bonds, had investors been able to forecast the flattening yield curve over the past year, what are ways they could have profited off such movements?
Ways to Trade the Yield Curve
It is important to understand that we are suggesting investment strategies that profit from correct speculation about the yield curve and do not spot any imperfections or possible arbitrage strategies in the market. Before entering any trading strategy, a trader needs to build their own forecast on the shape that the yield curve will take in the future. They must anticipate, right before a meeting of the Fed or the ECB or before the release of macroeconomic data, whether the curve will steepen or flatten after the announcement. In particular, whether the spread between longer term maturity bonds and shorter maturity ones will widen or shrink.
Based on this belief, by going long and short futures contracts on the interest rate yield with different maturities, it is then possible to build a successful trading strategy which is not affected by parallel shifts in the curve.
The trading strategy that we will describe is an intra curve trading strategy, meaning that it is based on the forecast of the yield curve of one specific country and it is built using only one currency.
As it was stated before, the first task in designing a yield curve trade is to decide how this will react to future interest rate developments during the trading time window. Generally, if you expect yields to fall, the yield curve will steepen and the opposite is true when yields are rising. This typically happens because shorter term yields respond quicker to interest rates announcements than longer term ones, which are generally less impacted and have a much slower reaction. Of course, this is a simplistic view because, if there is a really high expected inflation, the yield curve could steepen rather than flatten even if the Fed is implementing a tightening policy (rate hikes). Regardless, in this paper we will take the yield curve predictions as given and we will just speculate on how to profit in the best possible way from these.
Indeed, a trader should design their strategy so that, if the future yield curve realizes to be as predicted, they will profit by exploiting the properties of the bond prices in relation to the yield. Indeed, their trading strategy should involve long and short positions in interest rate futures contracts with different maturities.
The 3-month interest rate future is a contract which is typically settled against a benchmark rate (as the LIBOR or EURIBOR). In particular, a long investor wants the rates to fall so that the price of the bond and thus the value of its future contract, increases. For example, let’s say that in the market the interest rate futures trade at 98.5. Then it means that the anticipated 3 months LIBOR interest rate in that period is expected to be 1.5% (the price is conventionally quoted as 100 minus the interest rate). If you think that the rates will be lower in the future you should buy the interest rate future, so that the price will be higher than 98.5 and you will make a profit equal to St-98.5$.
The choice of using a long-short strategy using futures rather than bonds gives multiple benefits. First you will not deploy any cash today when using futures rather than bonds (keep in mind that the price of any future at time 0 is zero). Second, it allows one to construct an investment strategy which yields no gain or loss in case the curve shifts in a parallel way up or down and it profits only if the expected steepening or flattening is realized.
At this point, in order to profit from their view, a hypothetical trader has two main trading strategies that are exactly specular and entail really low transaction costs, since the interest rate futures market is very liquid.
1. Bet on the flattening: you “sell the spread” meaning that you go short the 5-Year Treasury note futures and long the 10-Year Treasury note futures.
2. Bet on the steepening: you “buy the spread” meaning that you go long the 5-Year Treasury note futures and short the 10-Year Treasury note futures.
Suppose that the contracts are priced at 98.7 and 98 for the 5-Year and 10–Year Treasury rates futures respectively. As a consequence, these two contracts imply a positive spread of 70 bps. Now consider that, based on their expectations, the trader believes that there will not be further rate cuts but sees cash lower, while it expects for the future a more aggressive rate rising cycle than what the market believes. Then they see the future contract for the 5-Year Treasury at 99.1 and the one of the 10-Year Treasury at 97.6 for example, implying a future expected spread of 150bps (rather than the current 70bps). Then they should buy the 5-Year treasury contract and sell the 10-year one.
The question now is, how to design the strategy in such a way that they are hedged against any parallel shift, either up or down, of the yield curve?
The best way to create this trade is to match the dollar value of a 1-bp change (DV01) in the yield of the shorter-term maturity futures position and that of the longer-term maturity futures position. This can be calculated by multiplying the modified duration of the bond on which the contract is written times its price and then divide it by 100 (100bps=1%).
In the simplistic example that you are selling the spread and that the DV01 of the 5-Year Treasury contract is 40$ and the DV01 of the 10-Year Treasury contract is 80$, then you should sell (80$/40$) 2 short maturity contracts for each long maturity one that you buy.
In this way, it is possible to verify that the P&L of the trade is almost zero (almost due to the linear approximation defect of the modified duration) in case of a parallel shift and strictly positive in case of a yield curve flattening. Ultimately, if the long maturity interest rates rise less than the short ones, then the gains from the short position in the 5-Year Treasury futures contract are much greater than the losses incurred from the long position in the 10-Year Treasury futures contract.
To conclude, yield curve trading may result extremely profitable if the forecast behind the strategy happens to be true but at the same time it is risky if the curve moves against expectations. Regardless it is quite simple to implement and it has really low transaction costs due to the high liquidity of the interest rate futures market.


0 Comments