Introduction
In our previous exploration of sports betting, we examined basic market efficiency and evaluated whether straightforward strategies could uncover statistical arbitrage opportunities. Our findings showed that, while betting markets may appear exploitable at first glance, they remain highly efficient, leaving little room for profit under simplistic approaches.
However, we believe there is merit in diving into further models to better understand market behavior and rigorously prove that sports betting, from a mathematical perspective, is futile. In this article, we extend our analysis by applying the Kelly Criterion, a popular method for optimizing bet sizes, to historical betting odds from multiple bookmakers. We simulate betting strategies based on real-world data, placing bets on maximum available odds while calculating implied probabilities from mean odds. Our analysis uses real-world betting data from football matches, and we assess the performance of three strategies:
- Equal Betting Strategy – Placing equal-sized bets based on maximum available odds.
- Kelly Criterion Strategy – Dynamically sizing bets based on the Kelly Criterion using implied probabilities.
- Adjusted Probability Strategy – Introducing margin adjustments to better account for bookmakers’ true pricing, seeking out potential value opportunities.
Ultimately, we aim to assess whether these more sophisticated models can overcome bookmakers’ pricing strategies. However, as we will see, even when analyzing games with intrinsic arbitrage opportunities in the mean bookmaker pricing, the Kelly Criterion and margin adjustments, returns tend to converge towards zero, raising further questions about the efficiency of betting markets.
Data Collection
Similar to the first part of this analysis, we sourced data from Football-Data (www.football-data.co.uk), focusing on football matches from Serie A and the Bundesliga spanning the 2003/04 to 2023/24 seasons. This dataset includes final match results and the odds provided by 5–8 bookmakers for each outcome (home win, draw, away win).
For all three strategies, we used these datasets to calculate implied probabilities and identify potential betting opportunities. The calculations involved using both maximum available odds (to optimize returns) and mean odds (to calculate implied probabilities).
Strategy 1: Equal Betting Strategy
In this strategy, we placed equal-sized bets on each possible outcome (home win, draw, or away win) using the maximum odds available across bookmakers. The idea was to place bets where the total implied probability derived from these maximum odds approached or fell below 1, thereby indicating a potentially profitable opportunity.
Implied Probability and Total Implied Probability
For each outcome (home win, draw, away win), the implied probability was calculated as:

Where:
 is the implied probability of an outcome.
 represents the decimal odds provided by the bookmaker.
The total implied probability for a game (across all outcomes) was the sum of the implied probabilities:

Arbitrage Opportunities
In theory, if  , it would suggest an arbitrage opportunity where bets on all outcomes could guarantee a profit. However, bookmakers typically build in margins that inflate the implied probabilities, making
  , which means no risk-free arbitrage exists.
Over the course of 6,078 Serie A games and 6,314 Bundesliga games, only 1,029 games (469 in Serie A and 560 in the Bundesliga) had total probabilities below 1, confirming that true arbitrage opportunities are rare.
Results of the Equal Betting Strategy
Tracking capital changes over time for each strategy (home win, draw, away win), we observed the following results for Bundesliga using the Equal Betting Strategy:
- Home Win Strategy: +69.84
- Draw Strategy: -42.82
- Away Win Strategy: -55.25
And for Serie A:
- Home Win Strategy: 3.53
- Draw Strategy: -13.03
- Away Win Strategy: -68.59
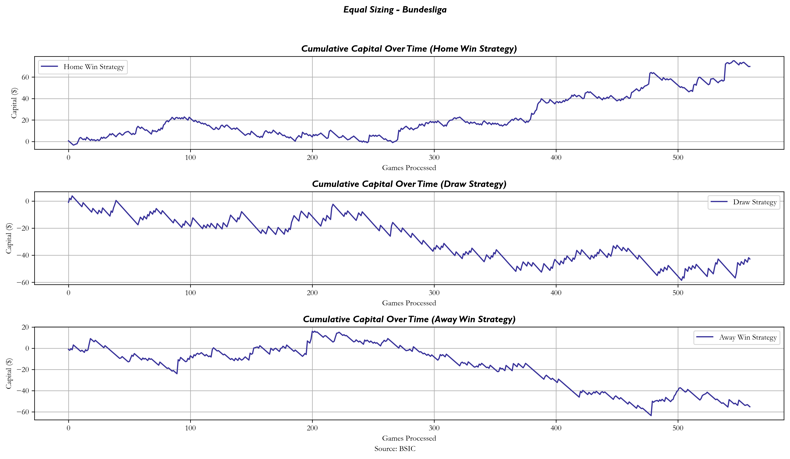
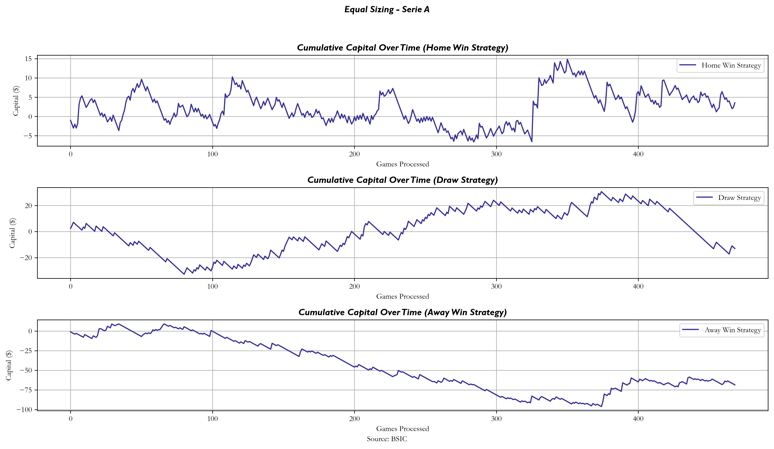
The variability in the results highlights the challenge of achieving long-term profitability using this method. While some strategies (like Bundesliga Home Wins) performed better, overall market efficiency and the margins imposed by bookmakers significantly reduce the opportunities for consistent gains.
Strategy 2: Kelly Criterion Sizing
In contrast to the equal betting strategy, the Kelly Criterion dynamically adjusts bet sizes based on the perceived edge derived from the relationship between the implied probability and the odds offered. In order to have a portfolio worth sizing, we start with 1000 units of initial portfolio capital.
The Kelly Criterion calculates the optimal fraction of capital to wager,  , as follows:

Where:
 represents the net odds (odds minus the original stake).
 is the implied probability based on the mean odds.
 is the probability of losing.
Assumptions and Insights
One key assumption made in this model is that mean odds represent a fair implied probability, and that by betting using maximum odds, there is a consistent edge. This implies a positive expected value (EV) whenever the odds and implied probabilities diverge. However, the assumption that this edge is exploitable is often mitigated by the efficiency of bookmakers’ pricing strategies.
Results of Kelly Criterion Strategy
Tracking capital changes using the Kelly Criterion Strategy for both Bundesliga and Serie A, we observed the following results:
- Bundesliga Results:
- Home Win Strategy: 9014.66
- Draw Strategy: 258.88
- Away Win Strategy: 398.55
- Serie A Results:
- Home Win Strategy: 1716.73
- Draw Strategy: 1050.67
- Away Win Strategy: 293.11
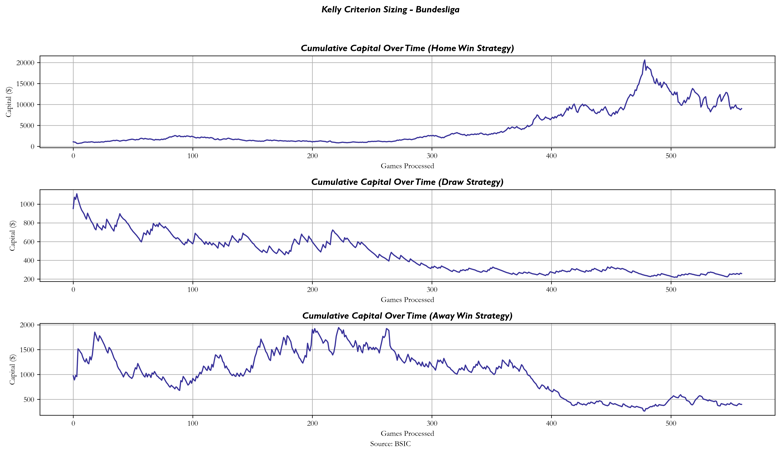
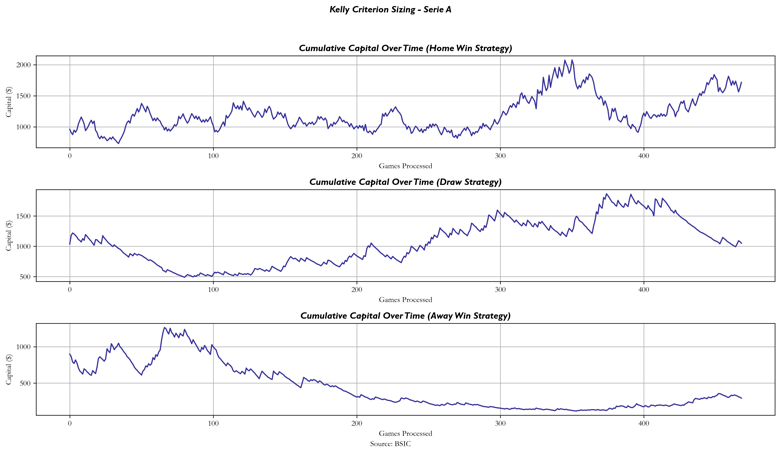
The Bundesliga Home Win Strategy resulted in a significant positive return, while the draw and away win strategies saw more moderate gains. In Serie A, the Kelly approach similarly showed profitability, though the results still exhibited variability depending on the outcome type.
Strategy 3: Adjusted Probability Strategy
One of the primary challenges in sports betting arbitrage is the high margins imposed by bookmakers, which can erode potential gains. When we adjust the bookmakers’ implied probabilities by their respective margins, we often find that even the best odds available imply a probability higher than any theoretical value the bookmakers assign to each possible outcome. In simpler terms, the distribution of bookmakers’ implied odds for a specific game tends to shift entirely to the right of the adjusted probability distribution. This shift means that any bets placed under these conditions would result in a negative expected value (EV).
To tackle this issue, we developed a strategy that takes these margins into account. Our approach involves adjusting the implied probabilities by the margins to derive what each bookmaker theoretically believes to be the actual probability of an outcome. We then examine whether any of these adjusted probabilities exceed the implied probabilities derived from the odds offered by other bookmakers. If we find such a discrepancy, it suggests that, according to one bookmaker’s estimates, there is an opportunity to profit by placing a bet with another bookmaker offering more favorable odds. Essentially, if the bookmaker’s adjusted probability is higher than the implied probability from the odds, betting on that outcome could be advantageous.
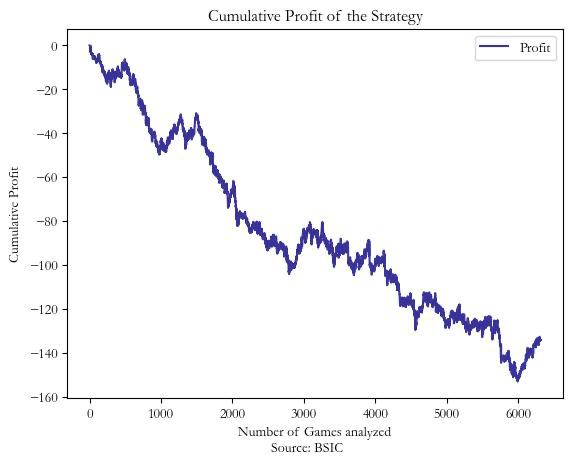
Unfortunately, when we put this strategy into practice, the results were underwhelming. We standardized our bets so that our potential winnings would always be $1 whenever we decided to place a wager. After applying this method to a dataset of 6,000 games, we found ourselves down by approximately $130. This outcome implies that, rather than uncovering situations where a bookmaker’s implied odds are too low, the strategy tends to identify cases where a bookmaker’s theoretical value is inaccurately high. In other words, the bookmaker might be overestimating the likelihood of certain outcomes, leading us to place bets with a negative EV.
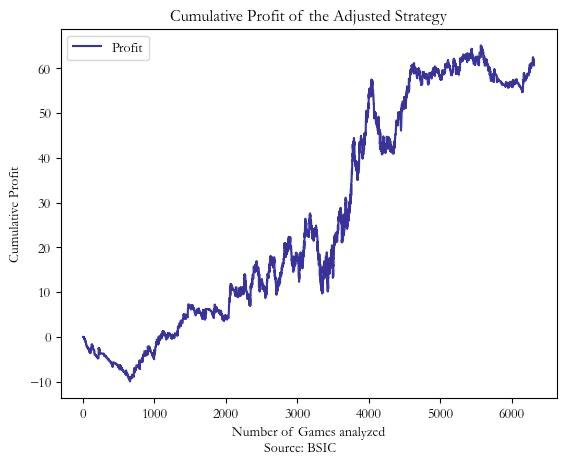
To refine our approach, we introduced a new condition: we focused on scenarios where at least 20–50% of the theoretical probabilities are higher than the implied probabilities offered by some bookmakers. This adjustment aims to ensure that we are only considering situations where there is a significant consensus among bookmakers that an outcome is more likely than what the odds suggest. By doing so, we increase the likelihood that at least one bookmaker is underestimating the probability, creating a potential opportunity for profit.
Implementing this adjusted strategy yielded more promising results. The strategy began to generate profits, indicating that the revised conditions might be effective in identifying genuine discrepancies between bookmakers’ estimations and the odds offered. However, upon decomposing the profits by outcome type—home wins, draws, and away wins—we observed that the majority of gains came from bets on home wins. This pattern suggests a possible anomaly in the dataset, perhaps due to an unusual number of home wins during the period analyzed or a systemic bias in favor of home teams.
While this limitation highlights the need for caution, it also opens the door to further exploration. One potential avenue is to develop a predictive model that can better identify when probability mismatches present profitable opportunities. Such a model could use machine learning techniques to assess the confidence levels of these mismatches and adjust bet sizes accordingly—a concept known as soft classification. By tailoring bet sizes based on the model’s confidence, we could optimize returns and mitigate risks associated with overestimating the profitability of certain bets.
Decomposition of Results by Outcome
The adjusted probability strategy was designed to incorporate bookmakers’ margins and identify discrepancies in implied probabilities that could indicate value bets. As mentioned earlier, we saw positive returns after adjusting our strategy, but these were disproportionately concentrated in home win bets. To better understand this, we decomposed the results by outcome type:
- Home wins: 2,861
- Away wins: 1,886
- Draws: 1,567
While home wins are generally more common due to the well-documented phenomenon of home advantage in football, what is particularly noteworthy in our analysis is that the distribution of bookmakers’ odds consistently underestimated the probability of the home team winning during the time period studied. This underestimation provided the edge that led to significant returns on home win bets.
This is not an anomaly in terms of the frequency of home wins themselves; rather, it reflects that bookmakers consistently offered more favorable odds for home wins than the true probabilities implied by the outcomes, as mentioned in the first part of the article. As a result, bettors who followed the Kelly Criterion and bet on home wins during this period benefited from these odds discrepancies. Again, as mentioned in the first article, when a different dataset is used and the time period used is long enough, the bias has no effect on the total outcome. In reality, home teams naturally win less than 50%.
Conclusion
Through this analysis, we explored three distinct strategies: equal betting, Kelly sizing, and an adjusted probability model that incorporates bookmakers’ margins. While each strategy offers unique insights into the challenges of sports betting, none provide consistent long-term profitability due to the efficiency of the betting markets.
The Kelly Criterion optimizes bet sizing, but even with this advanced approach, returns tend to converge towards zero. Similarly, while the adjusted probability strategy showed some potential, the results highlight how bookmakers’ margins continue to neutralize perceived opportunities for arbitrage.
However, one interesting anomaly arose in the data: the massive return for the Bundesliga Home Win Strategy when using the Kelly Criterion. With a final capital of $9015, this result appears disproportionately positive compared to the other strategies. Upon deeper investigation, this large return seems to be driven by a bias in the Bundesliga data that skews heavily toward home wins during the period analyzed.
References
- Winkelmann D., Ötting M. and Deutscher C., “Betting Market Inefficiencies in European Football – Bookmakers’ Mispricing or Pure Chance?”, 2020


0 Comments