Investors tend to overgeneralize about bear markets and speak of them as if they were a homogenous group in which experiences have been largely similar. The triggers, timing and profile of recovery vary significantly, and bear markets come in many shapes and sizes. That said, despite the differences over time, there are some recurring characteristics, as with cycles in general. Although avoiding bear markets is an understandable goal, timing is crucial. Selling equities too early in anticipation of a bear market can be as costly as staying fully invested and waiting for one to start. For example, equity investors have, on average, lost about the same amount in the first three months of a bear market as they would have earned in the final months of a bull market. In other words, selling equities too early can place you in the same position as selling after the start of a bear market. Another challenge when it comes to defining bear markets is that it can be quite difficult, in real time, to assess when a bear market has ended; not all bear markets end in a decisive way with a strong and sustained rebound in prices. It is not uncommon for market volatility to rise towards the end of a bear market and for a sharp recovery to revert shortly afterwards. Japan’s bear market of the 1990s is another example of one that continued to be volatile even after the final low in July 1992. Initially, the Nikkei stock index enjoyed a sharp rebound of close to 40% as evidence of an economic recovery finally emerged, but this did not mark the start of a smooth and steady recovery, since then, there have been five sharp rallies of 40% or more, but the market continues to languish at roughly half the level of its 1989 high, so even in this case one could argue that the bear market that started in 1989 is ongoing.
There have been 27 bear market in the S&P500 since 1835 and 10 in the post-war period. There have been significantly more corrections and drawdowns over this period, but these can be ignored either because they resulted in falls below 20% or they were very short-lived. Although the classification of each event here is somewhat subjective, it nonetheless attempts to group bear markets into different categories based on similar characteristics over the time series history.
• Cyclical bear. Typically, a function of rising interest rates, impending recessions and expected falls in profits. These markets are a function of a typical economic cycle and are the most common type of bear market.
• Event-driven bear. Triggered by a one-off shock that does not necessarily lead to a domestic recession (such as a war, oil price shock, EM crisis or technical market dislocation), but which leads to a short-lived rise in uncertainty and pushes up the equity risk premium (the required rate of return).
• Structural bear. Usually triggered by the unwinding of structural imbalances and financial bubbles. Often a price shock, such as deflation, follows. This tends to be the deepest and longest type of bear market.
Figure 1 US Bear Markets & Recoveries since 1800s
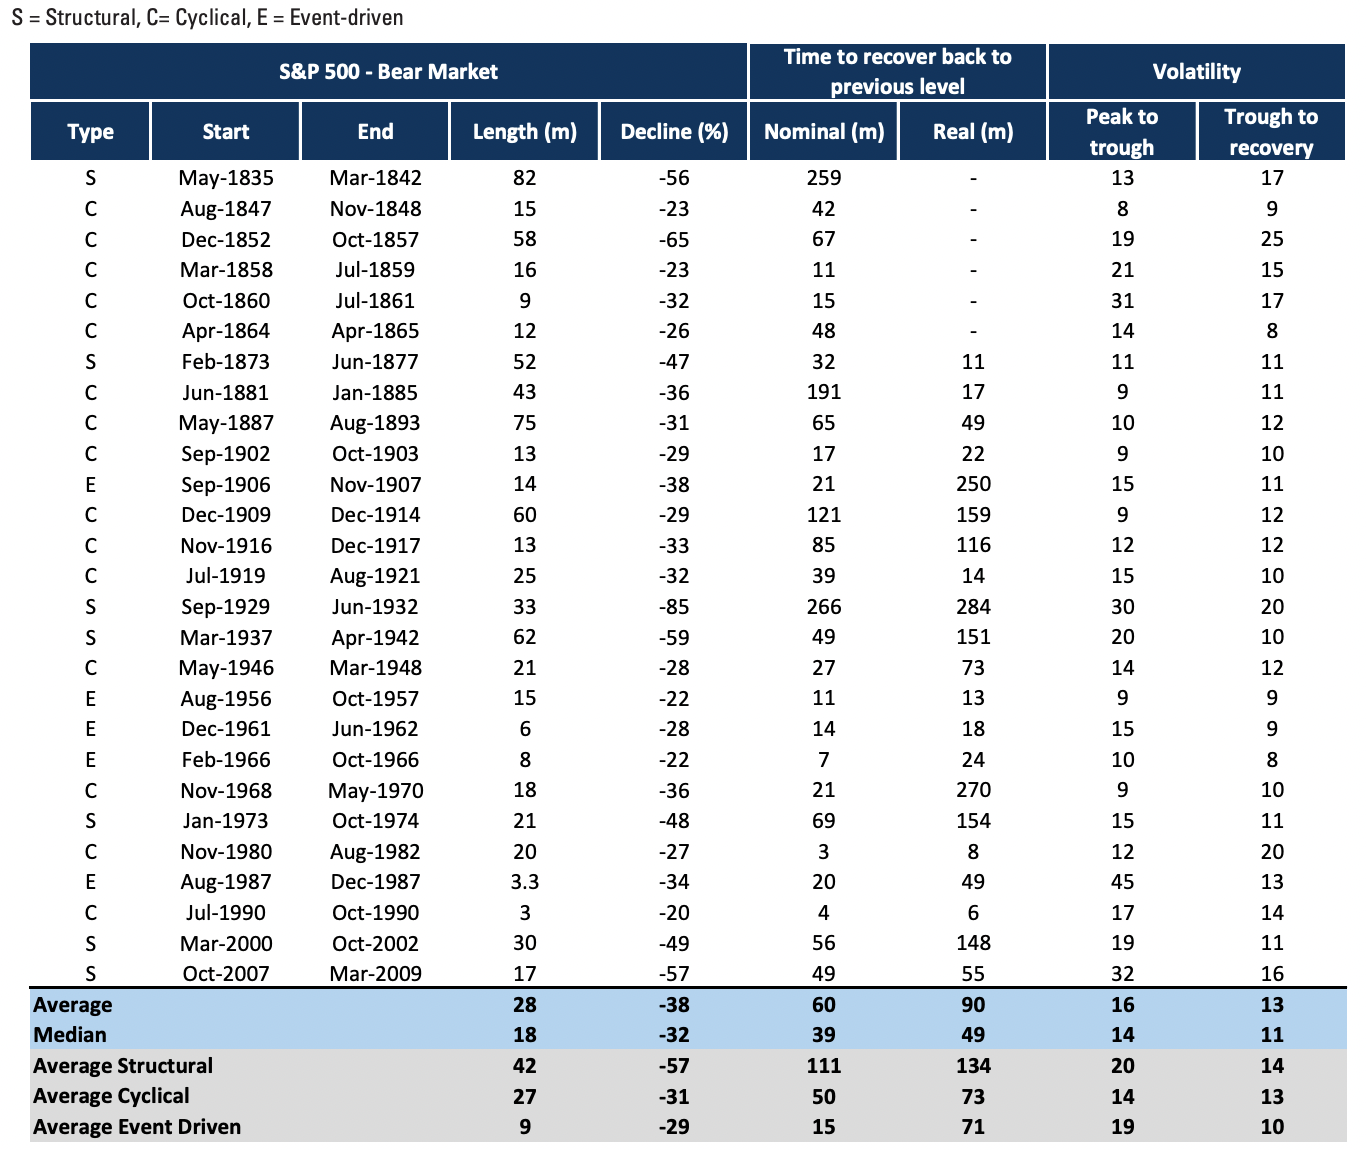
Source: Goldman Sachs Investment Research
Cyclical Bear Markets
Bear markets that have been described as cyclical are those that relate to a standard economic downturn triggered by a period of tighter monetary policy. They are also bear markets that have ended, at least in part, as a result of falling interest rates. Defining past bear markets as cyclical is easier than defining them as such at the time. Given that many structural bear markets are also associated with rising interest rates and economic slowdowns, one might assume that there is a risk of a structural factor operating during any bear market. However, one of the key distinctions here is that equity (and bond) prices tend to respond to falling interest rates and leading indicators during a normal cyclical bear market. Although falling interest rates may eventually contribute to a recovery from a structural bear market, the shifts in policy typically need to be more aggressive and take a much longer period.
Various factors are common to cyclical bear markets. Taking the history of these types of bear markets together shows us that the average cyclical bear market experiences a fall of about 30% and lasts for about 27 months. The level of the market has, on average, not recovered to its previous level until just over 4 years after the decline in nominal terms, and 6 years in real terms (although the averages in real terms are highly variable). Volatility during the bear market is relatively low (see exhibit 6.2). The average volatility of monthly returns from peak to trough has been 14% for cyclical bear markets. For structural bear markets, the figure is significant higher, at 20%. In terms of profitability, history suggests that most cyclical bear markets are associated with relatively short-lived declines in profitability. On average, profits start to recover about 10 months after the end of the bear market.
Event-driven Bear Markets
There are several examples of bear markets that can be described as broadly event driven. Unlike the more usual cyclical bear markets, these are not triggered by the evolution of the economic cycle, rising interest rates and concerns over future growth. They are, instead, generally the result of an unexpected exogenous event, such as political issue or an unexpected shock (a sharp rise in oil prices, for example), an event that itself raises the required risk premium sufficiently to require a downward adjustment in prices, even if equity prices were not generally regarded as expensive to begin with. Often, such event-driven declines in the market are short-lived and are not associated with a fundamental shift in economic or corporate conditions. This is not an ideal definition because, on occasion, what starts out as an unexpected event (a political shock, for example) could have been at least partly responsible for triggering a bear market that turns out to be something more sinister. The oil crisis of 1973 can be viewed as such a case. Although not entirely the result of the oil crisis itself, the sharp rise in inflation and interest rates that followed contributed, in no small part, to the collapse in real returns in equity markets over subsequent years. Because these events in many cases did not result in a shift in the economic cycle or the underlying trend of economic and profits growth, they were generally relatively short-lived. Looking at past examples, there have been some key differences relative to cyclical bear markets. The average decline in event-driven bear markets of 29% is similar to the average decline of 31% for cyclical bear markets. However, although the cyclical bears lasted an average of 2 years and took 4 years to recover, the event-driven bears lasted an average of just 9 months and had recovered to previous peaks after just over 1 year. The 2020 stock market crash caused by the instability due to the COVID-19 pandemic, started on 20th February 2020 and ended on 7th April 2020. In April 2020 global stock markets re-entered a bull market and returned to January 2020 levels in November 2020.
Structural Bear Markets
Most structural bear markets are preceded by financial bubbles (which had burst, perhaps as a consequence of rising interest rates or tightening credit conditions) and acute overvaluation, and they are often accompanied by major imbalances in the economy, such as a significant increase in private sector debt, which leaves households and corporates vulnerable to any shock. Recovery is dictated by the unwinding of imbalances rather than simply by monetary easing. Structural bears are much deeper and sharper than cyclical bears, and recovery typically takes about a decade. High volatility is a prominent feature during the recovery period. Structural bear markets tend to be much more severe than cyclical or event-driven bear markets. On average, they have been associated with falls of over 50% and have lasted for 4 years. Most worryingly, the structural bears have taken about 8 to 10 years to recoup losses in nominal and real terms. Structural bear markets are usually the result of misallocation of resources. The roots of this are often found in a combination of a new technology cycle and falls in the cost of capital. These are generally also accompanied by a savings and investment imbalance that results in a rising predisposition to economic shocks. For example, structural bear markets often coexist with large current account or budget deficits, coupled with high levels of corporate and/or consumer debt. This was, for example, the case before the financial crisis of 2008.
Economic imbalances usually take a long time to unwind. Very often the only way the process is speeded up is via sharp economic adjustment that reverses the imbalances faster than would otherwise be the case. For example, the UK had many of the ingredients of a structural bear market in the early 1990s, when the economy had serious imbalances, a deep recession, and there had been a sharp fall in property prices and equities. In this case, the process was speeded up via a collapse in the exchange rate when sterling crashed out of the ERM. This is a more likely option in a relatively small open economy such as the UK (or Sweden, which had a similar experience at the time), but it is harder for a large and relatively closed economy such as the US, where the benefits of devaluation are less clear. Taken together, then, structural bear markets show the following characteristics:
• They are more savage in terms of magnitude and duration.
• Recovery takes much longer.
• They are associated with ongoing structural economic problems rather than cyclical ones.
Given the severity of these bear markets, it is useful to be aware of any of the common characteristics that occur before they start. Unlike the examples of cyclical bear markets, rising interest rates are not usually the trigger for price declines in structural bear markets. Many of the structural bear markets in the past have been preceded by very low interest rates and inflation: a factor that helped the boom in investment and strength in equity prices in the first place. This was true both in the run-up to the 2000 stock market peak and in the pre-2008 period. Because rising interest rates are not usually the cause of the structural bear, falling interest rates are not usually the cure. Given that the price of money tends to be low when structural bear markets develop, the recovery owes more to the availability and demand for money than the price, although typically interest rates do fall to low levels.
Another key factor that seems to be common during structural bear markets is a price shock, either inflationary or deflationary. Often, it is deflation. The deflationary forces, particularly in the corporate sector, are usually a by-product of falls in the cost of capital and overinvestment. Once again, the susceptibility to price shocks is an additional factor that slows the recovery process and lengthens the time it takes for the prospective return on capital to rise sufficiently to generate a recovery.
In conclusion, many of the great structural bears were preceded by financial bubbles and a belief in a ‘new era’ and equity market leadership becoming narrow. Not only does the bubble period and subsequent collapse tend to centre on a narrow number of stocks, but also markets overall tend to be highly volatile. One of the key features of structural bear markets is high volatility during the period of price declines and during the recovery. The actual annualised rate of increase in stock prices is not significantly different from cyclical bear market recoveries, but there tend to be a greater number of rallies and false starts.
Table 1 Characteristics of a bear market
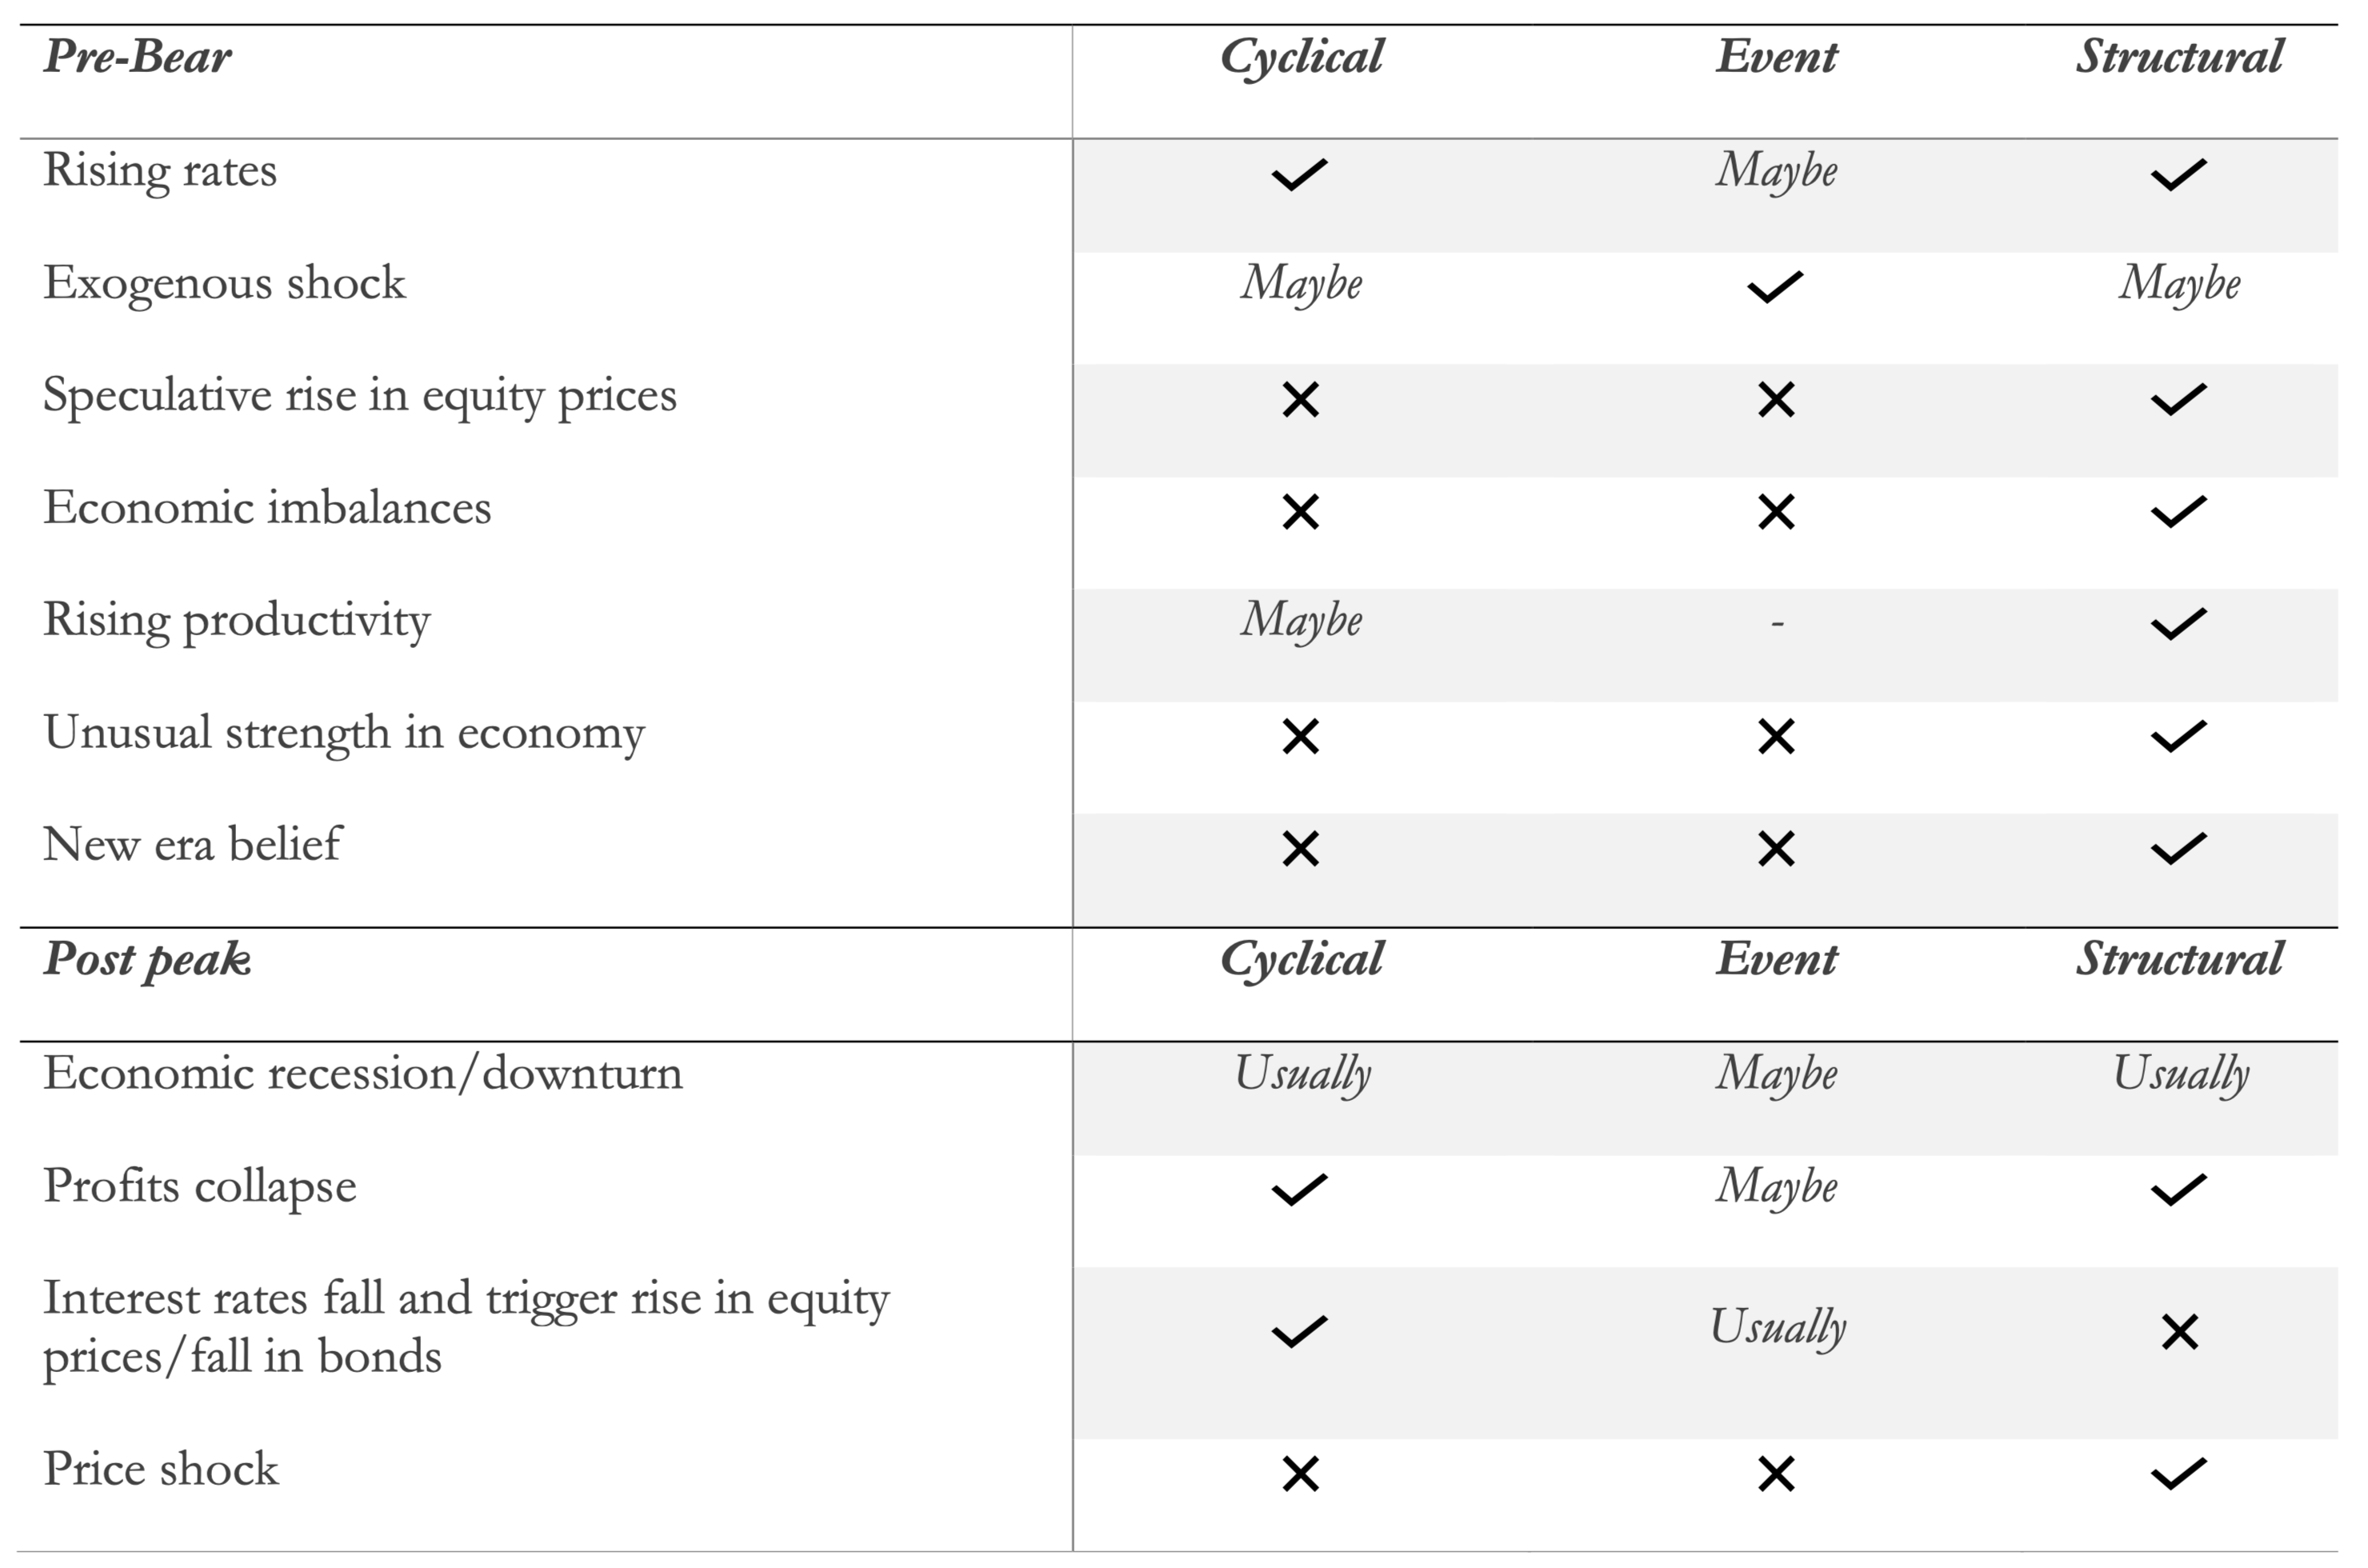 SOURCE: Goldman Sachs Global Investment Research


0 Comments