Introduction
From the challenge of sustainably transitioning to renewable energy sources to having to step up production to provide energy security in a time of crisis, the Oil and Gas industry has constantly found itself in the spotlight in recent years. The importance of this industry stems from the crucial role of the underlying resources that it deals with – crude oil and natural gas. The former is refined into gasoline, diesel, jet fuel, heating oil, propane, petrochemicals, and other essential products. Natural gas is used for power generation, heating and cooling, cooking, transportation, and industrial processes. Lastly, electricity, a secondary energy source, is still produced mostly from fossil fuels, the main ones being oil and natural gas, along with coal; 61% of total electricity generation in the US in 2021 was from fossil fuels, underscoring the essential role oil and gas have on electricity production.
European energy crisis – winners and losers
It is precisely the massive importance of oil and gas in economic activity that caused the energy crisis after Russia’s invasion of Ukraine in early 2022. Europe was hit by record gas prices in 2022, peaking in August, at an eye-soaring $8.80/MMBtu (million British thermal units), but has since partially recovered through EU policies such as retail price caps for electricity, regulated tariffs, support programs, energy saving policies and liquidity backing for energy providers. Part of the recovery was also due to an increase in LNG (liquified natural gas) imports, offsetting some of the dependence on Russian natural gas.
There were not only losers in this crisis, as oil “supermajors” emerged strongly from an otherwise turbulent 2022 with record profits, as 6 of the largest western players (BP, Chevron, Shell, Total, ExxonMobil and Equinor) made over $200bn in profits. These came as governments, concerned about energy security, urged these companies to increase production, a strategic turnaround after years of pushing the energy transition. This raises the question of whether the transition will be affected, after record profits made it clear that the oil and gas sectors of these companies drive revenues much more than renewables do. It also led BP to go back on its initial promise to cut oil and gas production by 40%, updating expectations at 25%, a move that caused a positive market reaction.
Oil & Gas Supply Chain and Revenue generation
To understand the dynamics of the oil and gas industry, it is important to understand the supply chain, cost structure and revenue generation. The sector is comprised of three main activities: upstream (exploration and production), midstream (transportation and processing) and downstream (distribution and sale). Companies would generally split their division into upstream and midstream activities for oil, upstream and midstream activities for natural gas, and an integrated division focused on downstream activities for both oil and gas. The latter accounts for the majority of revenues. An example would be BP’s Customer and Products division, which includes gas stations, the brand Castrol for lubricants, aviation fuelling and retail locations, accounting for over 70% of revenues.
The most complex activity out of the three is upstream, split into five main stages. First is exploration for potentially viable sources of oil and gas. This is done through geological surveys, either directly by the government, who subsequently grants permits to companies in a latter phase of the upstream activity, or by a private company that obtains a license to explore the area. This process lasts up to 5 years and is followed by appraisal, which includes further exploration, drilling and the building of infrastructure, lasting anywhere from 4 to 10 years. The development phase has a similar length to appraisal and represents the preparation of the site for production. The production phase is next, where the cyclicality of the industry comes in: after years of development, which means high capital expenditures and R&D costs, stakeholders are finally rewarded, as the production phase triggers midstream and downstream activities, through the refining, transport and selling of the refined oil products and natural gas. This means oil and gas companies have high costs in the first years without generating any revenues from a specific project, requiring investments over a long horizon. Another feature of the cyclicality is within the production process and is contingent on oil and natural gas prices. Oil companies take the opportunity to pay large dividends when these prices are high to make up for periods of underperformance. For instance, BP had a YoY Dividend Growth Rate of 11.34% in 2022, with a 5Y average of -9.49%. Lastly, there is a closure process of the site, usually taking between 2 and 10 years.
Midstream activities come in during the production process, and include transportation, storage, processing and terminaling. Processing usually happens after extraction, where impurities are removed and oil and natural gas are separated into chemical components, such as propane, butane, and ethane. The processed oil and gas are subsequently transported to storage facilities, and often pass through terminals, which have the capacity to store as well, but also to prepare oil and gas for any type of transport, for instance from pipeline to tanker. Downstream activities come next, and start with refining, which is a subset of processing and can be done in the same processing facilities but is more commonly done in dedicated refineries. It is here that oil becomes gasoline, diesel, jet fuel and lubricant and natural gas is ready to be used as heating power and for electricity generation. Distribution and retailing are next, finally bringing in revenues through sales B2C, at gas stations and other retail locations and B2B, to industries, aviation companies and utility companies, amongst others.
European angle
In February 2023, TTF gas futures settlement prices fell below the €50/MWh mark, an all-time low since August 2021. The unusually exotic seasonal temperatures, high storage levels (45% above 5-year average), and the strong liquified natural gas supply are emphasizing the downward pressure on gas prices. The timing of this negative trend is extremely indicative as it happened despite a strong decrease in Russian flows. This highlights that Russia and Gazprom are finally losing their power over the European gas market. However, gas prices remain around 3-4 times greater than their historic averages. It is, therefore, crucial for Europe to sustainably replace their Russian supply and drive prices down. In late 2022, calls for oil-rich countries by the likes of Saudi Arabia, the UAE, or even Venezuela to increase production have not been successful as OPEC and other major oil producers cut production volumes to sustain high price levels. Two countries, however, particularly stand out, Qatar and the United States.
Indeed, Qatar aims at an economic and political gain from the turmoil. It has long been an exporter of liquified natural gas to Asian countries, but it is now set to be a major actor in Europe as the continent is pivoting away from its Russian dependence. Major European countries like Germany and France signed long-term deals with Qatar. For example, TotalEnergies dedicated $1.5bn to help expand Qatar’s natural gas production to increase supply to Europe. The tightening relation between China and Qatar through their 27-year liquefied natural gas deal underlines the fact that Qatar is undermining the hopes of Russia to divert the energy Europe is no longer buying to Asia. The middle eastern monarchy finds itself in an ideal spot to become a vital player in the following years with the construction of four production and export terminals that will increase its export volumes by approximately 30%. However, certain European countries have growing concerns over the human rights and corruption record of Qatar even though it presents itself as a feasible replacement. The United States have also pledged to increase their liquified natural gas exports to Europe to compensate for the previous 15 billion cubic meters imported from Russia. In June 2022, US exports exceeded Russia’s gas volumes exported to Europe for the first time in history.
An important initiative is Fit for 55, a set of proposals that aim to update the direction and goals of EU climate, energy, and transport legislation. Its main goals are for the EU to reduce net greenhouse gas emissions by at least 55% by 2030 and reach climate neutrality by 2050. In pursuing this quest, EU countries must move towards renewable energy. According to various sources, liquified natural gas is the “cleanest” fossil fuel to start transitioning to a carbon-free future. Indeed, it produces 40% less carbon dioxide than coal and 30% less than oil. It finds an essential balance between affordable energy, secure supply, and driving carbon emissions to net zero. Therefore, the growing share of liquified natural gas imported from Qatar and the US to Europe can positively contribute to the Fit for 55 objectives.
Record- breaking O&G profits: where do they come from, and how to use them wisely?
Unsurprisingly, 2022 was a bumper year for O&G players. The six largest western oil companies, BP, Chevron, Equinor, ExxonMobil, Shell, and Total, reaped over $200bn in profits, the highest-ever number in the industry’s history. Unsurprisingly still, given that millions of people suffered from skyrocketing energy bills last year, these companies’ fat and oily profits sparked widespread outrage and criticism. Some angrily rebuke it as war profiteering, and some deem it ironic that, while the world is shifting away from dirty fossil fuels, their producers are better off than ever. Naturally, these “windfall” profits and their intended use are under an intense spotlight, which are precisely the topic we will discuss in this part of the article.
What is the “Wind”?
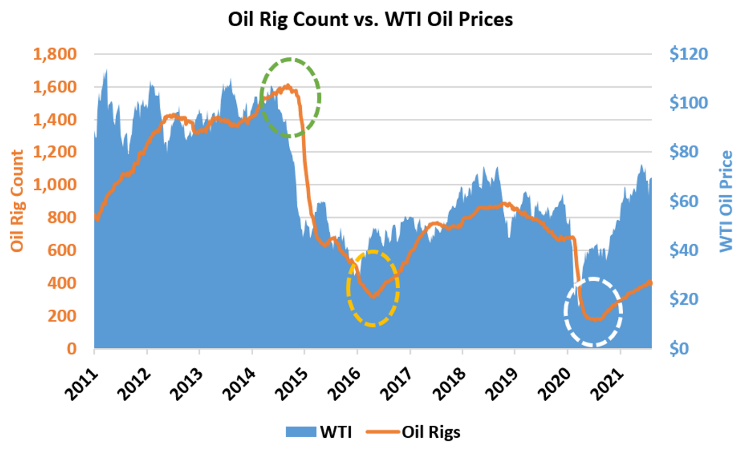
Before commenting on the use of the “windfall” profits, it’s helpful to understand their underlying cause, i.e., the “wind”. Intricate as the international oil market is, the dynamics on its supply side can be abstracted as the interplay between the oil investment and the oil price, as presented in the left-hand chart. As a proxy for Oil Exploration & Production (E&P) investment, the oil rig count experienced a sharp increase from 2011, peaked in 2014, dropped drastically in 2015 and maintained a low level onwards. The rise in oil rig count from 2011 to 2014 was primarily driven by the increase in the investment and production of shale oil in the US, the cost of which then became the benchmark of the international oil price: from 2013 onwards, the international oil price was highly synchronized with the top range of the shale oil cost. Without digging into the cause of this synchronization, which could be very complex, it is safe to say that the decreasing cost of shale oil suppressed the international oil price. As the oil price is the primary incentive for the oil capex, the suppressed oil price consequently lowered the Oil E&P investment. The high correlation between the international oil price and the Oil E&P investment is evidently presented in the chart.

Source: World Bank
From 2018 onwards, the energy transition narrative, represented by major countries setting out their net-zero plans, joined the low-level oil price as another major force curbing the Oil E&P investment. As shale oil production is highly polluting, the US oil companies have been facing increasing pressure from the government and society, being forced to hold back their investments. In general, one IMF study found that if public awareness of the energy transition had been the same as in 2014, the investment in fossil fuels would have been 38% higher in 2020. That could well explain the significantly slower pickup of the oil rig count compared to the oil price after 2020.
Given the above context, it is not difficult to understand that, after years of underinvestment, oil and gas companies cannot make up for Russia’s share in the oil market anytime soon. The EIA predicts that oil prices around $80 will persist at least until 2024. As the whole story is revealed, it is even more justified to define these profits as “windfalls”: oil companies are being rewarded not for their diligent investment but, on the contrary, for their effortless underinvestment, which unintentionally prolongs the time for the oil supply to catch up, keeps the oil price inflated and ultimately leads to their unexpected bumper profits.
Where should profits go?
Given the nature of the profits, the use of the fund poses a thorny problem, especially for large public O&G players. In general, there are 3 options on the table: investing in O&G development, distributing profits to shareholders, and investing in renewables. While aligned on disciplined O&G capex, European and American players are divergent in their attitudes towards investment in renewables. While European players like Shell and BP try to display more sense of mission in the energy transition, American players like ExxonMobil and Chevron take it more easily. Particularly, BP has committed to investing $60bn in their energy transition businesses over the next eight years, while Chevron only set aside $12bn until 2028 despite being a larger player. However, it seems that the market prefers the idea of the American players, as shares of Chevron and ExxonMobil trade around 10.5 times their projected earnings while the exact multiples for Shell and BP are around 6—a wider gap than historically.
Ridiculous as it may seem, we believe the market has a basis for such pricing, simply recalling the fact that industry revolutions are always led by new disruptors instead of legacy players. It is Apple who created the smartphone era, not Nokia or Motorola; it is Tesla who led the tide of electric vehicles, not Volkswagen or Ford. We can never expect the companies that benefit the most from the legacy to revolutionize themselves. By the same token, rather than having oil companies half-heartedly squander investors’ money on low-return renewable projects, it is more reasonable for them to return the money to shareholders who can then invest in committed renewable innovators themselves. The essence of finance is always to promote the efficient allocation of limited capital. Maximizing returns for their shareholders out of dirty fossil fuels, thus creating the most capital available for whom to invest in committed renewable players, is the best contribution of O&G companies to the energy transition.
M&A activity in the Oil & Gas Industry
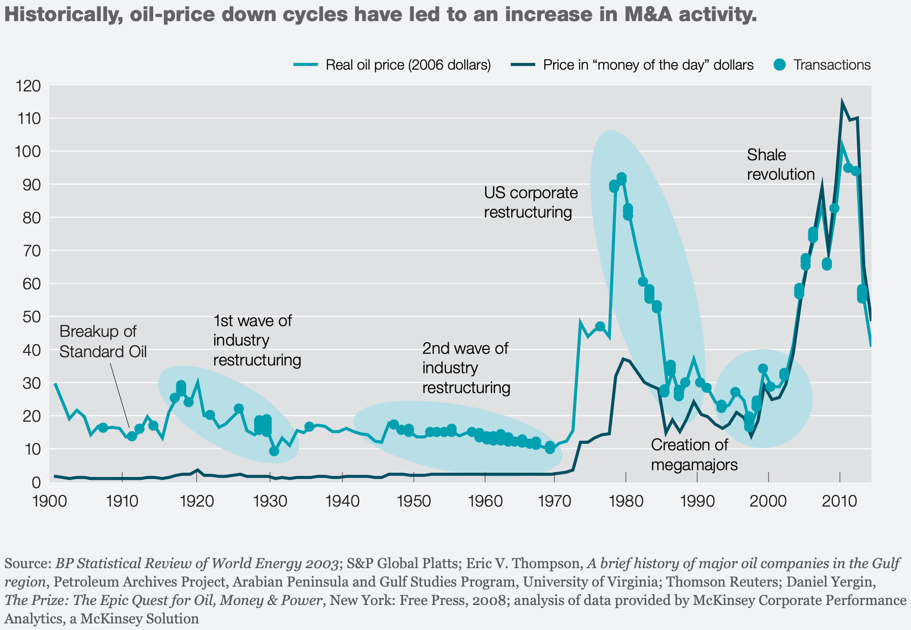
After a challenging year for oil & gas companies, will M&As pick up the pace in 2023? Historically, oil prices have been strongly correlated to M&A levels (Exhibit 2), so the stratospheric profits earned in the last year by oil and gas companies hint to a strong surge in deals in the coming year. In addition, experts are predicting a wave of consolidation as financially viable shale drilling sites become scarcer: producers are running out of prime acreage and yields from new wells are sliding after a decade of drilling. Since the sector remains highly fragmented, companies are looking to expand their balance sheets by acquiring rivals with the best remaining drilling sites. “If you can go buy resources at a reasonable value and you have the balance sheet and the cash to do it, you will go do it at these prices,” said Muhammad Laghari, a senior MD at Guggenheim Partners.

Source: BP Statistical Review of World Energy
In fact, the O&G industry has seen a significant number of deals in 2022, one of the most notable being the $6bn merger of Oasis Petroleum with Whiting Petroleum last July. The merger resulted in a new entity with a combined acreage of approximately 972,000 acres in the Williston Basin. Quite similarly, Chesapeake Energy consolidated its position in the Marcellus Basin by acquiring the two companies Chief E&D and Tug Hill for $2.6bn.
In the midstream and downstream sectors (concerned with refining and delivering petroleum products to consumers), several companies strengthened their positions in emerging markets through M&A. For instance, Fluxys’ and EIG’s jointly acquired GNL Quintero, the operator of Chile’s largest regasification terminal. Another example of such consolidation is the MOL Group acquiring 417 petrol stations from PKN Orlen, making it the third largest player in the Polish fuel retailing market.
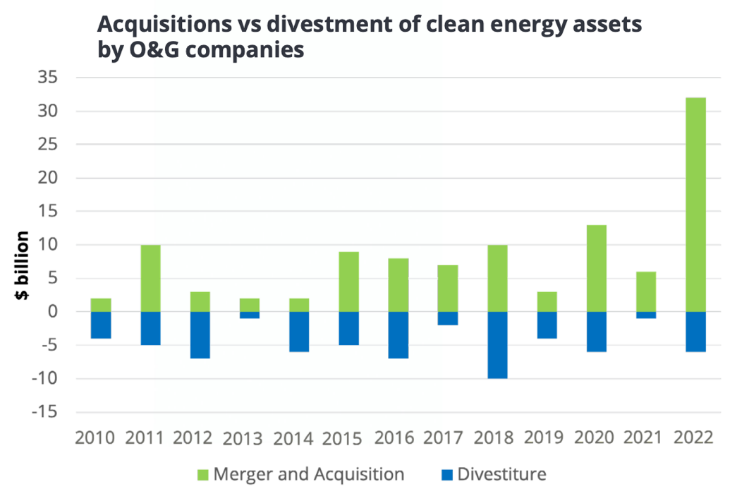
One of the main drivers of the 2022 M&A activity identified by Deloitte in its recent report “Oil and Gas M&A Outlook 2023: Pivoting for change”, was securing the supply chain: 82% of deals were for natural gas infrastructure, to answer the global rising energy security concerns. Another driver was the Permian Basin in Texas (the second largest oil field worldwide), which represented 30% of the upstream M&A deals of 2022 in the US. The third driver, according to Deloitte, is the accelerating energy transition, that drove $32bn of clean energy M&A in 2022, a huge increase as shown in the following chart.

Source: Deloitte, “Oil and Gas M&A Outlook 2023: Pivoting for change”
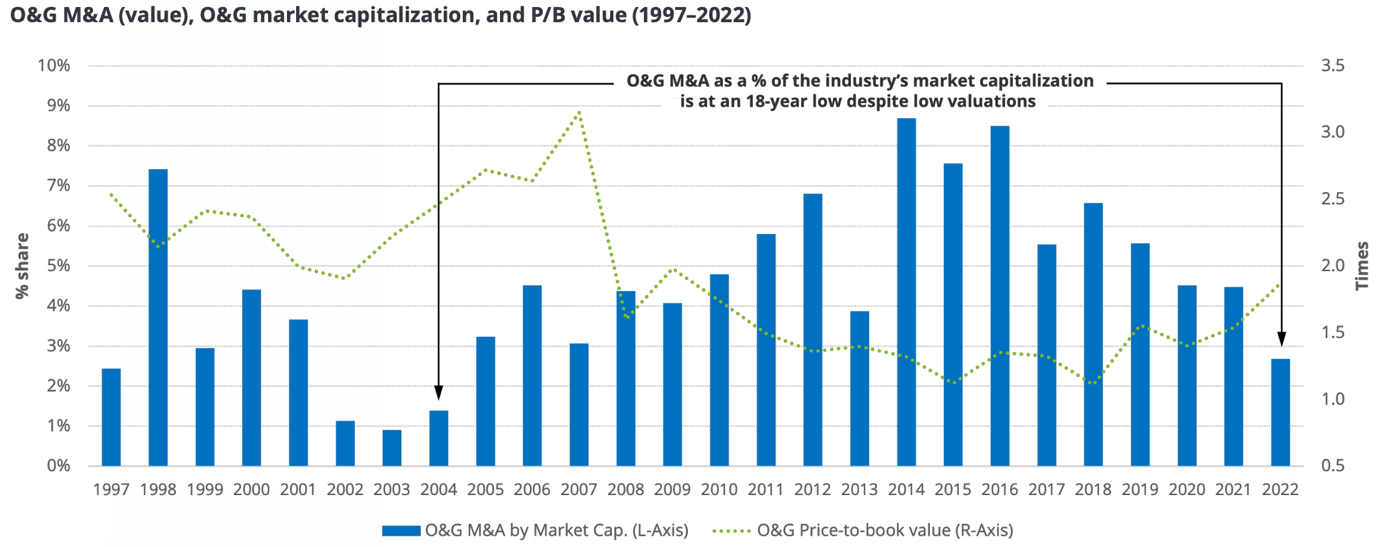
However, the situation remains quite concerning: M&A levels have reached their lowest level since 2004. Geopolitical events and economic uncertainty contributed to volatile energy prices across the globe. And despite record energy prices and low valuations, M&A activity in the oil and gas sector fell to its lowest level since 2008. Deloitte explains this by stressing that oil prices now have a much less significant correlation with O&G M&A activity and that the industry’s priority has changed from investing free cash flows in the sake of growth, to returning excess cash to shareholders though dividends and buybacks.

Source: BP Statistical Review of World Energy
IPO activity on equity capital markets
Another notable trend is that energy companies are making plans to go public both in the US and worldwide at levels not seen in years. After a weak 2022 in which the number of listings dropped by 60% and proceeds by 90%, O&G have been one of the few industries to move global equity capital markets.
In the US, if all the listings go ahead as planned, 2023 will be the strongest year for IPOs since 2017. For instance, the Texas-based O&G producer TXO Energy Partners listing in January was the first in more than six months for energy companies. And a further nine corporations from the energy and utility sector have filed initial public offering documents in the past 90 days, according to data from Renaissance Capital.
In the UK, Ithaca Energy’s listing last November defied volatile markets and became Britain’s largest initial public offering of 2022. However, it made a lackluster beginning as its shares fell by 11.6% by midday.
In the Middle East, IPOs are also making a comeback. In the last days, the UAE’s national energy company announced it would sell a stake of 4% of its natural-gas business in an IPO, that it hopes will raise $2bn. This is only the latest example of a wave of mega listings across the Gulf region as petrostates aim to diversify their energy-dependent economies.
Conclusion
To conclude, the Oil and Gas industry has survived through another turbulent, disruptive year. But the ship has still not sailed through the rough waters: “windfall” profits will need to be used for the transition to renewable energies, which European supermajors seem to be more committed to than their American counterparts. The market for IPOs and M&As also seems to be healing, after a long dry spell, thanks to oil and gas firms’ positive prospects.
But as always, with this industry, no one can predict what 2023 will bring. Will O&G firms suffer from underinvesting in petroleum? Will they meet environmental norms, and what happens if they don’t? Will they win the faceoff against the popular opinion and governments?


0 Comments