Introduction
During the last months, and especially from September, long-duration bonds experienced a dramatic sell-off, which pushed yields to historically elevated levels: U.S. long-term interest rates reached the highest level since 2007, while European bonds have not been so attractive since the Euro sovereign debt crisis in 2012. The decline in bond prices primarily involved the long-duration ones, causing yield curves across jurisdictions, particularly in the U.S. and Euro Area, to sharply bear-steepen, a dynamic characterized by the contemporary upward shift and steepening of the term structure.
In this article, we analyze the economic drivers that fostered recent bond market dynamics. As we will see, stronger economic growth and higher projected policy rates played only a secondary role, while the major component has been the rise in the term premium, the risk premium which compensates for the uncertainty regarding future inflation, fiscal stability, and macro volatility in general.
In the final part, we discuss the implications of higher rates for portfolio asset allocation, and we propose a trade idea on European swap spreads.
The drivers behind Bear Steepening
In the large majority of developed countries, bond markets have experienced a sharp rise in long-term yields causing yield curves to bear steepen. This dynamic occurs when long-duration bonds get sold off at a faster rate than short-duration ones and, consequently, the spread between long and short-term interest rates widens. Remarkably, the 2s-30s spread in the U.S., after being constantly negative for more than 14 months, and by more than 100 bps at the bottom, was close to turning back positive on Monday. The same happened in Europe, where the German 2s-30s was back in positive territory after being inverted since October 2022.
To understand the drivers of these dynamics, it is useful to decompose the long-term interest rates into the expected path of future short-term rates set by central banks and the term premium, which compensates for the uncertainty about future macro factors that could influence and alter the anticipated path of short-term interest rates. Examples of these factors include the predictability of future inflation, growth rate volatility, and sustainability of the fiscal policy embraced by the government.
As for rate expectations, we have witnessed a double dynamic in recent months. On one side, rate cuts were consistently pushed further away (first from late 2023 to the beginning of 2024, and later to the second half of 2024), while, at the same time, the expected long-term rates rose slightly. In the U.S., contributing factors were additional evidence about the resilience of the economic activity and the stickiness of inflation, despite all the tightening carried out by the FED in the last 18 months. Atlanta FED GDPNow current estimate projects real GDP growth for the third quarter above 5%, while the September CPI report came in hotter than expected, with monthly core CPI printing at 0.3%, mainly due to a resurge in rent inflation, and super core inflation (which excludes food, energy, and housing services) ticking up from 0% in August, to 0.6%. European countries, on the other hand, have been experiencing a completely different economic dynamic, with depressed growth outlooks and intact disinflationary forces. In Germany, the International Monetary Fund projects 2023 growth to -0.5%, amid weaknesses in interest-rate sensitive sectors and lackluster trading partner demand. However, European long-term yields have followed the US, in what seems to be an “imported tightening” of financial conditions which is inconsistent with domestic growth, inflation, and policy prospects.
Something unusual about the recent bear-steepening is that historically, long-term yields are often driven up by higher inflation expectations. However, this time, long-term inflation expectations have remained well-anchored, and are little changed in the past 3 months. Consequently, real yields rose substantially and, this week, reached the highest level since 2011 in Germany, and since 2008 in the U.S.
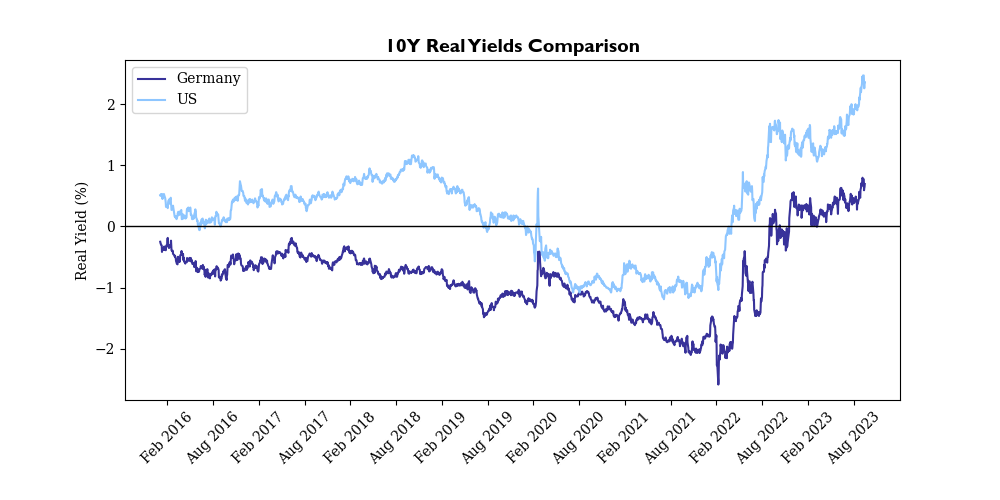
Source: BSIC, Fred, Borse Frankfurt
Nevertheless, the real reason behind the increase in the long end of the curve lies, for the most part, in the upsurge of term premium, both in the U.S. and in the Euro Area. The term premium is defined as the compensation investors require for bearing the risk that the actual future short-term interest rate path could diverge from expectations. This value is not directly observable and needs to be estimated with surveys or econometric models, such as the Adrian, Crump, and Moench (ACM) model (2013) (the one preferred by the FED), or the Kim and Wright (2005) one. In this article, we do not delve deeper into these models, but, as can be observed in the following chart, we note that all term premium measures indicate it has increased sharply and is currently at the top of the range for past decades.
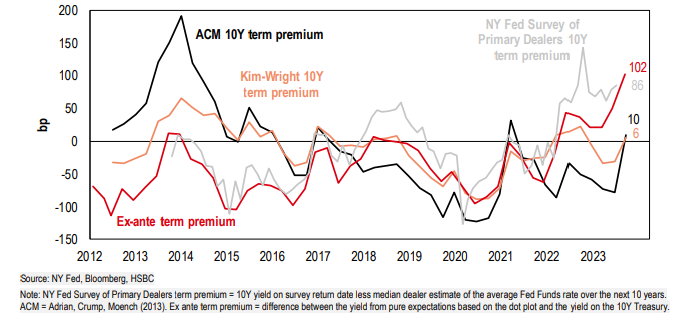
Overall, as can be seen in the following chart by Goldman Sachs research, in most of the developed countries, the prevalent component of the increase in 10-year yields is the rise in the term premium, while the rate expectations component is generally close to the annual average. The same holds for Europe, where Barclays researchers estimate that two-thirds of the rise in the 10-year Bund has derived from term premium repricing, while only one-third from higher rate expectations.
The rise in term premium is explained by elevated fiscal uncertainties and persistent budget deficits run by governments. The US economy, despite being at full employment and growing above potential, will run a deficit of around 5.7% of GDP in 2023 and the internal political conflict will constitute an obstacle to any fiscal consolidation policy for the foreseeable future. With a debt-to-GDP ratio of 122% (in ascending trajectory) and interest expenses higher than ever, justifying the rise in term premium is not a hard challenge.
The situation is not meaningfully better in Europe. In fact, despite the German Finance Agency announcing it will cut Q4 bunds issuance following better-than-expected evolutions in energy prices, both Italy and France surprised analysts to the upside in their Budgetary Announcements. Italy raised its 2024 fiscal deficit target to 4.3% (from 3.7%) and projects debt to GDP to hit 140.1% in 2024. Similarly, France projects fiscal deficit to be around 4.4% of GDP in 2024, resulting in a debt-to-GDP ratio of 109.7%. Considering that the growth projections published by the two countries are very optimistic compared to Bloomberg estimates (GDP growth of 1.2% vs Bloomberg forecast of 0.7% for Italy and 1.4% vs 0.9% in France), their debt situation could turn out to be even worse.
Asset Allocation for Sovereign Debt Investors
In the following section, we give our view on overall asset allocation in light of the recent developments in global economies. On a more global note, we think most central banks will have a rather cautious stance regarding rate cuts and won’t come to the rescue quickly to revive growth, giving priority to their mandate to control inflation. Additionally, fiscal support may be constrained for many countries due to the excessively high debt levels built up after the pandemic.
In the U.S., the rise in long-term interest rates pushed real yields to the highest level since 2007. As previously detailed, the increase was not only caused by economic data coming in stronger than expected, inflation stickiness, and upward revision of fiscal deficit but also by a steep rise in the term premium. If, when term premium was almost null (if not negative), the compensation for bearing duration risk was minimal, we now believe that long-term U.S. Treasuries offer an appealing risk-reward profile, while, at the same time, guaranteeing a hedge in case of a negative involution of the economic activity, a credit event, or a shift to negative sentiment. Currently, we identify the major risk of long-duration bonds to lie in the exceptionally large bond supply required by the fiscal policy. A budget deficit of 5.7% of GDP is a significant drag on bonds, especially when considering that the growth is solid and the labor market is at full employment (implying that cyclically adjusted deficit is even higher). This is not only due to the fact that fiscal loosening constitutes a headwind to the monetary policy in slowing down inflation, leading to more tightening, but also because the deficit has to be funded with debt, and therefore requires gigantic emissions of Bills and Treasuries.
Moving on to Europe, our view is that a recession is more than likely, with growth stagnating, unemployment rising, and fiscal deficits proving to be stickier than initially expected. Although the ECB signaled that it is nearing the peak of monetary tightening, we do not see rate cuts as imminent, and there are several factors that make the short-term path of interest rates uncertain. First, stickier deficits and an increase in supply, due to the potential acceleration in Quantitative Tightening (QT), could support higher yields for the near future. Additionally, although real yields are now attractive on a historical basis, the valuations are still demanding when compared to the U.S. Finally, we must not underestimate the potential impact of rising energy prices, especially after the recent developments in the Middle East. Oil prices, up by more than 25% since August, have added additional worries around the inflation outlook, and, considering the recently renewed geopolitical uncertainties in the Middle East, potential additional supply disruptions could spark further upside in the oil market, especially if Western countries decide to apply sanctions to oil exporters like Iran.
Monetary policy will play out at different speeds and with different dynamics in the various countries of the Eurozone. For instance, markets currently price in a 70% probability of recession in Germany, and although the government revised downward Q4 issuance, we do not see this trend holding up in the medium term, as we will discuss in the trade pitch. The Italian economy is looking even worse, with the government still very optimistic about growth, a view which is clearly not shared by the market. Looking at BTPs, although outflows from foreign investors are cooling down, most of the demand is still driven by retail investors and could not hold up in the medium term, especially if economic conditions start to deteriorate. Hence, the widening trend of the BTP/Bund spread will likely continue. Thus, we reiterate our bearish view on EGBs spreads, which would widen further in case of a recession.
In the UK, the uncertainty on energy prices and wage growth will fuel rates volatility in the short term and will be a credibility test for the MPC. Markets will likely start demanding an even higher term premium, pushing for further steepening of the curve.
Trade Pitch
We continue seeing fiscal uncertainty and budget deficits for European countries as sticky in the short/medium term. This, combined with a potential acceleration of QT by the ECB will significantly impact the supply and demand dynamics of EGBs. Thus, we propose a narrowing trade on 5y Euro-area swap spreads.
Trading swap spreads entails trading the government bond against the corresponding swap, taking a view on the differential between the two instruments. The bond yields usually trade below the swap yield, so the spread is quoted as (swap – bond). A swap spread trade allows us to hedge the interest rate risk and get exposure to the other factors influencing the relative performance between the two instruments, such as the supply and demand dynamics between the swaps and bonds markets, the future budget deficits of the specific country, liquidity, and hedging flows (mainly from mortgage and corporate issuers).
Source: BSIC, Bloomberg
Germany’s budget deficit, which is expected to reach 4.20% of GDP in 2023 (vs 2.62% in 2022), will call for increased issuance and thus push the swap spread lower. It must be noted that the German Government revised Q4 gross issuance downwards by €31bn, after lower-than-expected energy costs, which could support higher spreads in the short term. However, issuance plans are announced at the end of the previous fiscal year, so revisions are to be expected, especially in this period of energy prices volatility, and we see this downward revision solely as a short-term driver for spreads.
The key-medium-term trend for swap spreads will be the normalization of the ECB balance sheet. Normalization of the balance sheet is necessary because (i) it greatly exceeds the optimal amount needed to implement monetary policy and steer short-term interest rates, and (ii) its huge size brings several disadvantages. Through the Pandemic emergency purchase programme (PEPP), the ECB purchased €1.6tn+ worth of securities (as of Sep 23), 400bn of which are bunds (25%). Hence, the German free float is set to continue to increase as QT picks up, and a potential acceleration in the policy could further exacerbate the effects.
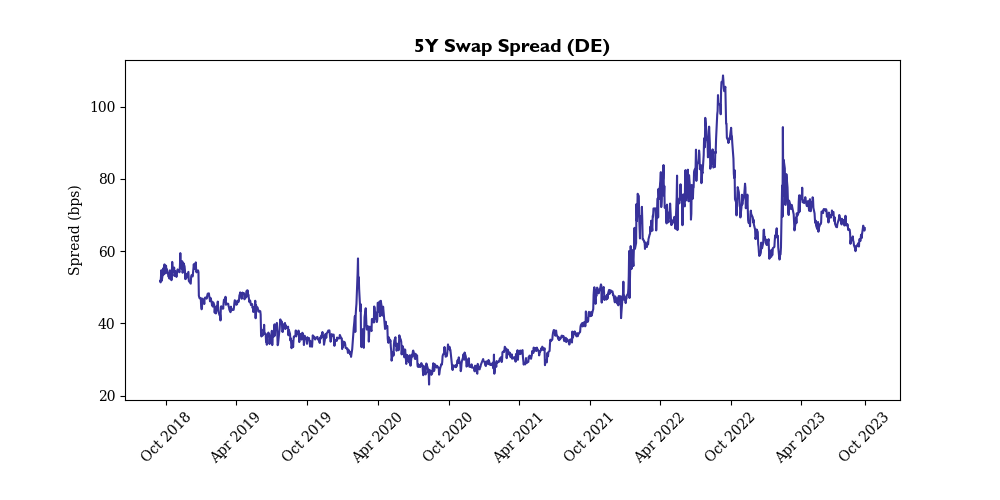
Another important aspect to consider is that swap spreads have historically had positive directionality with rates, meaning that they tend to narrow as rates decrease and widen as rates increase. This could prove as an additional tailwind in the case markets were to start pricing in the worse economic outlooks of Europe vs the US.
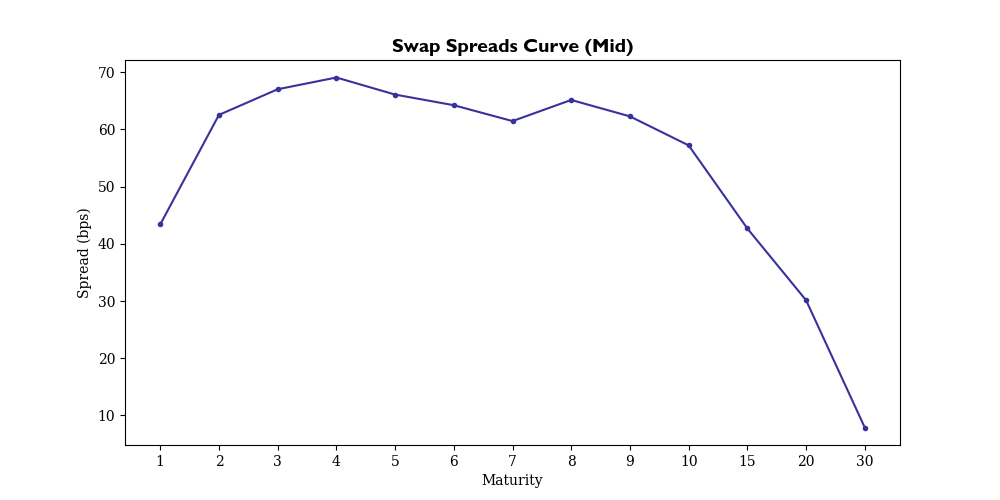
Source: BSIC, Bloomberg
We now elaborate on the specifics of the trade. Since we are taking a view on the swap spread narrowing, we are going long the swap (receiving fixed) and short the bund; we choose a 5y maturity because, along with the 10-year, it is the section of the curve that is most affected by supply and demand dynamics of the bond markets. The goal of a swap spread trade is to get exposure to the spread risk between the two instruments and hedge away any other risk related to yield curves or interest rate movements. To achieve that, we must satisfy two criteria: maturity matching and risk weight matching. Maturity matching means simply choosing the same maturity for the swap and the bond, which allows us to eliminate any exposure to changes in the yield curve. Matching risk weights, on the other hand, involves equating the DV01 of the two legs (the IRS and the Bund), so that if yields move by the same amount in the same direction (hence, the change in the spread is null), our PnL is not affected.
In this case, the risk weightings will be 1.16:1, meaning we sell 1.16 risk units of bunds for each risk unit of IRS we buy (mind, these are risk weights, not notionals). We enter the trade at the current level (66bps), setting a stop loss at 75bps and a take profit at 45bps. One risk of the trade could be that a credit event could shake the financial sector’s health and cause spreads to widen. However, we see this risk as marginal, as the main counterparts to Euro Swaps are European banks, which are sitting on lots of cash after the increases in NIIs and have very conservative capital ratios in place.


0 Comments