YOOX reported its quarterly results on Wednesday 7th May after market closure. Most items experienced a significant growth (it is not something new for the e-commerce player): revenues were up 14.6% y-o-y, EBITDA resulted +33.9%, but net profit was down 13.4% in the same period. Moreover, the management confirmed the guidance. The fact that profitability is decreasing is not a big short-term issue for a company that is investing huge resources in logistics and technology and announced, back in 2011, that it will not distribute any dividend until the investment plan will be completed (probably in 2016). Furthermore, also its closest competitor, Asos (listed in London), has reported a similar path in its recent results.
Nonetheless, markets were scared of bad surprises and YOOX closed the Wednesday session at -6%. Anyway, given what we said previously, market reaction to quarterly results had been extremely good initially: immediately after Thursday opening, the stock rebounded more than 4%. In the early afternoon, though, something changed and YOOX closed without any variation compared to the previous day.
It is clearly easier to speak ex-post, but the reality is that we were not surprised by this marked change in YOOX intraday direction: we were, instead, shocked by the +4%! This is not due to fundamental analyses, but to technical patterns.
So, even if we have already marginally analysed YOOX in some previous articles (How to trade Moncler and Are luxury stocks too expensive?), and the main outcome was that the e-commerce player was trading at acquisition multiples, not being very attractive for long only, buy-and-hold investors at that price in our opinion, we will not start from those results. On the opposite, we will focus on a possible strategy to trade the stock without caring about the “fair value” of such innovative firm.
The strategy that we are going to describe is based on a recurrent harmonic pattern. Harmonic trading is an approach that uses Fibonacci numbers to identify potential reversal points, building price patterns that are supposed to repeat during a stock lifecycle.
The precise pattern that we have identified is the so called “bullish butterfly pattern”.
Source: www.harmonictrader.com
As we can see in the picture above, the relevant steps that the configuration should theoretically follow are:
1. It begins with a precise 0.786 B-point retracement of the first leg
2. C-point must be in the range 0.382 – 0.886 of the second leg
3. Finally, D being at least 1.618 of the BC leg and 1.27 XA extension
In the case of YOOX, the pattern is almost finalised: if we are right, the price will reach D-point in the next trading days.
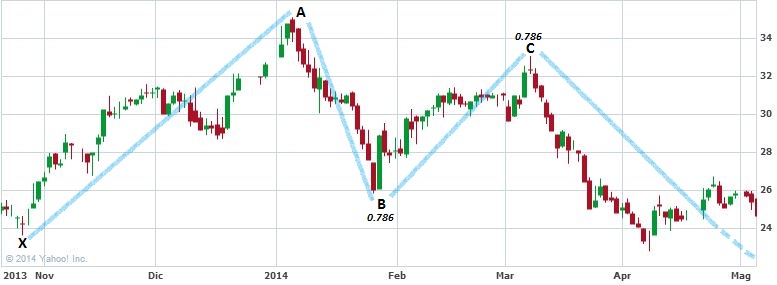
Source: www.finance.yahoo.com and BSIC
The pattern has started on the 28th October 2013 (X-point at €23.65); the first leg finished at €35.00 on the 6th January 2014. B-point is the opening price of the 28th January, at €26.08: this is exactly a 0.786 retracement of XA leg. C-point came out as another 0.786 (of AB leg) at €33.08 on the 7th March 2014.
Considering those inputs, we expect a D-point at €21.76, corresponding to 1.618 BC projection and 1.27XA extension.
We are particularly confident that the pattern will be completed mainly due to three reasons: firstly, the A, B, C points have been extremely precise; secondly, the specific levels touched by the price (0.786 B and 1.618 D) contribute in shaping the “perfect bullish butterfly”, which should give even stronger signals than a simple butterfly pattern. Finally, we identified also a secondary harmonic pattern, a simple partial AB = CD movement begun in C-point, that is likely to end at €21.76 precisely.
After setting a target, the second complex question to answer is when the price will reach €21.76. It is always difficult to state when a pattern is likely to end, especially for extremely volatile stocks like YOOX. Our guess, based on other technical analysis tools and price projections and taking into account results of similar analyses carried out on major indexes (to understand the general market trends), is between 12th and 15th May.
Possible risks to the completion of the “butterfly” are the following in our opinion. The last leg is often the most unpredictable, since the pattern has already evolved for weeks (but it is very unusual to find results as precise as those showed by YOOX stock price so far are). Besides that, another threat stems from the fact that the stock has found a strong support at €23.20 (equivalent to the 1.41 projection of BC leg), the last hurdle before €21.76. Finally, there is still the possibility that unpredictable events (i.e. a takeover) will completely change the game.
It is important to bear in mind that this is a bullish pattern: after touching €21.76, the stock should bounce. A first target could be €26.00, still far from recent target prices published by research analysts, but this is another story!
A closing price below €21.76 would eliminate the pattern probably, instead of amplifying it.
[edmc id=1668]Download as pdf[/edmc]


0 Comments