Introduction
The rapid expansion of digital assets like Bitcoin (BTC) and Ethereum (ETH), marked by surging market capitalization and trading volumes, has signaled the arrival of a new asset class. Instruments for both cash and derivative exposure are now actively traded across crypto-native exchanges (like Deribit and Binance) and traditional exchanges (such as the CME). This parallel trading environment provides a valuable opportunity to explore asset pricing mechanisms and market efficiencies.
One of the most relevant features of these assets is the significant difference between spot and futures prices, we can refer to this gap as crypto carry or basis, and theoretically it could be considered as a risk-free arbitrage. We quantify the crypto implied yield and try to explain the frictions that explain the mispricing and impede the realization of ‘risk-free’ arbitrage opportunities. We explain why we can observe that convenience yield in crypto fluctuate so strongly and why smart money does not take full advantage of the high yields implied by crypto carry. In both cases we provide causal evidence based on the introduction of new financial instruments.
The unique characteristics of crypto futures are fundamental to this analysis, as they differ from futures on commodities, fixed income, or foreign exchange (FX). Unlike commodities, digital assets have negligible storage costs. Unlike FX or fixed-income assets, they have a deterministic supply and are free from direct policy interventions. Finally, unlike gold or other financial commodities, they have no underlying industrial demand. This unique setup allows for a cleaner study of market dynamics
Having in mind the basic futures pricing equation:

Where Ft is the price of the future contract at time t, St is the spot price at time t, rt is the implied rate (financing cost), ut is the storage cost, yt yield form holding the spot (e.g., dividends) and T – t is the time to maturity. We try to show empirically that the main ‘fundamentals’ factors appearing in this pricing equation cannot explain the level and the volatility of crypto carry. First the variation in interest rates has little to no relation to crypto carry, we can observe that a simple linear regression of the crypto carry on the federal fund rates yields an
R2 of approximately 0, in the specific case from our sample the value 0.013. Storage costs are negligible (u≈0 ), since holding cryptocurrencies does not involve physical storage or significant maintenance expenses. This implies a large and negative convenience yield on crypto y<0. Investors prefer to be long the futures contract rather than being long the spot asset. We try to explain what the reasons of this large inconvenience of spot positions could be relative to futures in crypto, but first we analyse the carry levels.
BTC and ETH carry
The first task is to identify the carry in the cryptocurrency market. To do so, we used data on quarterly (3-month) delivery futures contracts retrieved from the Binance USD-Margined Futures. Specifically, we collected the daily closing prices of both the spot and the current quarter futures contracts for Bitcoin (BTC) and Ethereum (ETH) from January 2021 to October 2025.
To estimate the implied carry, we inverted the futures pricing formula discussed earlier. Since we are working within the cryptocurrency context, we set ut=0, and then annualized the resulting value. The formula we obtain is:

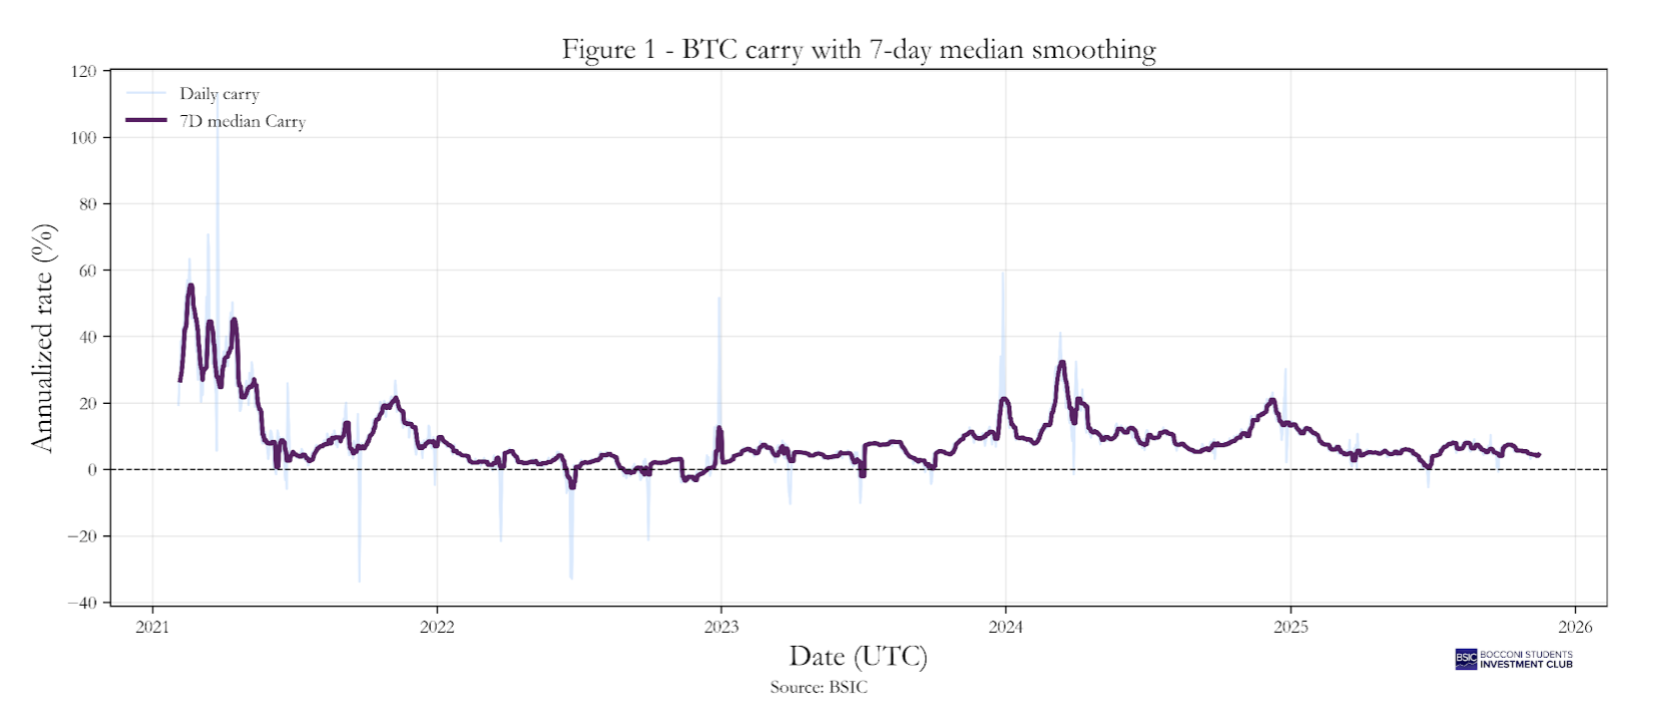
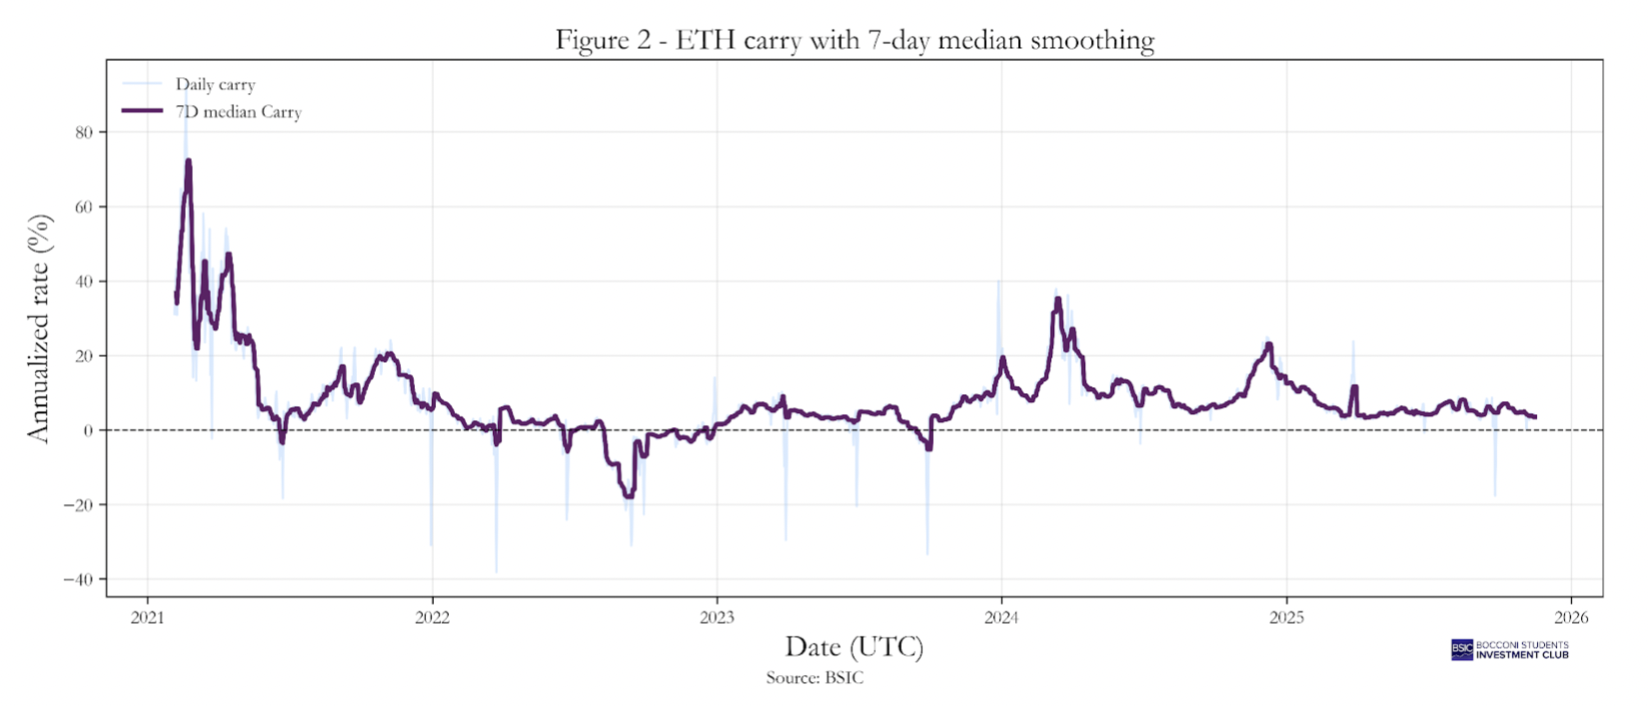
We computed the day-by-day continuously-compounded implied carry, expressed as an annualized rate. However, this raw series exhibits several mechanical spikes every three months, which coincide with the expiry and rollover of quarterly futures contracts. These discontinuities do not reflect genuine changes in the underlying implied rate, but rather transient pricing frictions and low liquidity near contract expiration. To mitigate these artefacts and obtain a rate that more accurately represents the underlying funding conditions, we apply a 7-day rolling median filter. This smoothing procedure does not alter the economic information contained in the series; instead, it isolates the persistent component of the implied rate that is relevant for our analysis, while filtering out expiry-related noise and idiosyncratic daily jumps.
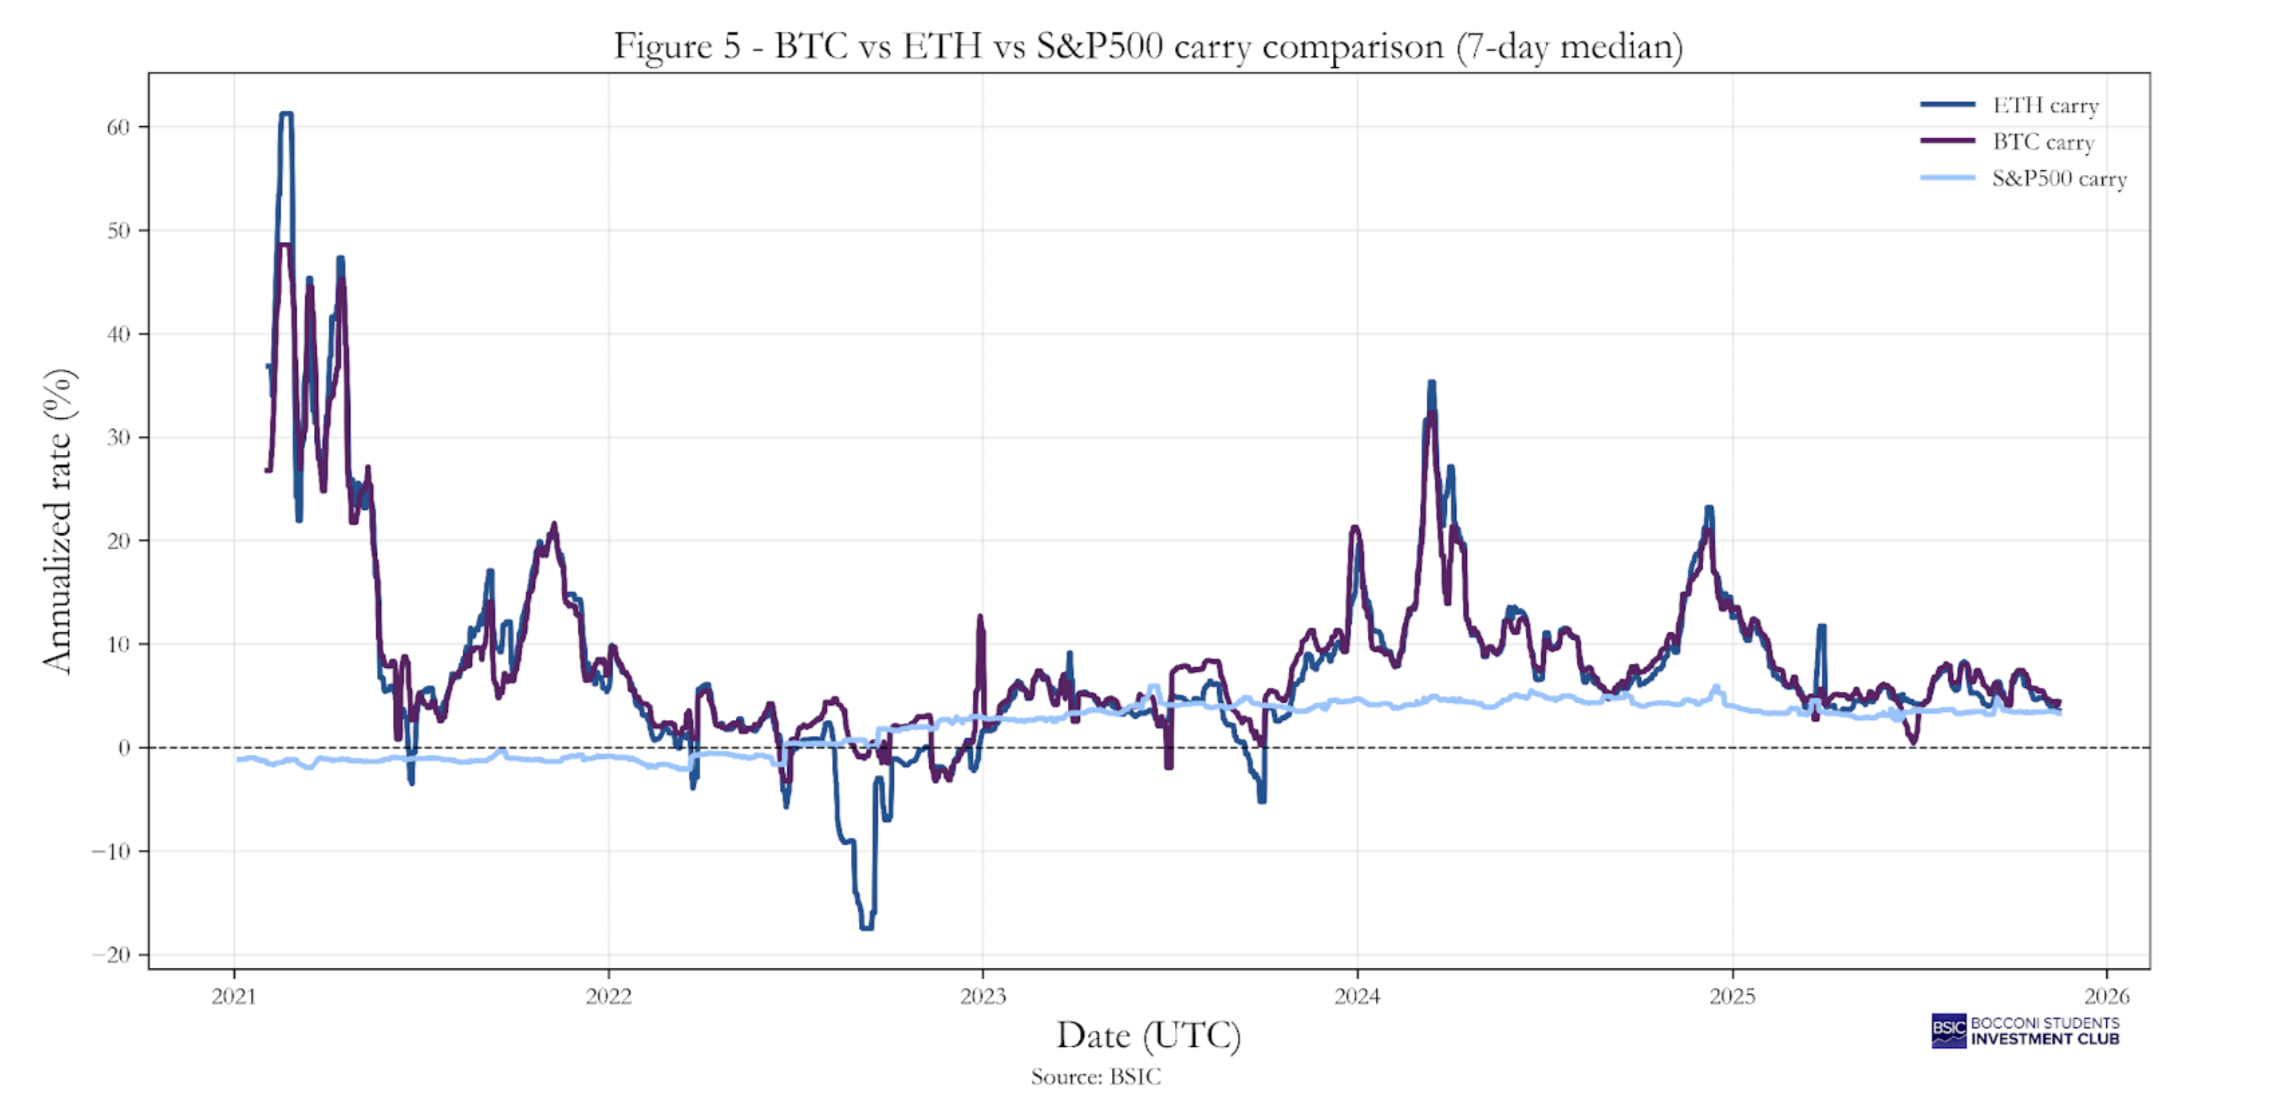
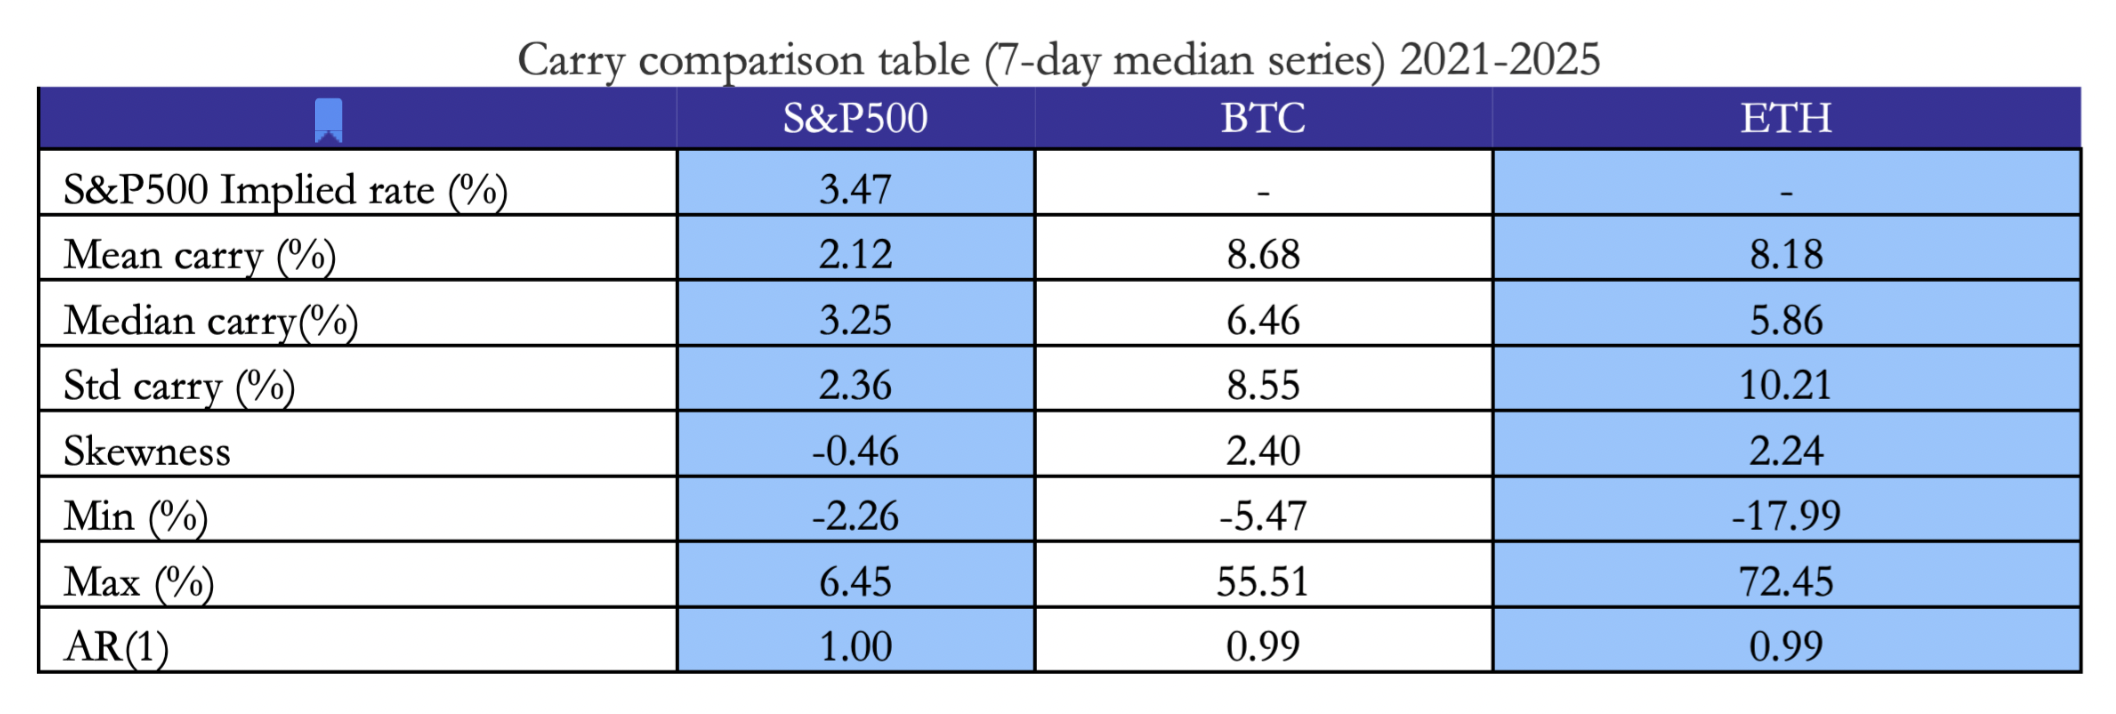
Graphs 1 and 2 display the 7-day median smoothed series for BTC and ETH, which, unsurprisingly, follow a similar trajectory. The mean implied carry is 8.68% for BTC and 8.18% for ETH (Table 1). In both cases, the values exhibit significant fluctuations over time, with particularly high levels observed during 2021 and again between the second half of 2023 and 2024, for reasons we will explain later.
S&P500 implied rate
We then applied an analogous procedure to the S&P500 futures market, using data from January 2021 to October 2025. Specifically, we collected daily closing prices for the S&P500 index and the front-month E-mini S&P 500 futures contracts from Yahoo Finance. The futures contracts are quarterly delivery contracts traded on the CME, which typically expire on the third Friday of March, June, September, and December.
The underlying formula is identical to the one introduced earlier, derived from the cost-of-carry relationship. In the case of equity index futures, such as the S&P 500, both the storage cost and convenience yield terms used in commodity markets are not directly relevant. Instead, we must account for the dividend yield (q) earned by holding the underlying index, which effectively reduces the net cost of carry. Accordingly, the carry formula becomes:

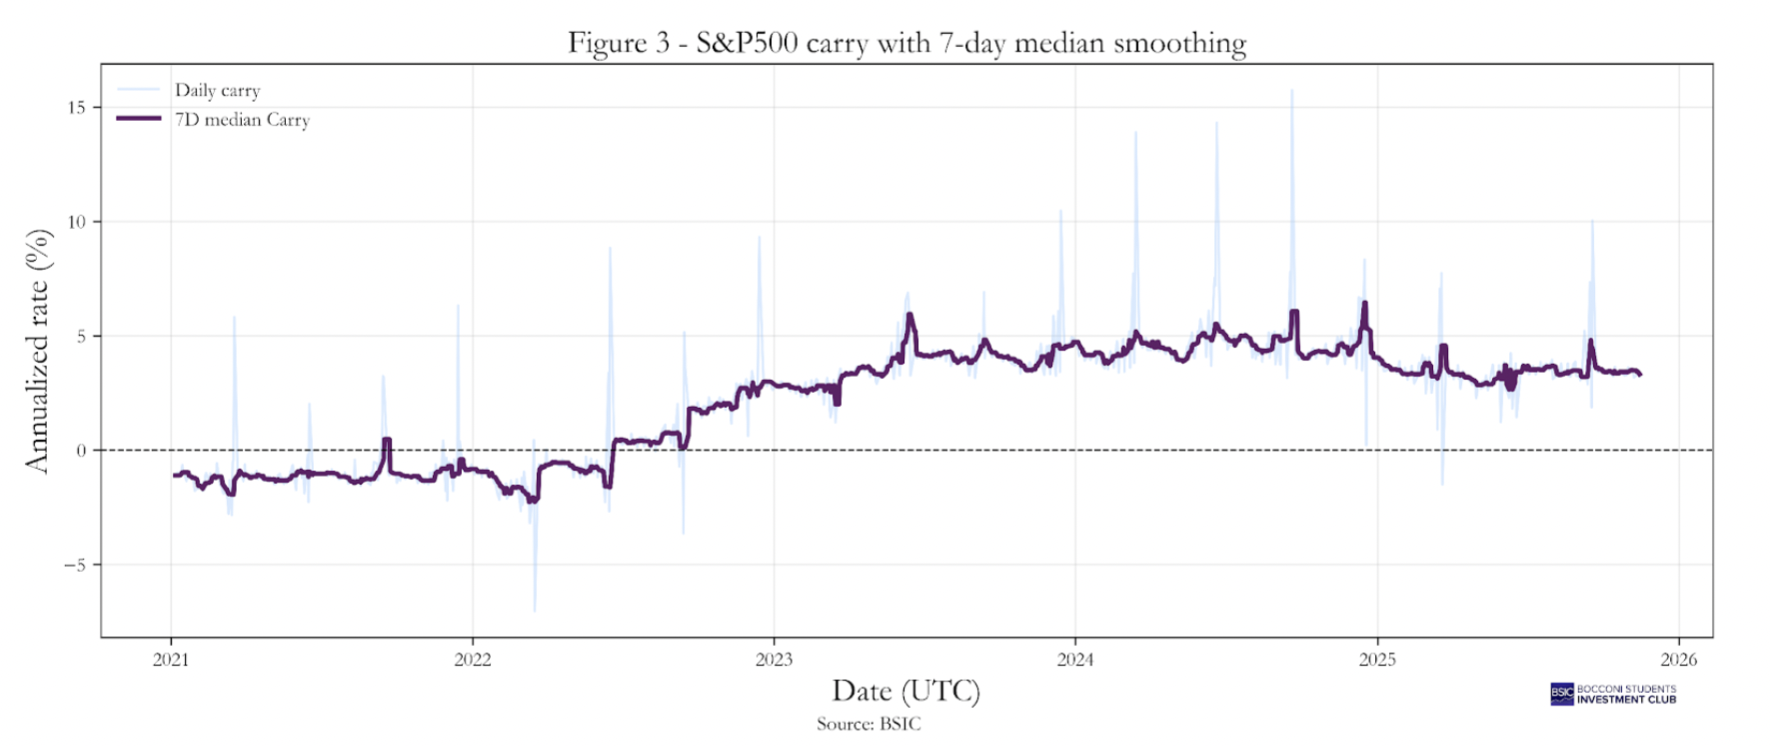
In addition, we applied the same adjustment to the S&P 500 daily carry series to minimize distortions occurring around contract rollover dates. Specifically, we employed the continuously compounded version of the cost-of-carry formula and subsequently calculated a 7-day rolling median to smooth short-term fluctuations. As shown in Graph 3.
From this, it is clear that the implied rate (rt) adjusted for dividends obtained from the above formula is:

To estimate the dividend rate (q), we used historical SPY dividend payments as a proxy for future dividends, even though using dividend futures data would be more accurate. For each trading day, we computed the trailing 12-month (TTM) realized dividend yield as the sum of all dividends distributed by SPY over the previous 365 days divided by the corresponding SPY closing price:

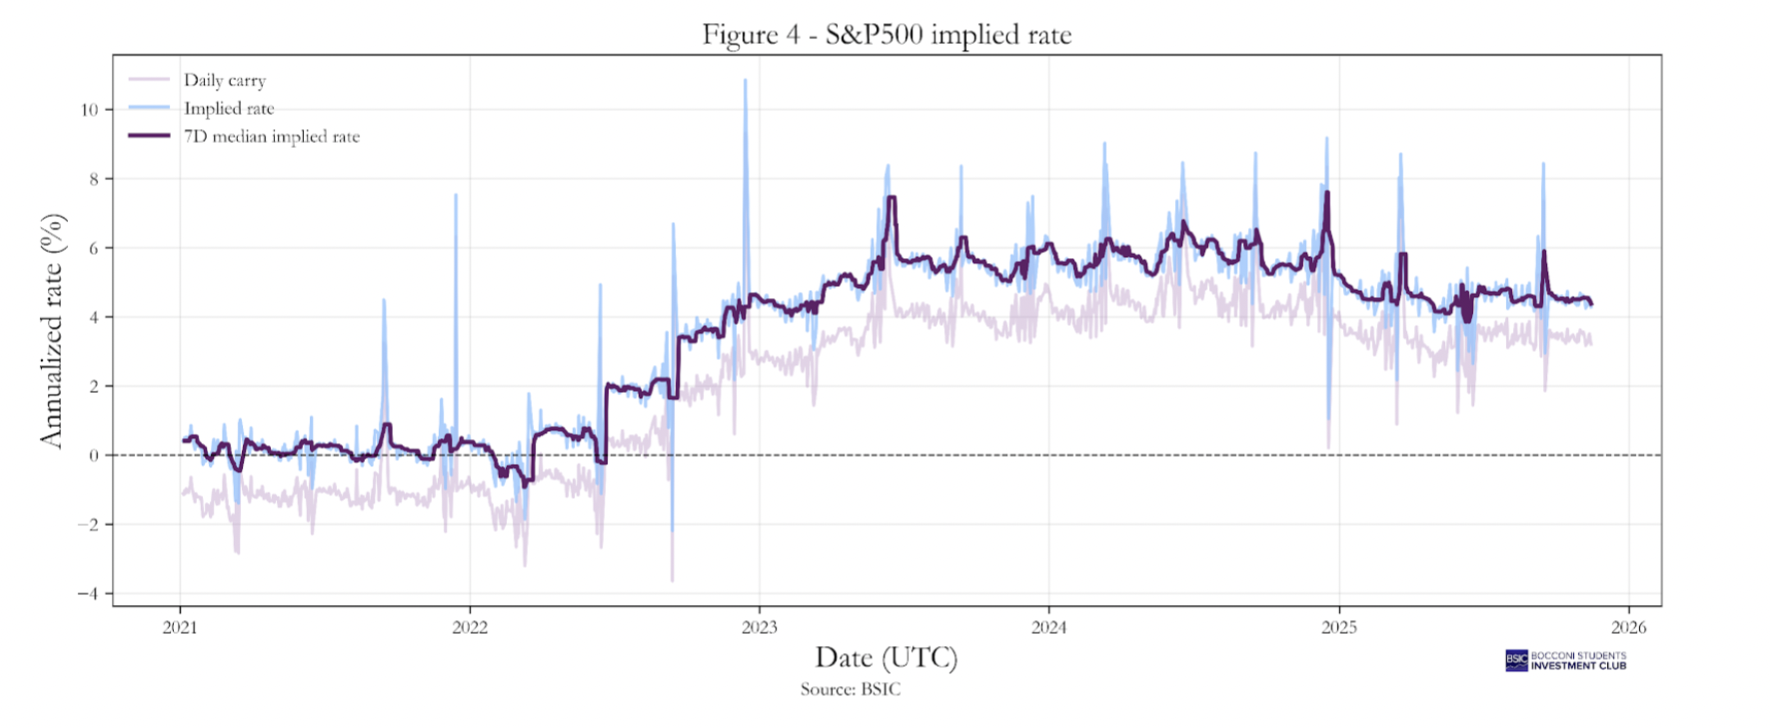
Graph 4 shows the carry series constructed as described above, together with the series representing the implied rate for the S&P 500. A 7-day smoothing adjustment, consistent with the previous cases, has been applied to reduce short-term noise. The mean implied carry for the S&P 500 is 3.47%, while the implied rate (after dividend adjustments) is 2.12%, clearly following the trajectory of the Federal Funds Rate.
Understanding crypto carry
We can observe (Graph 5) that BTC and ETH exhibit significantly higher carry when compared to the S&P500, with mean values around 8.68% for Bitcoin and 8.18% for Ethereum, compared with only 2.12% for the S&P 500. Moreover, the carry on the two cryptocurrencies is considerably more volatile, their standard deviations (around 8.5–10%) are roughly four times larger than that of the equity index. The distribution of crypto carry is also strongly positively skewed, with frequent large positive spikes (skewness ≈ 2.4 for BTC and 2.2 for ETH), while the S&P 500’s carry shows a mild negative skew (–0.46).
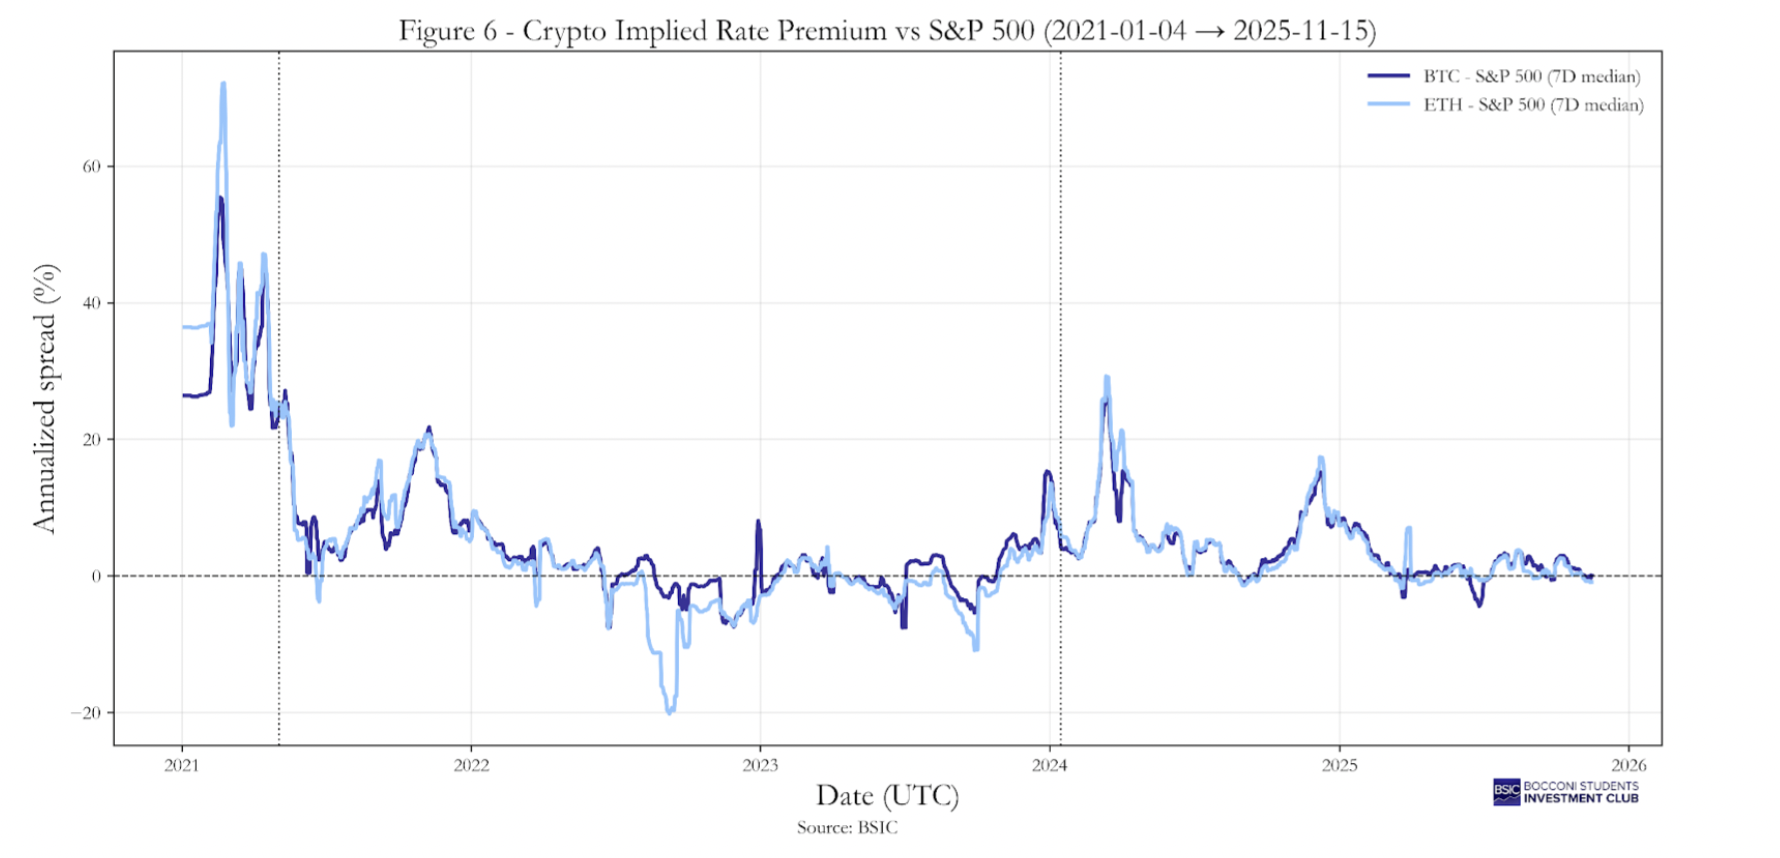
In particular, we consider the spread between the carry of BTC/ETH and the implied rate derived from the S&P 500 futures. To determine the factor yt, we provide a graphical representation in Graph 6, where we also include two vertical lines corresponding to 3 May 2021 and 15 January 2024, which will be useful for our conclusions later. Considering the mean values summarized in Table 1, we find that the average spread between BTC and the S&P 500 is 5.21%, while for ETH it is 4.71%.
Price pressure
The root of these strong swings can be found looking in the counterparties active the most in the crypto futures market. While other futures markets are dominated by commercial entities and institutions, the composition of traders in Bitcoin futures shows that the largest long positions come from smaller investors who seek leveraged exposure to crypto. To formally establish this relationship, we observe an event that made it easier for smaller investors to trade bitcoin futures, the introduction of micro bitcoin futures by the CME on 3 May 2021. While the standard bitcoin futures contract on CME is equivalent to 5 bitcoins, the micro bitcoin futures contract is 1/10 of one bitcoin so 1/50 of the standard bitcoins’ futures contract. As shown by Maik Schmeling, Andreas Schrimpf and Karamfil Todorov (2023) running a DiD regression shows that the relative difference between carry on the CME and that on other exchanges increased by 11% after the introduction of the micro contract. These results provide indicative evidence that higher demand by smaller, presumably less sophisticated investors pushes up carry.
Key frictions in crypto cash-and-carry trades
We observed the buying pressure that was generated by smaller, trend-following investors. It is important to understand that a well-executed arbitrage mechanism should neutralize such demand pressure. An arbitrageur would take an offsetting positions in spot and futures markets to benefit from the price discrepancy and bet on that they will converge at maturity.
If carry is positive at time t, a cash-and-carry arbitrageur would take a long spot position and a short futures position. Since Ft,T>St , the payoff is positive at time t and zero at maturity T, given that FT,T–ST=0. These simple trades guarantee in theory a “risk-free” return given that the spot position hedges the futures position and there is no risk for the arbitrageur. However, in crypto markets there are at least two key frictional factors that arise from regulatory barriers or from regulatory uncertainty that makes these cash-and-carry trades much riskier than in this stylized textbook example.
First, on regulated exchanges (CME), where we presume sophisticated arbitrageurs would operate there is no way of cross-margining between the spot and the futures positions because the spot positions, the crypto, cannot be held on the exchange and so arbitrageurs would need to pledge liquid assets as collateral for the futures positions. This is a crucial point because in this scenario, losses on the futures positions would not be offset by the long spot positions. Basically, they would need to pledge capital twice: once to buy the spot positions in a separate account elsewhere and in collateral on the futures exchange.
Second, in crypto futures markets, margining systems are typically tiered and nonlinear, creating structural risks for arbitrageurs engaged in cash-and-carry trades. Most exchanges require maintenance margin based on notional exposure rather than chosen leverage, and as position size increases, the maintenance-margin rate rises sharply across tiers. Because spot and futures legs of a carry trade are often held in separate wallets or account segments, an adverse mark-to-market movement on the futures leg can require liquid collateral in the quote currency (often USD-stablecoins). When this collateral must be raised by selling part of the spot hedge, the trader becomes under-hedged and exposed to the underlying. These mechanisms make crypto carry trades highly path-dependent and subject to forced unwinds before convergence, especially in volatile periods when maintenance thresholds are updated or margin requirements are increased without much notice. For example, on Binance maintenance margin for BTC or ETH futures follows a tiered schedule where a small notional, may require roughly a 1 percent maintenance rate, while larger exposures quickly climb to 5-10% as tiers increase. Since Binance uses stablecoins such as USDT as the margin numeraire, a trader who is long spot BTC and short a USD-margined future must maintain enough USDT in the futures wallet to meet variation and maintenance margin. If the market moves against the short and the trader has to transfer stablecoins from the spot side potentially by liquidating part of the long position the hedge becomes imperfect. Therefore, the cash-and-carry trade in crypto is far from being a “free lunch.” Given the large spikes in carry observed in Figure 1-2, there is a high risk that a cash-and-carry trade, with spot and futures held in separate accounts, will be subject to a forced liquidation before convergence of the trade.
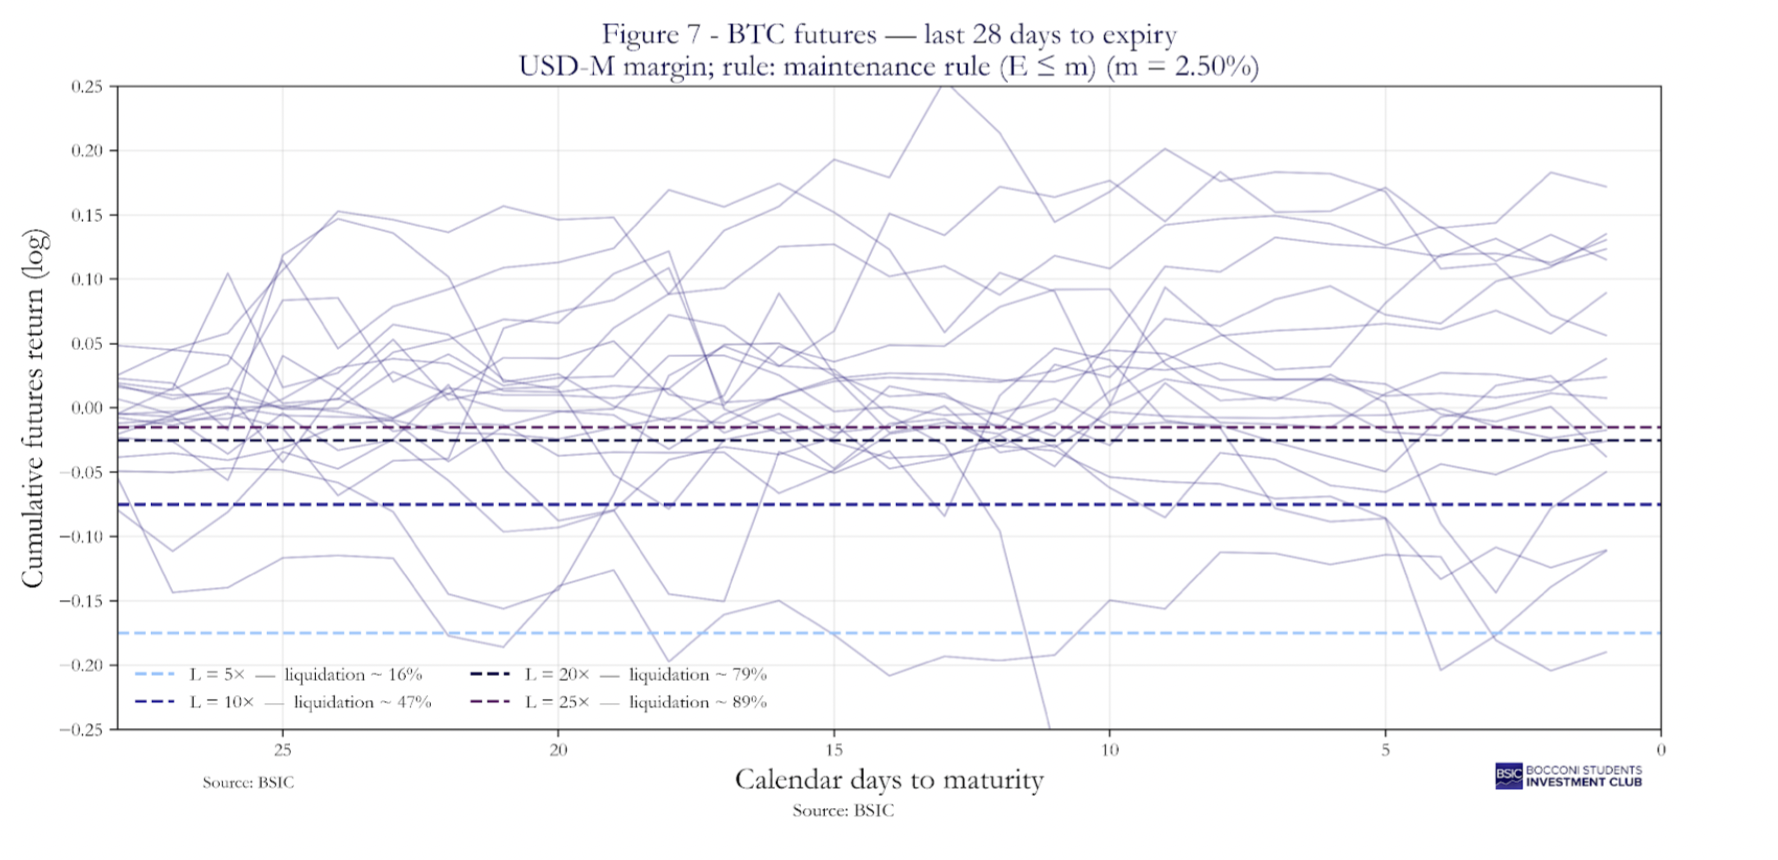
We now provide empirical evidence based on our sample to quantify the risk of liquidation for carry traders. We consider the risk profile of the futures leg in the cash-and-carry strategy. Figure 7, shows that the PnL trajectories of the futures leg assuming different levels of leverage, considerably lower than the one that could be obtained on the exchange. With a Leverage of 5 , the short leg would be liquidated 16% of the time, with a leverage of 10 the liquidations almost triplicate, 47% of the time, if we further increase the leverage to 20 that is a good approximation of the leverage we can find on crypto exchanges the position would have been liquidated 79% of the time, and we add another 10% of the cases reaching liquidation on 89% of the cases if we set the leverage to 25. These findings show the substantial risk associated with the future leg of the cash-and-carry trade, not being it protected by cross-margining, all that assuming a maintenance margin of 2.5%.
This fragmentation between spot and futures accounts can be an explanation why the carry on crypto assets tends to be roughly twice as high as the implied rate of the S&P500 futures. In conventional markets, cross-margining and efficient funding allow arbitrageurs to finance both legs of the trade with the same pool of capital, so the observed carry reflects a single financing rate. In contrast, on crypto exchanges, traders must fund both the spot purchase and the futures margin separately, effectively doubling the capital requirement. The resulting implied rate therefore appears about 2x higher.
Another indication supporting this limit to arbitrage explanation is the introduction of the spot BTC ETF in 2024. With more sophisticated and regulated investors gaining the ability to hold spot BTC directly, the constraint of maintaining spot and futures positions in separate accounts was alleviated. This development reduced the segmentation between traditional financial institutions and the crypto native ecosystem, facilitating the deployment of arbitrage capital. Consistent with this mechanism, Schmeling, Schrimpf and Todorov (2023) document that following the ETF’s launch, the average crypto carry declined significantly by about three percentage points across exchanges and an additional five percentage points on the CME.
Conclusion
In conclusion, our analysis demonstrates that the high and volatile levels of crypto carry cannot be explained by traditional pricing fundamentals, such as interest rate differentials or negligible storage costs. Rather, the evidence points to a market defined by structural frictions and segmentation. Futures prices are driven upward by persistent buying pressure from smaller, trend-following investors seeking leveraged exposure, while significant limits to arbitrage prevent sophisticated players from offsetting this demand. These frictions are not theoretical: they manifest as regulatory barriers, the absence of cross-margining, and tiered margin systems that make cash-and-carry trades highly path-dependent and vulnerable to forced liquidation. The introduction of the spot BTC ETF in 2024 provides compelling causal evidence; by enabling institutional investors to hold spot BTC, this instrument partially breached the market segmentation and led to a marked compression in carry levels. Therefore, crypto markets, far from offering a ‘risk-free’ arbitrage, serve as a clear example of how institutional frictions and investor composition jointly shape pricing dynamics in a rapidly evolving asset class.
References
[1] Philippe Bergault, Sébastien Bieber, Olivier Guéant and Wenkai Zhang, “Cryptocurrencies and Interest Rates: Inferring Yield Curves in a Bondless Market”, 2025.
[2] Maik Schmeling, Andreas Schrimpf and Karamfil Todorov, “Crypto Carry”, 2023


0 Comments