Introduction
Passive management as it is known nowadays was born in the 60’s and the 70’s. By that time, it was already clear that actively managed funds tended to underperform market indexes. For this reason, Nobel Laurate Paul Samuelson urged the investment management industry to develop a “portfolio that tracks the S&P 500 index”. This challenge and the underlying finance literature prompted Jack Bogle to set up one of the first S&P 500 index mutual funds: a low-cost, transparent and cap-weighted fund, meant to provide exposure to the pure market beta. Over time, index funds have outgrown their actively managed counterparties. In this article we will delve deeper on a different category of passive funds, those that pursue so-called Smart beta strategies. In the first part of the article we will examine how they differ from the traditional index funds; in the second part we explore what was driving their somewhat disappointing performance in the past decade.
The theoretical foundations of Smart beta strategies
The theory at the foundation of index funds is the capital asset pricing model (CAPM), which claims that the market portfolio is the mean-variance optimal portfolio that every market participant will hold. The key underlying assumption of CAPM is the efficient market hypothesis (EMH); if this holds, then portfolio optimization is reduced to buying a cap-weighted market index and balancing it with a risk-free asset according to one’s preferences. This portfolio will provide exposure to the beta as defined by William Sharpe: the undiversifiable risk of a portfolio. For this reason, proponents of the EMH argued for investing in passive index funds, while the rest favoured active funds.
Over time, the academic literature has evolved. Nowadays it proved that the CAPM relationship does not hold with cap-weighted indexes, which implies that an index fund is not the mean-variance optimal portfolio. Such literature has been the backbone for the next evolutionary step in passive investing, the birth of the so-called “Smart beta” at the beginning of the 2000’s. Smart beta strategies seek to break the link between the weight of an asset in the portfolio and its market capitalization. Its proponents claim that market capitalization is a very volatile measure of a company’s fair value, the consequence being that cap-weighted portfolios are overexposed to overpriced stocks and underexposed to cheap ones. To solve this problem, they propose to anchor the weight of a stock to non-price-weighted measures which reflect the fundamental value of the company.
Non-price weighted strategies are generally divided in heuristic and optimization-based weighting methodologies. The former are based on ad-hoc and sometimes simple rules; they include:
- Equal weighting: once the investable universe is set, each stock is equally weighted in the portfolio; a limitation of this strategy is that depending on the investment universe in which it is applied, it may lead to a high exposure to small, thinly traded companies.
- Risk cluster weighting: it classifies stocks belonging to the investable universe in different risk clusters, which are then equally weighted. As a result, the characteristics of the resulting portfolio are less dependent on the investable universe that is chosen.
- Diversity weighting: this strategy uses both equal and cap-weighting to form a portfolio interpolated between these two extremes.
- Weighting by historical financial variables: Smart Beta mainly focuses on this wide set of strategies. They seek to totally break the link between price and weight in a portfolio, weighting companies according to historical fundamentals such as book value, dividends paid, gross sales and cash flows. The investable universe is selected ranking companies according to such measures, and the weight of each company is a function of a mix of these variables.
Instead, optimization-based strategies seek to maximize ex-ante the Sharpe Ratio of a portfolio. They need as input the expected returns and the variance covariance matrix of all stocks included in the investable universe. These are more complex strategies which include:
- minimum-variance strategies,
- strategies aimed at maximizing the Sharpe Ratio according to various assumptions on the expected returns of stocks.
Many of these strategies were able to historically outperform the traditional cap-weighted market portfolio and register a statistically significant positive CAPM alpha. We may attribute this outperformance to the theoretical beliefs underlying some of these strategies, however, Arnott et al. 2013, prove that the reason underlying this outperformance is different. When a portfolio is built using an inverted strategy for each one of those mentioned above, the inverted strategy still results in a statistically significant positive CAPM alpha, sometimes even more positive than the one of the original strategy. For this reason, it is not the underlying investment thesis which leads to a positive alpha: otherwise we would expect that the inverted strategy underperforms the market index. Rather, the non-price weights inherently introduce a value and small-cap bias in the portfolio, which leads to a statistically positive CAPM alpha that can be fully explained for all strategies by using Fama French 4 (FF4) factors.
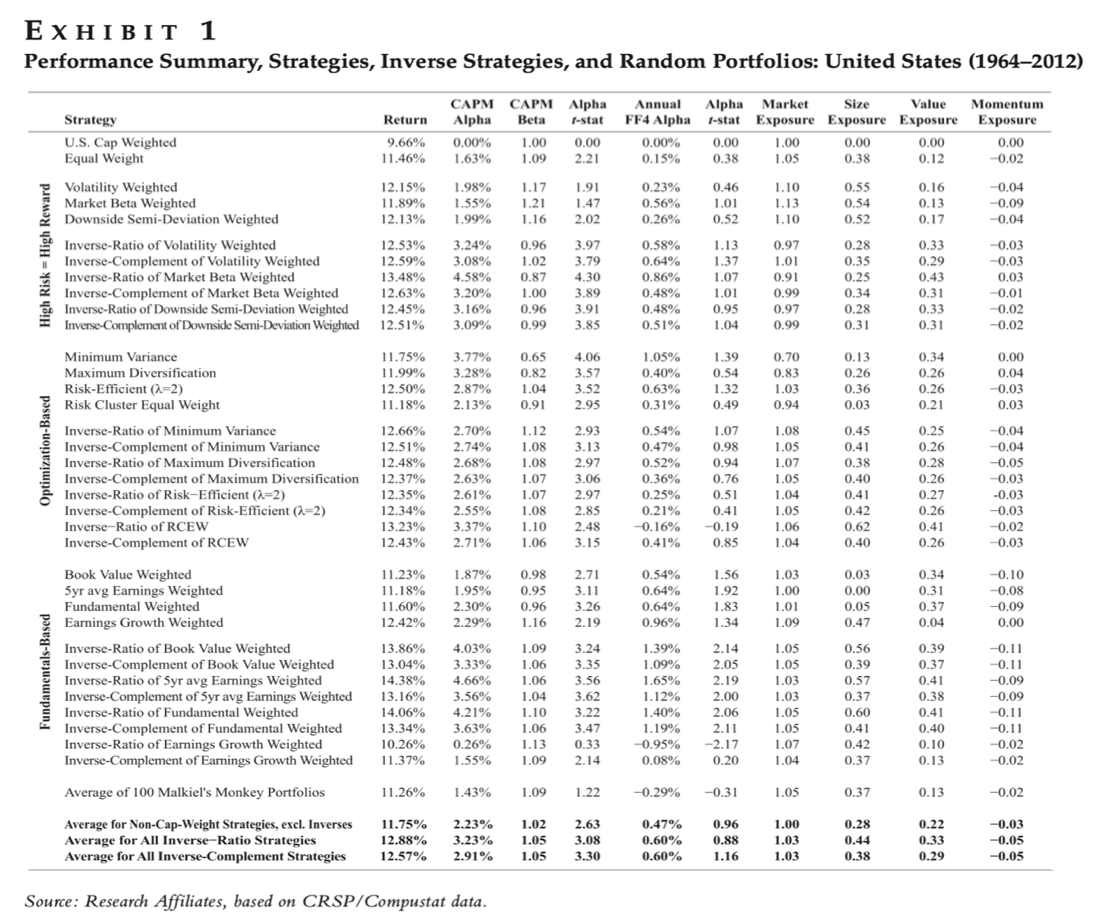
Source: Research Affiliates, based on CRSP/Compustat Data
Even though, there is not a statistically significant positive FF4 alpha, these strategies are useful to achieve a positive exposure to all risk factors, in particular value and size factors. This exposure cannot be achieved with traditional value and small-cap indices, because their portfolios are still cap-weighted.
Tower Watson in 2013 coined the Smart beta term defining it as follows: “Smart beta is simply about trying to identify good investment ideas that can be structured better, whether that is improving existing beta opportunities or creating exposures or themes that are implementable in a low cost, systematic way”. So, it is important to highlight that Smart beta strategies are still transparent, rules-based, low cost, and have ample capacity and liquidity. Thus, they retain many of the advantages of traditional index funds, while offering exposure to alternative betas; hence combining the benefits of passive and active strategies.
Costs of cap-weighted indexes
A key limit of cap-weighted indexes is that they have a tilt towards the largest companies and stocks that have recently outperformed the market. As we show both these tilts historically have led to underperformance and can partially explain the alpha of non-cap weighted strategies.
We focus on the S&P 500 index which is tracked by the largest index funds. The following graph shows the performance of stocks added to and those removed from the index one year before the announcement date, up to one year after the rebalance date. Since 1989, there is a lag of a few days between the announcement date (when Standard and Poor’s communicates changes to the index) and the rebalancing date (when the holdings of the index are effectively modified). This is a grace period to ensure index fund managers can adjust their holdings.
A cap-weighted index adds stocks that have outperformed the market, and removes those which underperformed. The extent of the performance gap between the two groups of stocks is staggering – it stands at about 64% over the year preceding the announcement date. During the grace period additions further outperform the market, while deletions underperform, the gap thus further increases by about 10%. Then, in the year following the rebalance date, additions are slightly underperforming, while deletions are overperforming the market. The subsequent gap is in favour of deletions and stands at about 20%.
 The reversal of fortunes for additions and deletions following the rebalancing date can be well explained looking at their relative valuation ratios: the following table shows that stocks added to index funds are priced at much higher valuation multiples than stocks deleted; thus, the performance gap observed is due to the value effect, and is a clear manifestation of index funds’ tendency to “buy high and sell low”.
Another source of underperformance for index funds is their exposure to stocks with the highest market capitalization. Several studies have proved that stocks with the highest market capitalization severely underperform the market in the long run. The following table collects data for such stocks (so-called “Top Dog”), relative to the G-8 countries, from 1982 to 2011, and classifies these stocks in 12 sectors. The results show that:
- on average the largest stock of each sector underperforms an equal-weighted index of its sector by 5.1% per year in a 10-year time horizon (40% compounded);
- on average the largest stock in each country underperforms its local stock market index by 4.7% per year in a 10-year time horizon (38% compounded);
- on average, the largest stock in the developed world lagged a global cap-weighted index by 10.5% per year in a 10-year time horizon (67% compounded), in addition to this, it has only a 5% probability of overperforming such index.
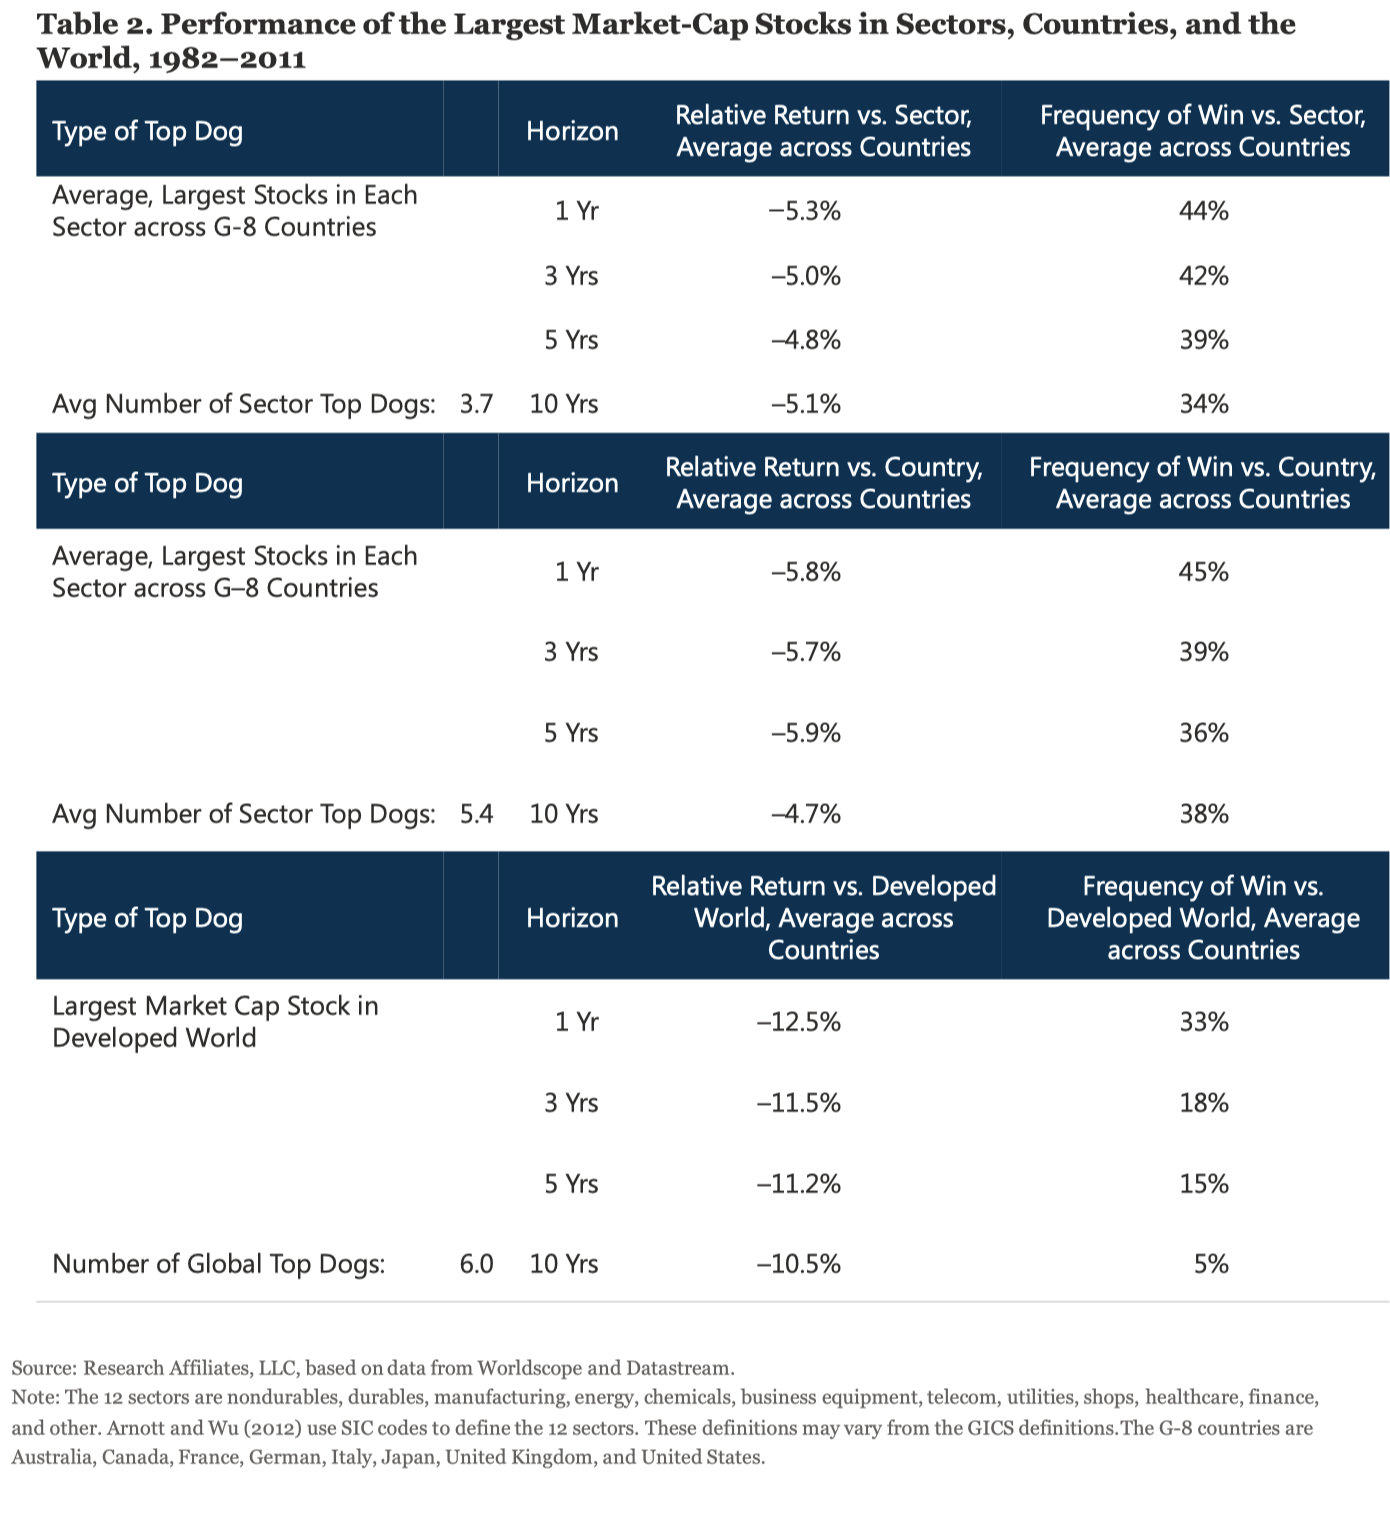
Source: Research Affiliates, Worldscope, Datastream
The following graphs show that the high exposure of cap-weighted portfolios to such stocks historically led them to significantly underperform a cap-weighted portfolio which excludes them. We can also notice that from 2010 the “Top Dogs” have performed incredibly well in an environment characterized by a significant overperformance of growth stocks with respect to value. We will examine this apparent paradigm shift later in the article.
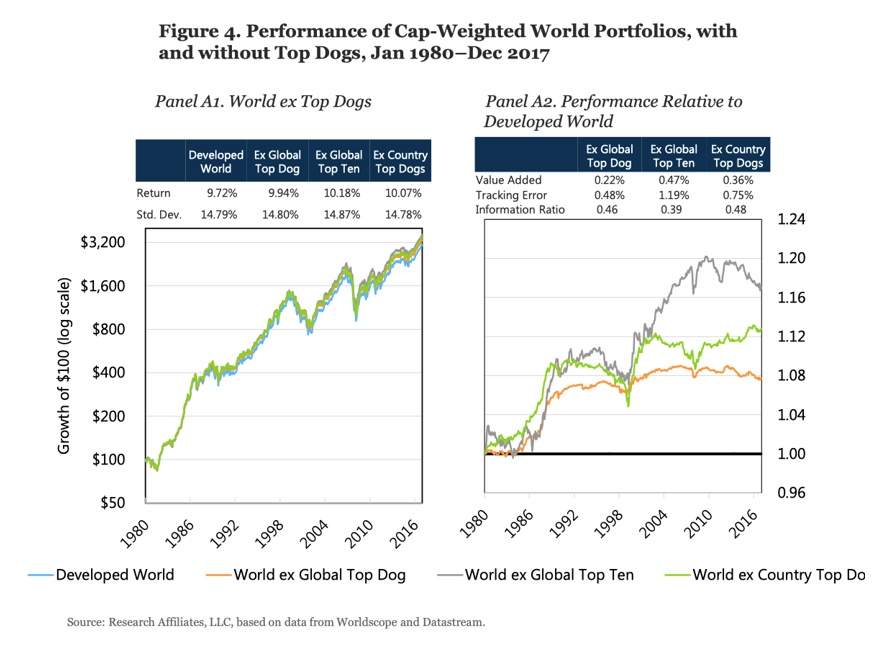
Source: Research Affiliates, Worldscope, Datastream
How smart is Smart beta?
The popularity of Smart beta has increased in recent years, with a number of large institutions offering products based on this investment style. The volume of assets under management in Smart beta ETFs has grown at a CAGR of 21.5% over the past five years, reaching $857bn at the end of 2019. However, in the last decade many of these strategies performed poorly, and some underperformed their respective indexes. For example, while the S&P 500 generated annualized net total return of 8.6% in the past five years (as to the end of February 2020), the S&P 500 Value index produced just 5.8% and the S&P 500 Quality index returned 6.9% (the Momentum variant, however, outperformed the benchmark by 1.2% on the annualized basis). These developments left disappointed investors questioning the viability of smart beta approach. We will examine several explanations for this underperformance and show that after revising unrealistic expectations and paying careful attention to risks, Smart beta investing still has potential.
In general, there are two components driving the performance of factor-based Smart beta strategies: the dedicated tilting of a portfolio towards certain factor premiums (such as size, value, momentum, or quality) and the periodic rebalancing to exploit price movements. Nevertheless, several studies (see for example Glushkov, 2015) show that after decomposing the realized performance into static and dynamic effects, the instances of outperformance can be largely attributed to the static factor exposure and not to the systematic, rule-based rebalancing. Moreover, Philips et al. (2015) find that the alternatively weighted indexes often show increased exposure to value companies and small-cap companies. Consequently, Smart beta strategies are at their core very similar to traditional factor investing with one important caveat: they are usually long-only.
Zooming in on factors
Generally, factor-based Smart beta strategies might either seek exposure to one or two factors, thereby targeting individual factor premia, or use a number of different factors which should provide investors with diversification benefits. Let us examine them in turn. First, it can be observed that the performance of traditional cap-weighted indices has been increasingly driven by large-cap technology stocks such as Facebook, Amazon or Netflix. This trend has only been corroborated during the COVID-19 crisis. Obviously, in such an environment the size factor (focusing on smaller stocks) has not been able to deliver returns expected by investors.
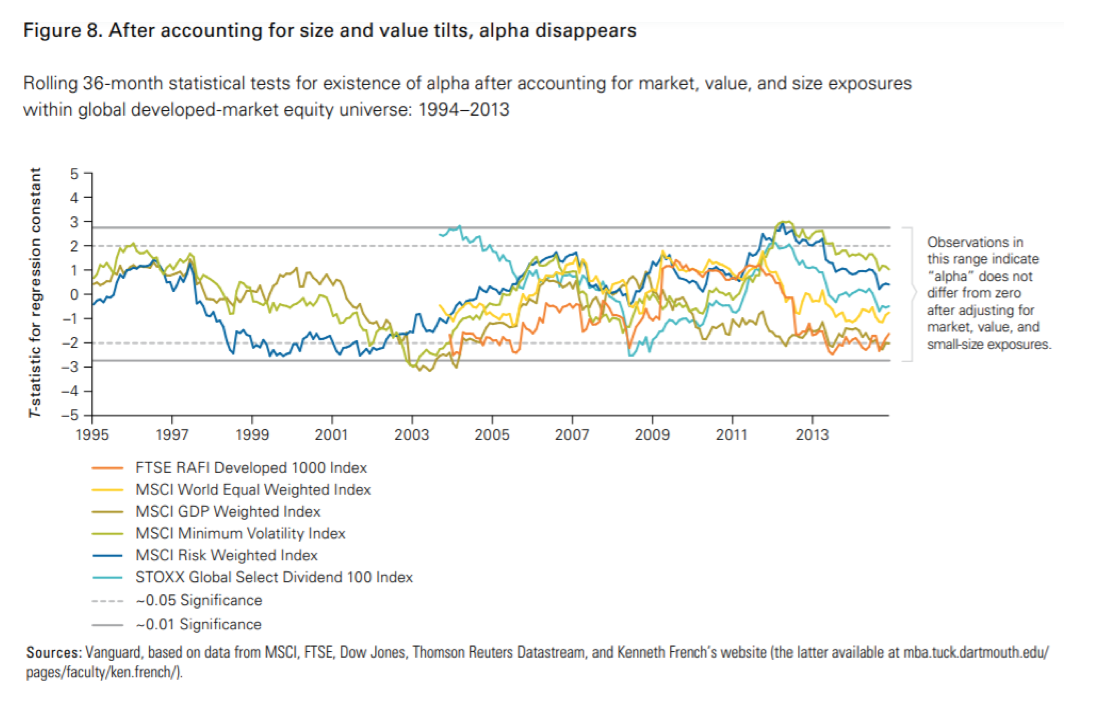
Source: Vanguard, based on data from MSCI, FTSE, Dow Jones, Reuters Datastream, and French’s Website
Further, there has been an intense debate regarding value investing – a long-standing and appraised strategy that involves a systematic investment in stocks with lower prices relative to their fundamentals. During the past decade, many value strategies have suffered, which led investors and academics to question the profitability of these approaches and even to suggest the death of value investing. Yet, this claim appears to be premature. There are several reasons illuminating the recent poor performance of the value factor.
Firstly, although there is no universally accepted way of assessing the intrinsic value of companies, one of the most widely used is the price-to-book ratio (P/B). Yet, the denominator of the P/B is sometimes understated, since investments in intangible assets such as R&D, IT or intellectual property, are often expensed rather that capitalized due to the application of conservative accounting policies. Since the U.S. corporate intangible investment rate is currently twice that of tangible investment rate, this can have substantial effects on valuation (Lev and Srivastava, 2019). Indeed, Arnott et al. (2019a) show that after adjusting for the uncapitalized portion of intangibles, the average annual return of the Fama-French HML (high-minus-low) factor would improve by 2.7% annually over the past 13 years. Hence, funds that overly rely on the P/B ratio may fail to properly identify value stocks.
Moreover, shifts in economic dynamics following the GFC, such as reduced bank lending and sluggish recovery of consumer demand, impaired the profitability of value stocks (growth stocks have been less impacted, since they generally exhibit different business models and have easy access to capital). These developments might have slowed down the mean reversion of value stocks, which is the premise for success of value investing strategies. Yet, it must be noted that the current value minus growth valuation spread is almost at its all-time widest (Arnott et al., 2019b). If we assume that the spread will not increase indefinitely and the mean reversion will eventually occur, value does offer an attractive upward potential.
Risks of multifactor investing
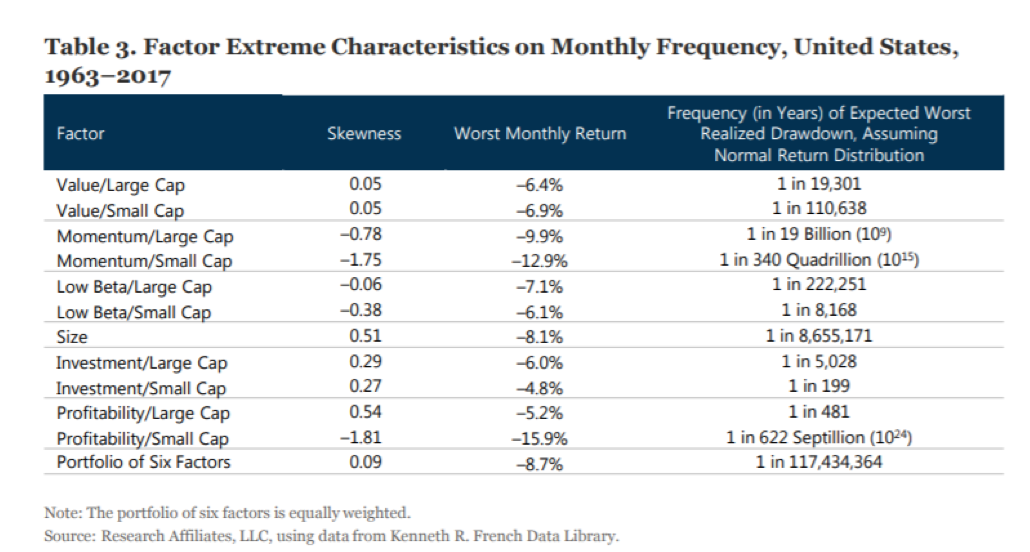
Next, we examine multifactor Smart beta strategies. These should allow investors to benefit from different factor premia without being overly exposed to the performance of individual factors. Indeed, data suggest that long-run correlations among factors tend to be fairly low. However, factor correlations are, in fact, time varying. In times of crises, even correlations among non- or negatively assets tend to increase, failing to provide enough diversification benefits. Moreover, investors’ perception of tail behaviour of factor strategies is often naïve, since it is based on normality assumption. In reality, factor returns are far from normally distributed. As illustrated by Kalesnik and Linnaianmaa (2018), the empirical occurrence of large negative returns is considerably greater than under normal distribution.
Source: Research Affiliates, French’s Data Library
Similarly, the authors examined the worst three historical drawdowns (i.e. peak-to-through declines) for each of the six factors analysed (value, momentum, low beta, investment, profitability). They found that in 83% of instances the magnitude of the drawdown was more severe than would have been expected under normal distribution. As a result, using naïve risk management tools can greatly underestimate the probability of extreme outcomes. Moreover, it is not unusual that these drawdowns last for years.
Further, the fact that performance of different factors deteriorates at times is nothing unexpected, since factors tend to be cyclical. Although investors should not overly rely on long-term averages because market betas of factors vary over time, on average, when markets move upwards, most factors do not do well. When markets fall, factors’ premia rise. The notable exception is the size factor, which tends to be positively correlated with the broad market (small-cap stocks often suffer by market downturns, as they experience liquidity issues and solvency concerns). Value, on the other hand, oftentimes delivers the best returns in times of economic recovery. Last years have been characterized by distinct bull market conditions, which are in general unfavourable for factor strategies, and thus shed some light on the recent performance.
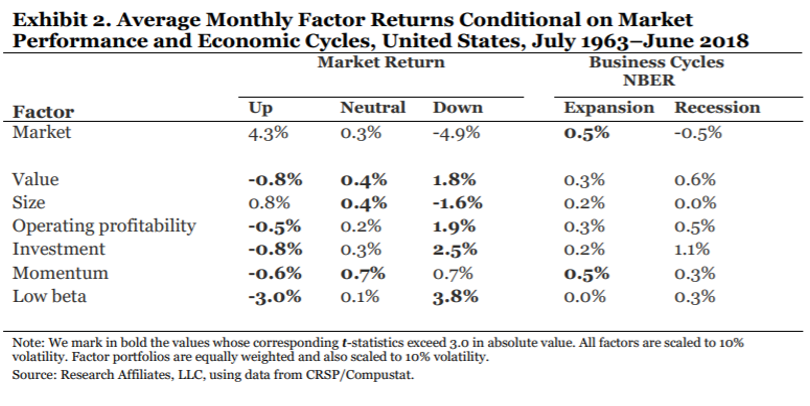 Source: Research Affiliates, CRSP, Compustat
Conclusion
Smart beta strategies build on passive index investing but propose alternative non-price-weighted methodologies. One of the most popular ones is weighting based on fundamentals. In spite of recent unsatisfactory performance of these funds, the existence of factor premia is well documented by numerous research studies and we do not believe that it should be dismissed. However, the risks embedded in Smart beta strategies built to enhance returns by tilting their factor exposure cannot be ignored. If investors recognize that (sometimes prolonged) periods of underperformance are to be expected, they are more likely to be disciplined at times of poor performance in order to be rewarded when the trend reverses. Smart beta is not a magic formula consistently beating the market, but for long-term oriented investors who understand the risks of the strategy, it is a useful addition to the investment portfolio.
Arnott, R. D. et al. (2013) ‘The surprising alpha from Malkiel’s monkey and upside-down strategies’, Journal of Portfolio Management. doi: 10.3905/jpm.2013.39.4.091.
Arnott, R. D. et al. (2019a) ‘Alice’s Adventures in Factorland: Three Blunders That Plague Factor Investing’, SSRN Electronic Journal. doi: 10.2139/ssrn.3331680.
Arnott, R. D. et al. (2019b) ‘Reports of Value’s Death May Be Greatly Exaggerated’, SSRN Electronic Journal. doi: 10.2139/ssrn.3488748.
Arnott, R. D.; Hsu, J. and Moore, P. (2005) ‘Fundamental indexation’, Financial Analysts Journal. doi: 10.2469/faj.v61.n2.2718.
Arnott, R. D.; Kalesnik, V. and Wu, L. (2018) ‘Buy High and Sell Low with Index Funds!’, Research Affiliates. Available at: https://www.researchaffiliates.com/en_us/publications/articles/674-buy-high-and-sell-low-with-index-funds.html
Chow, T. M. et al. (2011) ‘A survey of alternative equity index strategies’, Financial Analysts Journal. doi: 10.2469/faj.v67.n5.5.
Glushkov, D. (2015) ‘How Smart are “Smart Beta” ETFs? Analysis of Relative Performance and Factor Timing’, SSRN Electronic Journal. doi: 10.2139/ssrn.2594941.
Kalesnik, V. and Linnainmaa, J. (2018) ‘Ignored Risks of Factor Investing’, Research Affiliates. Available at: https://www.researchaffiliates.com/documents/Ignored%20Risks%20of%20Factor%20Investing.pdf
Lev, B. and Srivastava, A., 2019. Explaining the Demise of Value Investing. SSRN Electronic Journal. doi: 10.2139/ssrn.3442539
Philips, C. et al. (2015) ‘An evaluation of smart beta and other rules-based active strategies’, Vanguard Research. Available at: https://www.vanguard.com.hk/documents/smart-beta.pdf
Towers Watson (2013) ‘Understanding Smart Beta’, Report.


0 Comments