Introduction
Quantitative Easing is not a new economic phenomenon for most of the developed economies. Federal Reserve started its first Quantitative Easing program in November 2008 by purchasing $600 billion in mortgage-backed securities, before 2008 the Federal Reserve held between $700 billion and $800 billion of Treasury Notes within its balance sheet. European Central Bank, on the other hand, announced its QE program at the iconic Jacksons Hole Speech (22 January 2015) of Mario Draghi, within the program ECB would purchase $60 billion per month of government bonds from Euro Area countries, agencies and European institutions. However, there was another central bank that had a substantially larger quantitative easing program way earlier than its European and American counterparties: Bank of Japan.
Source: TradingEconomics.com
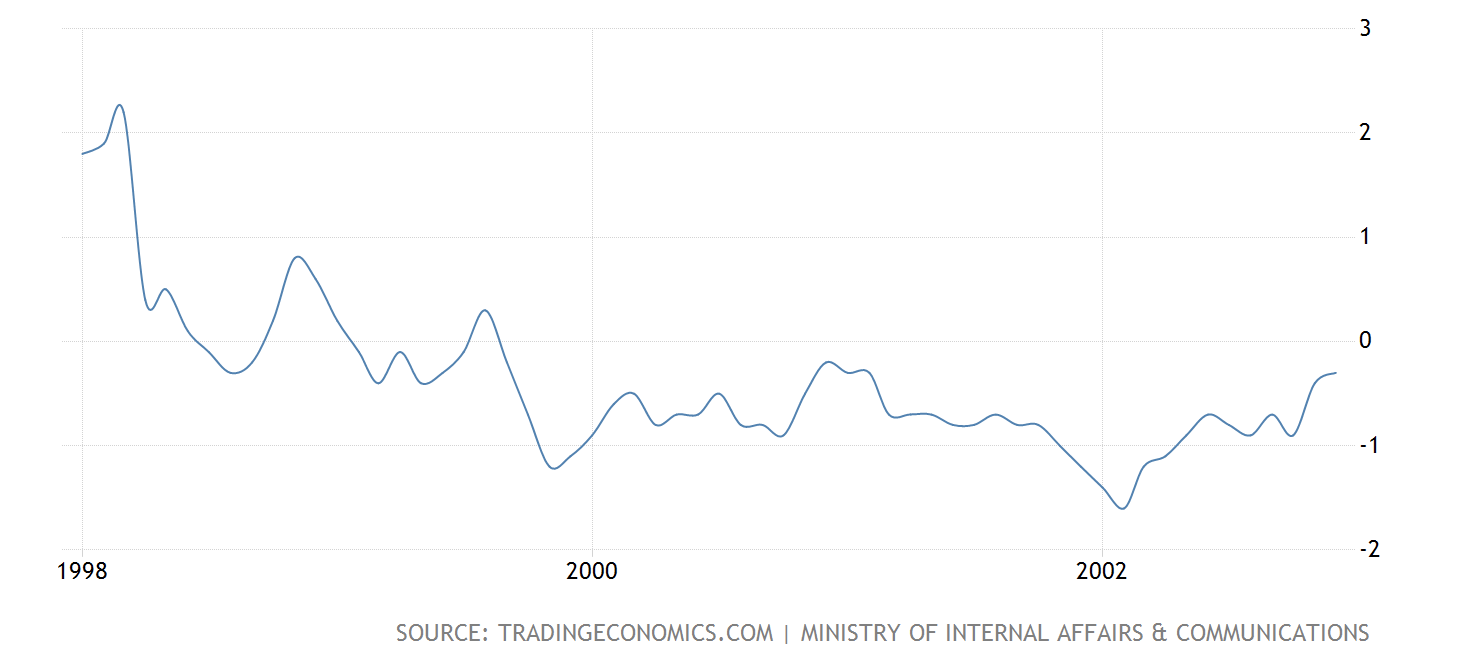
Japanese inflation rate between 1998-2003, Source: Tradingeconomics, Ministry of Internal Affairs & Communications
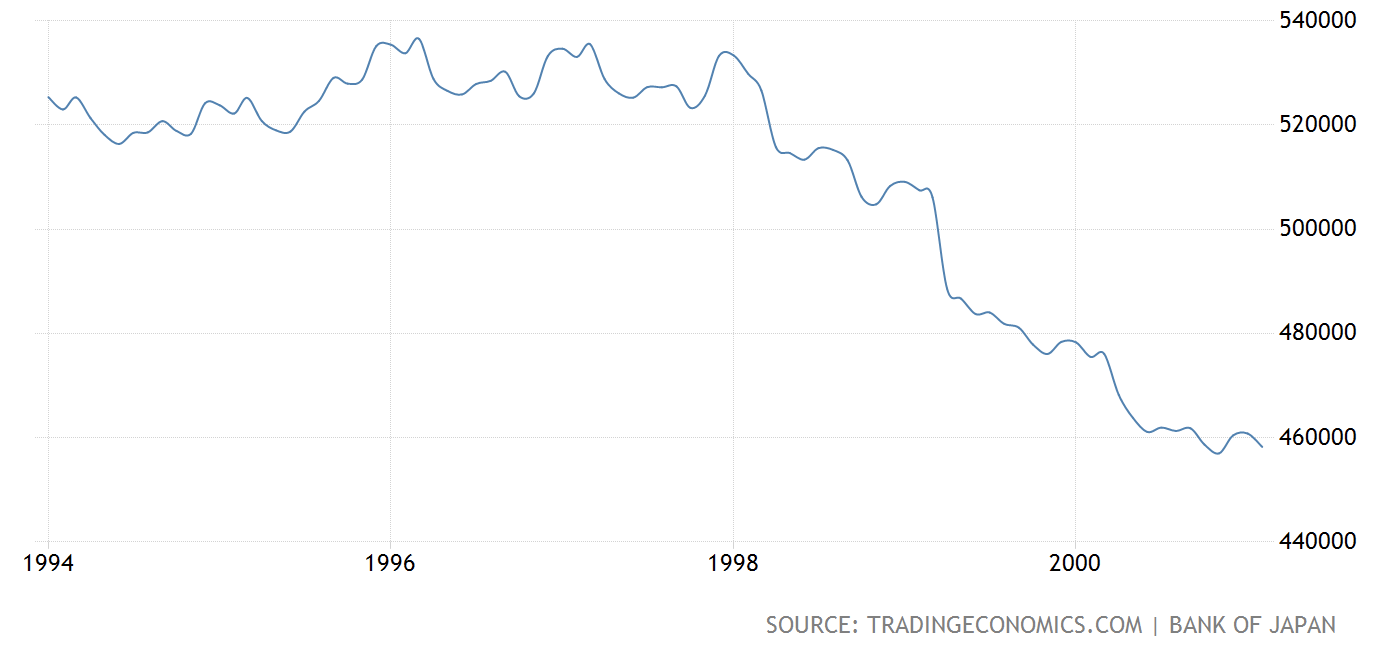
Japan Loans to Private Sector(1994-March 19 2001), Source: Tradingeconomics, Bank of Japan
As can be seen above, Japan in the late 1990s and early 2000s was suffering from deflation and negative loan growth. The conventional monetary policy was already at the most dovish point possible with rates at the zero lower bound. The Bank of Japan finally decided to become the first central bank to resort to the unconventional monetary policy tool of Quantitative Easing. Under the program announced on March 19 2001 BOJ effectively increased commercial banks’ target for “current account balances”, this measure had an expected effect of reducing the overnight call rate of BOJ to 0. On top of increasing current account balance targets, BOJ tripled its monthly target of long term Japanese Government Bond (JGB) purchases from 400 billion JPY to 1.2 trillion JPY.
Japanese Way of QE
The journey that Japan started by lowering the current account balance targets of commercial banks and by increasing monthly purchases of long term JGBs have evolved a lot since then. By September 30th BOJ held commercial papers, commercial bonds, pecuniary trusts that allow BOJ to hold stocks as trust property and pecuniary trusts that allow BOJ to hold Japanese REITs as trust property. When compared to its European and American counterparts BOJ has been purchasing more assets by quantity as well as can be seen from the graph below.
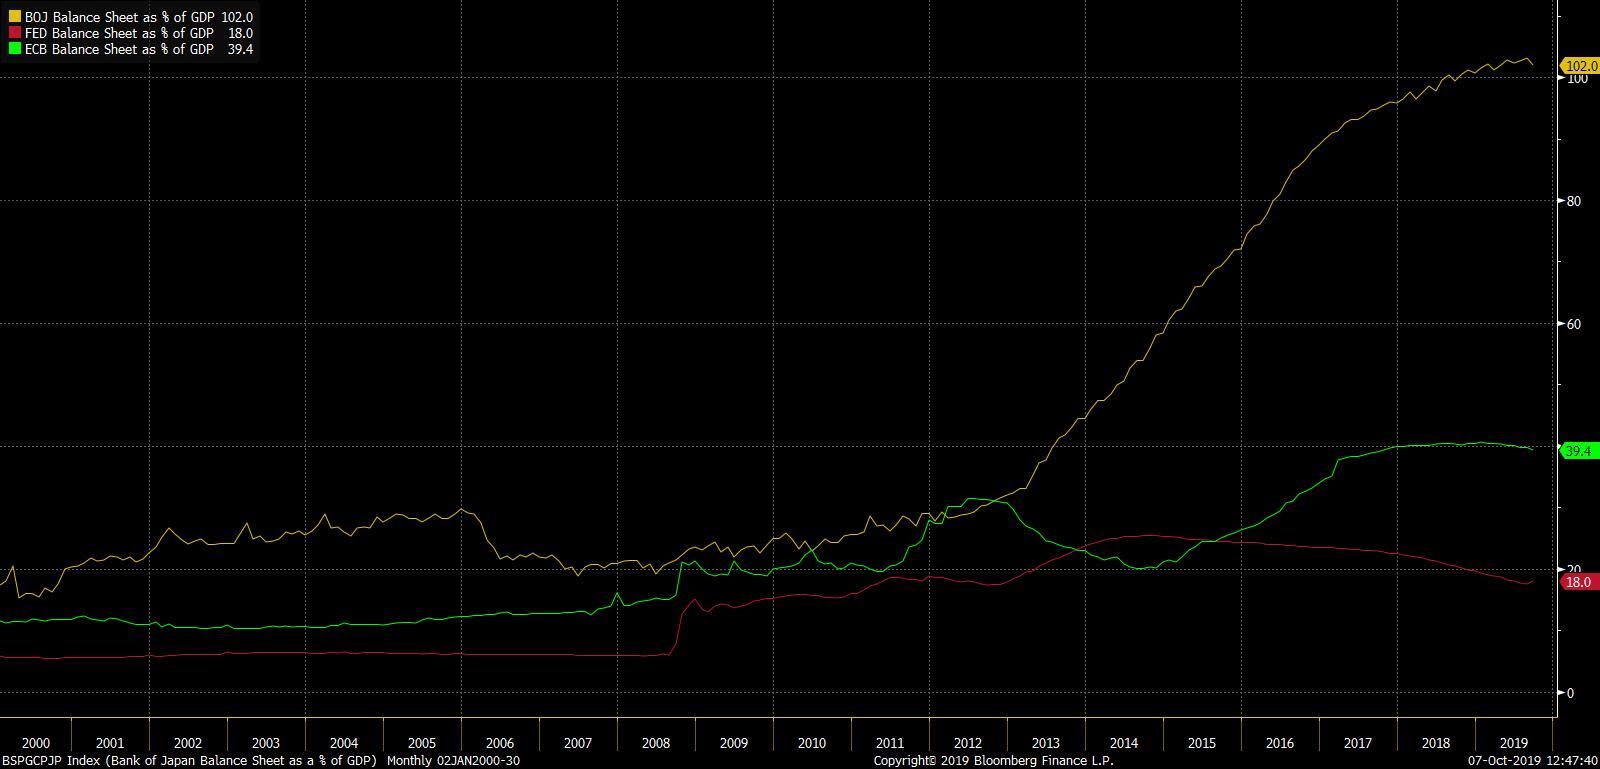
Source: Bloomberg
| Bank of Japan Balance Sheet (in Billions) | JPY | USD |
| Gold | 441,30 | 4,09 |
| Cash | 228,40 | 2,12 |
| Government Securities | 479681 | 4448,08 |
|
469382,10 | 4352,58 |
|
10298,90 | 95,50 |
| Commercial Paper | 2191,70 | 20,32 |
| Corporate Bonds | 3142,90 | 29,14 |
| Pecuniary Trusts – Stocks | 806,80 | 7,48 |
| Pecuniary Trusts – Index-linked ETF | 27469,50 | 254,72 |
| Pecuniary Trusts – Real Estate | 528,20 | 4,90 |
| Outstanding Loans | 47800,60 | 443,25 |
| Foreign Currency | 6709,70 | 62,22 |
| Deposits With Agents | 14 | 0,13 |
| Other Assets | 744,20 | 6,90 |
The BOJ way of QE was bigger than the QE programs of both ECB and FED (with respect to GDP), BOJ was also buying REITs, equities which ECB and FED never bought, at least for now. But the Japanese way of QE’s unique aspects are not just these, BOJ in 2016 announced what it calls a Yield Curve Control program (YCC). YCC is different from outright QE as in YCC a central bank defines an upper bound for long-maturity yields and if the market challenges that level of yield the central bank commits to buy whatever amount of bonds necessary to not let yield surpass the defined upper limit. BOJ in 2016 announced that it would peg yields of 10-year JGBs to around zero per cent to combat persistently low inflation. To hit this yield BOJ purchases any amount of outstanding bonds to keep yields within the target.
YCC and the biggest QE program that a developed economy central bank committed itself to did have market consequences. Japan soon met the world of extremely low yields and flat yield curves. The irony of the Japanese version of QE lays behind its objectives and effects: the objective was to boost loan growth to the private sector while the massive QE program played a role in the difficulties that the Japanese Financial Sector faced. The flat yield curve of Japan made its financial sector suffer as pensions struggled to find returns in the fixed income market which was dominated by the flat yield curve and the heavy QE of BOJ.
BOJ Revisiting Its QE Policy
In our opinion, QE can’t meet its objective of reviving growth and facilitating lending to the private sector without a healthily functioning banking sector. And, a healthy banking sector requires a yield curve at which traditional banking is reasonably profitable. Japan’s QE operations were somewhat more reasonable by 2016 as there wasn’t a major trend that flattened yield curves and lowered yields on almost all maturities. But as global markets are currently in a global trend that puts downward pressures on global yields and that creates flat and even inverted yield curves, we believe that it’s a time for BOJ to review its QE policy and BOJ has done so as well.
BOJ releases a document they call “Outline of Outright Purchases of Japanese Government Securities” by the end of each month. At this document, they announce the lower and upper limits to their purchases of JGBs of different maturities and types. At the September 30 release, BOJ announced that it would purchase between 0 and 50 Billion JPY of coupon JGBs with maturities more than 25 years. This marked an important shift in BOJ policy as the previous release had guided a purchase of at least 10 Billion JPY with a cap of 100 Billion JPY for the same maturities.
It is also noteworthy that BOJ has also trimmed its 3-5 years, 5-10 years,10-25 years purchasing guidance as well while increasing its guidance for 1-3 years. Clearly, markets saw this as an attempt of BOJ to steepen the yield curve that it has flattened with years massive QE. This guidance was followed with a 10-year JGB auction that had a wide tail (the gap between the lowest and accepted prices) of 0.29, JGB auction tails are usually between 0.01-0.03 and a tail of 0.29 was the highest since March 2015. Bid to cover ratio, which is another major demand signal fell from 3.60 in the previous September auction to 3.42. As a result of the relatively weak demand for JGBs in the auction and BOJ’s hint that it might trim its long maturity purchases JGB 10-year yields jumped 6.5 basis points hitting -0.160% on October 1.
While we agree with the market view that BOJ is strongly hinting towards a cut in long-maturity purchases, we think that the real data that we should analyze is the 2s/30s or the 2s/10s spreads in JGBs. As these measures can better show us how successful BOJ has been to restore its yield curve.
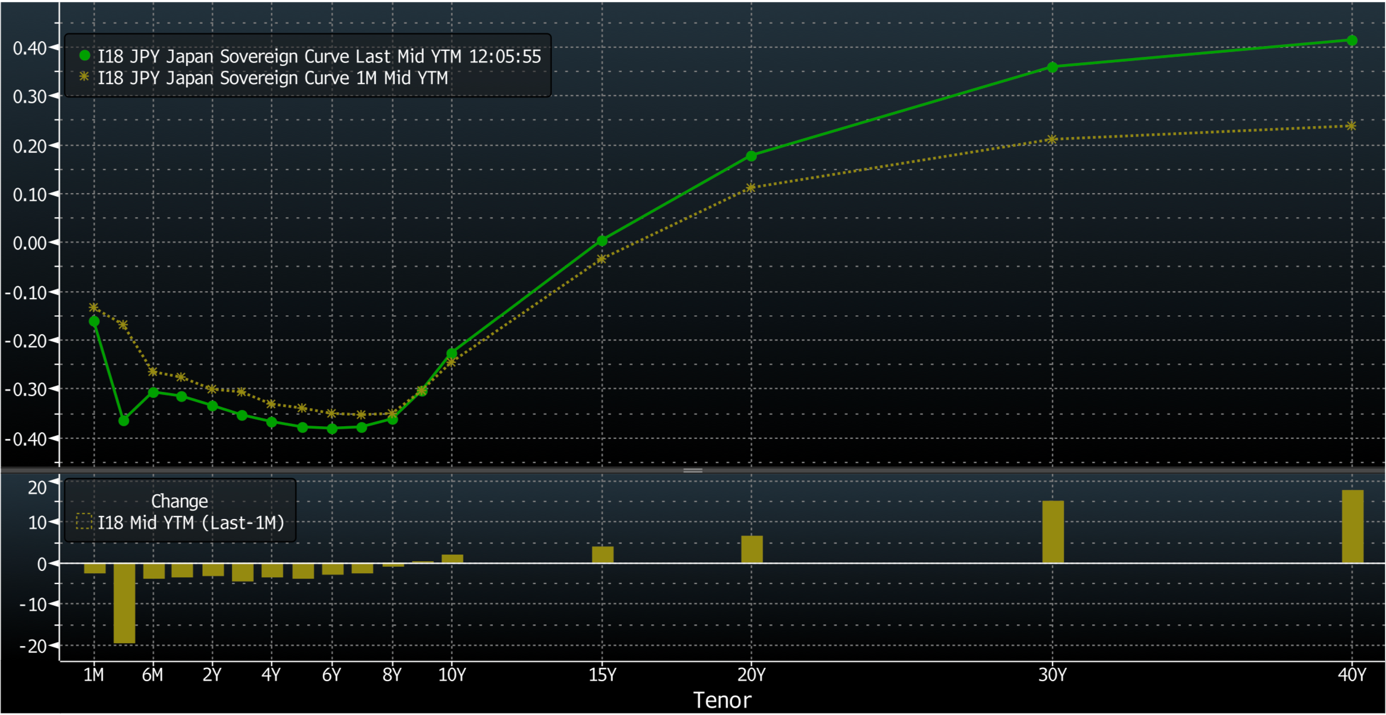
Source: Bloomberg, as of 7 September 2019
The uptick in 10-20-30-40 years yields and a downward pressure in all other maturities are noteworthy. If BOJ commits itself to this policy to steepen the yield curve we believe that this can increase financial sector profitability. However, just like the markets, we have reservations about whether BOJ can achieve this target.
- Can a central bank fight duration hungry traders?: Recent market trends in the fixed income world have shown us how traders can become duration hungry, the quick downward trend in global yields after the July 30 FOMC meeting can demonstrate this. Building on this, if recession fears strengthen or if anything that can push traders to go long duration how will BOJ defend the rotation in the yield curve?
- Global effects: In a world where capital can freely move within markets how will BOJ steepen the yield curve if global yields continue to decline especially in a bull-flattening way?
- Limited policy tools: An effective steepening operation can be relatively achieved by a central bank that is willing to unload long-maturity bonds that it has in its balance sheet. As long maturity unloads would increase the long term yields a central bank could buy short term securities thus widening the 2s/10s and 2s/30s spreads. However, we don’t find the idea that BOJ can unload even a tiny fraction of its long maturity holdings realistic. Such a move would appreciate JPY and that could create an even more deflationary environment, the kind of world BOJ hates.
- Yield Curve Control Brings a Glass Ceiling: BOJ commits to keep the 10-year yield around zero percent and we believe that such a commitment creates a glass ceiling over how much and how BOJ can widen the JGB spreads. As keeping the already existent YCC commitment is vital to BOJ, we believe that committing to a new goal of spread targeting would be quite challenging to succeed.
Effects of the New Policy:
We believe that absolute steeping in the Japanese yield curve is not easy to achieve with BOJ’s toolkit considering the global fixed income market trends, BOJ’s YCC commitment, and market dynamics. However, it is important to recognize BOJ as a fundamental driver of the JGB market considering the depth of the BOJ balance sheet. Therefore, we believe that BOJ will not totally achieve its possible goal to steepen the yield curve but relative adjustments in the yield curve as the market priced recently can be sustained.
A Possible Yield Curve Trade?: Be at a central bank operation, be it expected market data or market events anything considering a trend in a country’s yield curve leads to a common fixed income trade: trading the yield curve. We must recognize that a steepening rotation has already started in the Japanese Yield Curve since the beginning of September. This is mostly visible in the 2s/30s spread which widened considerably after August 30. 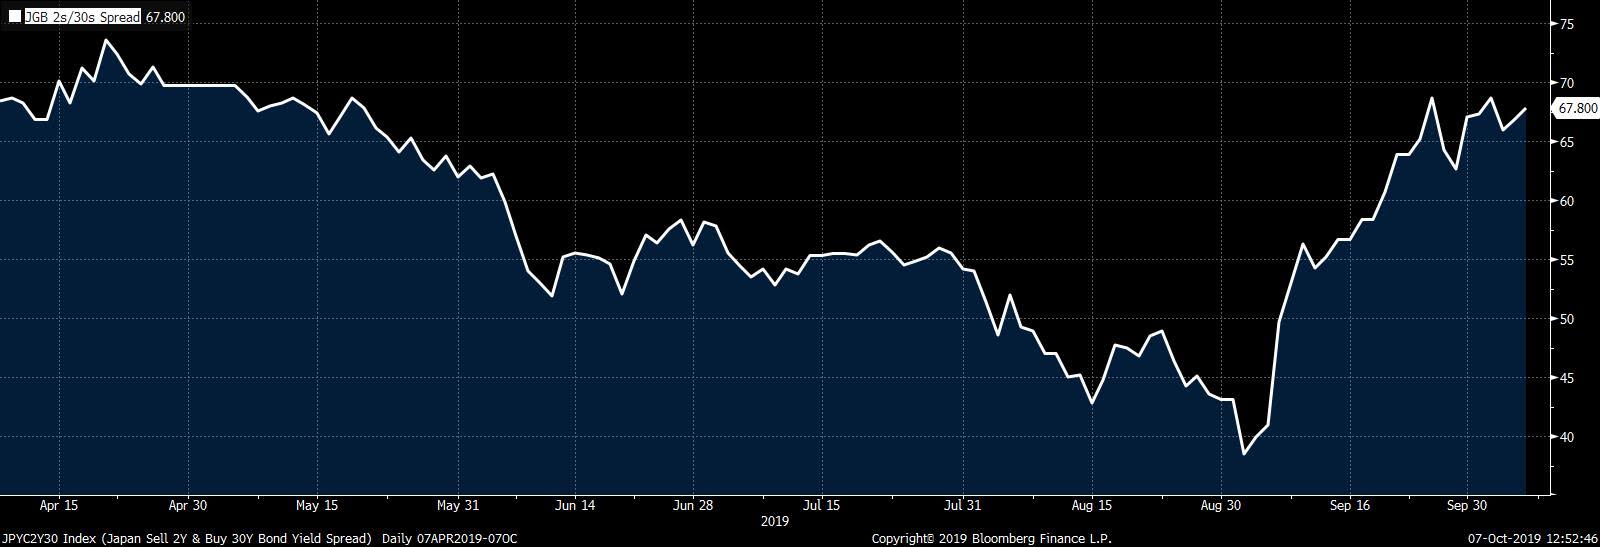
Source: Bloomberg
The question to consider right now obviously is can Japan steepen its yield curve even beyond this? Considering the long term factors that have caused Japan to have such a yield curve, we do not anticipate a long term repricing just from the trimming of QE amounts. However, on a relative basis, we do think that Japan, when compared to other central banks and especially ECB, can run a relatively steeper yield curve due to the acknowledgement and policy changes from of the central bank. This can happen both on 2s/10s and 2s/30s but we favor to look at the 2s/30s as JGBs with maturities over 25 years has seen a bigger rotation in the “Outline of Outright JGB Purchases” document. 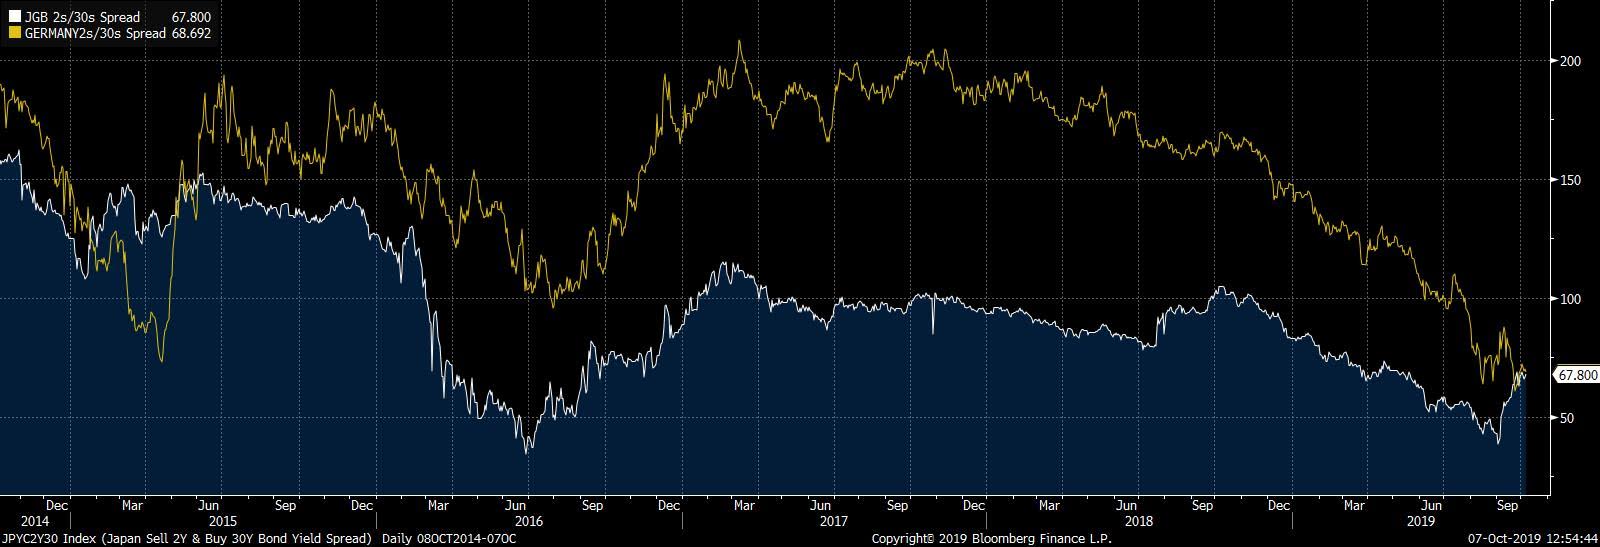

Source: Bloomberg
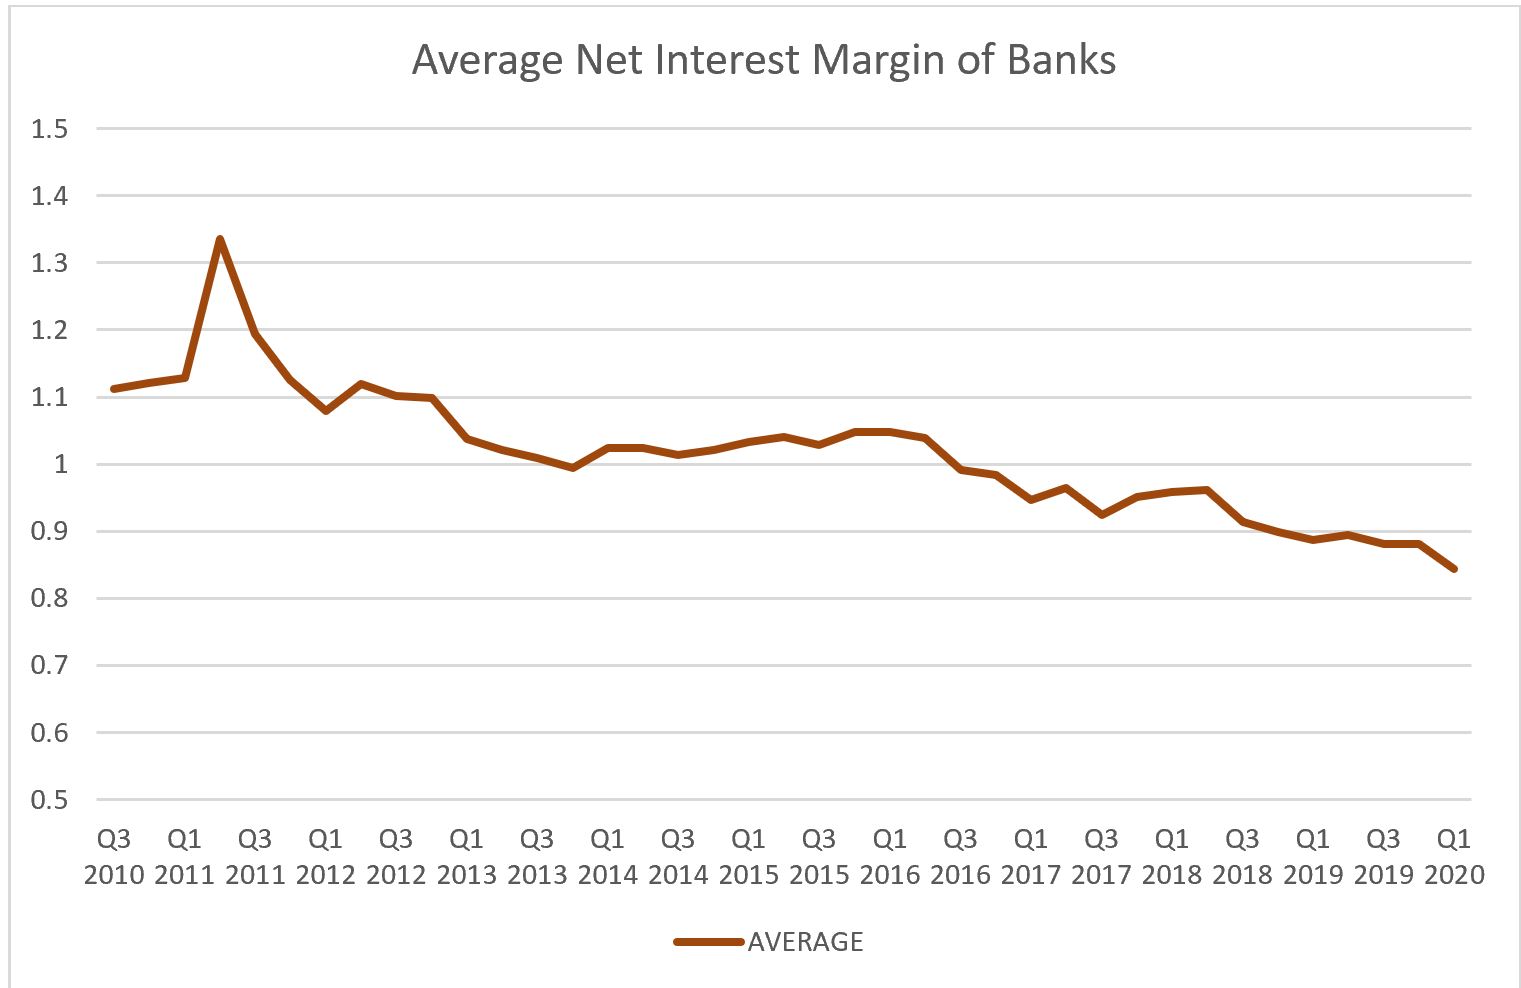
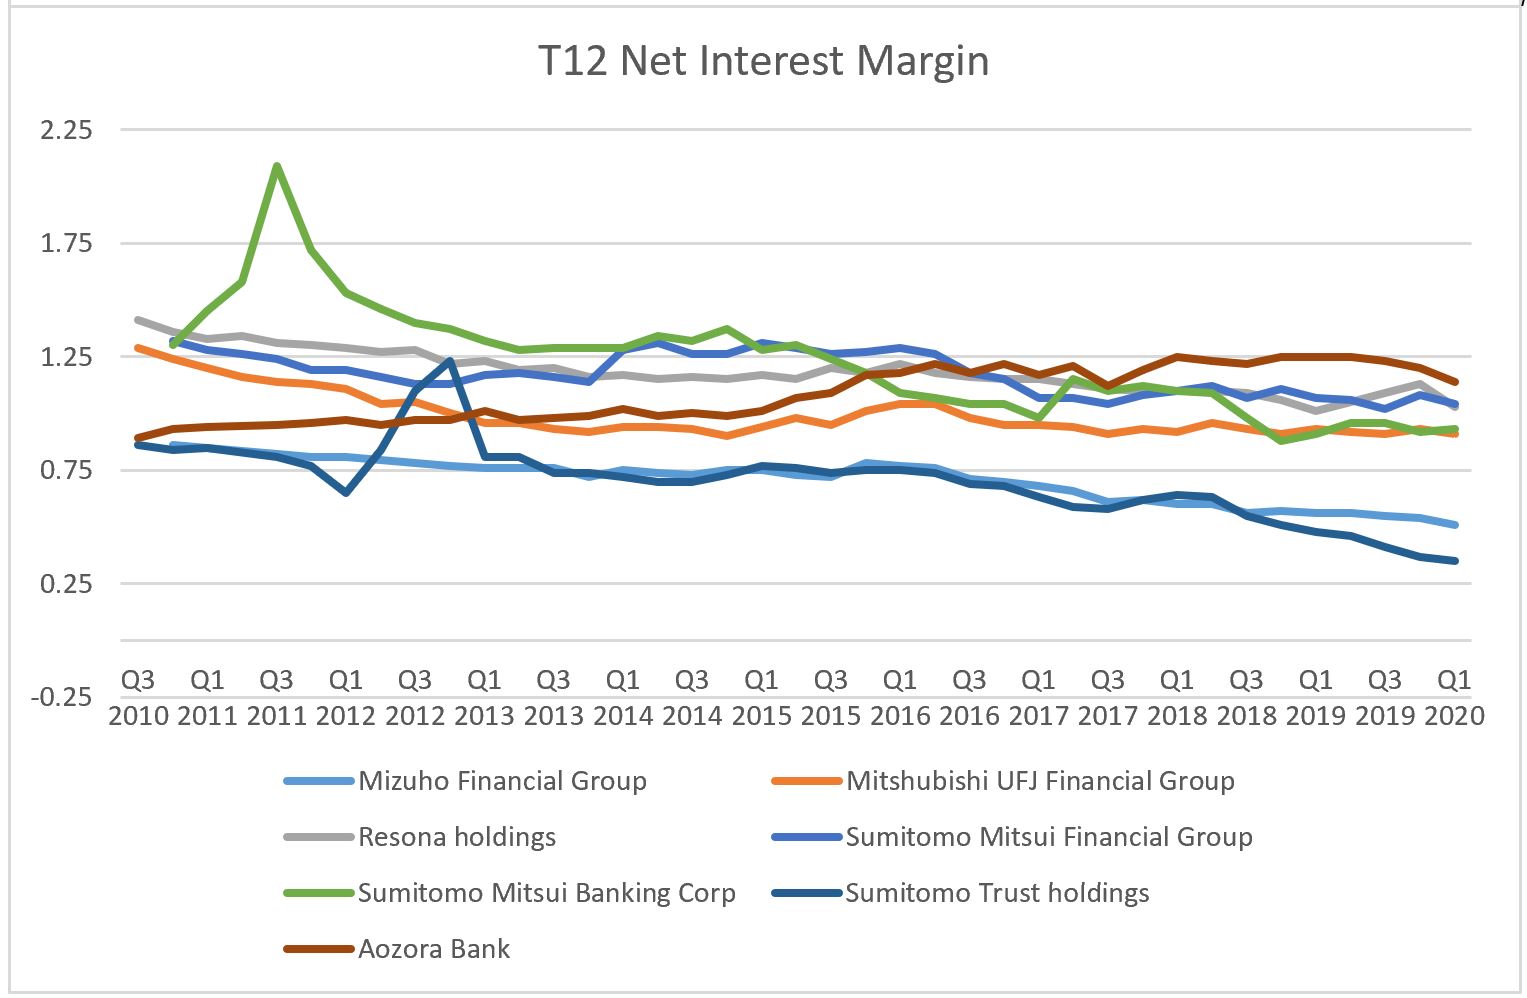
Banking Trade?: Japan’s banking sector has suffered an unfavorable yield curve with a direct effect on their net interest margins. However, we still do not see an absolute trade opportunity here as well. Our logic is quite similar to our yield curve trading logic: global trends, BOJ’s internal limitations might not allow a yield curve that could make Japanese Banks thrive. On the other hand, it is a reality that Japan is currently not alone as a country where banking is unprofitable. With BOJ’s acknowledgment that an economy will not succeed with failing banks we believe that this policy can be a good starting point. It is important to see the downward trend in Japanese Banks’ negatively growing net interest margins. We think that with a steepness aware BOJ the trend might not be as heavy as it has been during the last years. Hence, we believe that there might be a relative value trade between European Banks and Japanese Banks while highlighting the latest tiering policy of ECB.
Should ECB Follow BOJ Footprints
The previous graph we have presented on the convergence of both German and Japanese spreads show an important story to European policymakers. We have previously discussed the convergence of European and Japanese dynamics in our Japanification of Europe article and we suggest you re-visit for an in-depth analysis. We believe that QE is like a medication that has serious side-effects on the banking and financial sectors. Japan has seen the side effects of QE in its banking sector’s net interest margins and similar effects are evident in the European banking sector as well. That being said, ECB shouldn’t follow BOJ’s steps right away. The conditions at the two markets are still somewhat different. ECB will start its QE in the upcoming months, meaning that such trimming can be premature and can affect the goals of QE.
Also, BOJ has an easier market to operate in as there are no internal fractions within the Japanese financial sector such as the ones in the European Financial Sector. This makes guidance and goal setting way easier for BOJ. As we discussed in another previous article ECB’s tiering policy is a new tool that ECB adopted to help banks that struggle in the low rates environment. The effects of tiering should be observed while also monitoring the effects of BOJ’s trimmings. If trimmings in QE prove to be quite beneficial to banks such policy can be implemented by ECB as well but of course with right modifications to “Europeanize” the policy.
Conclusions
Bank of Japan was the first central bank to use QE and its dosage was the largest one when compared to their economy’s size. Japanese QE was also comprehensive, including equities and yes even REITs. However, the side effects of QE did appear in the Japanese Economy. Banks were one of the major victims of the new low rates and flat yield curve era and they suffered from the hostile yield curve which destroyed their net interest margins. BOJ is now trimming its purchases on the longer maturities of the yield curve to ideally create some room for bank profitability. We believe that a massive steepening is not easy to achieve considering the global rates outlook however relative corrections happened and they can be sustainable with commitment from BOJ. Analyzing these we believe that there can be two relative value trades in this area: one from the Japanese and European yield curves and one from the Japanese and European Financial Sectors. Both trades have to recognize the global trends in the fixed income and rates world while the financial sector trade should also be analyzed as a relative value play between tiering and the BOJ’s trimming policy.
All the views expressed are opinions of Bocconi Students Investment Club members and can in no way be associated with Bocconi University. All the financial recommendations offered are for educational purposes only. Bocconi Students Investment Club declines any responsibility for eventual losses you may incur implementing all or part of the ideas contained in this website. The Bocconi Students Investment Club is not authorised to give investment advice. Information, opinions and estimates contained in this report reflect a judgment at its original date of publication by Bocconi Students Investment Club and are subject to change without notice. The price, value of and income from any of the securities or financial instruments mentioned in this report can fall as well as rise. Bocconi Students Investment Club does not receive compensation and has no business relationship with any mentioned company.


0 Comments