An Introduction to Momentum Strategies
In this article we aim to develop a cross-sectional option returns momentum strategy in which we trade the best performing options based on their past returns. This strategy aims to capture both movement in the underlying stock as well as different movements in the volatility term structure of the underlying stock.
Momentum trading is a strategy that aims to benefit from a continuation of a preexisting trend, with momentum being a phenomena in which assets that have performed better than peers continuing to outperform them on average, and assets that have previously performed poorly, will tend to underperform their peers on aggregate.
The history of momentum trading
Although Academic research into momentum trading dates back to early 1990s with Jegadeesh and Titman (1993), Asness (1994), there still remains debate around momentum trading. There are still wrongful arguments made around momentum being a factor that is too “small and sporadic”, mainly works on the short-side, or that it only works in small cap stocks by opponents of the strategy. It has also been argued that momentum would be best implemented as a screen not as a factor. Momentum Investing has been shown to be out-of-sample robust over time periods -predating a lot of modern exchanges- in individual stocks across different countries, for various asset classes such as equities, commodities, fixed income, and currencies. The return premium has been shown to be existent in the time period between 1801 and 2012, which equates to 212 years, in U.S. equities, to be evident U.K. equity markets in the Victorian age, and across most continents. This means that this evidence precedes research into financial economics as well as the existence of computers for signal creation. This means that momentum’s robustness has been shown to be considerably stable with evidence thereof across extended periods of time, this does not equate to a lack of relative underperformance of this strategy for periods or no periods of extreme outperformance.
Albeit certainly not being the first momentum trader to have existed, Richard Driehaus is perceived by many as the “father” of momentum trading due to his early on implementation of this strategy at Driehaus Capital Management, which reportedly delivered 30% compounded annual return from 1980 until 1992. A vast amount of techniques that Driehaus employed have become the foundation of modern momentum investing. In Schwager’s The New Market Wizards he stated:
“That means buying stocks that have already had good moves and have high relative strength – that is, stocks in demand by other investors. I would much rather invest in a stock that’s increasing in price and take the risk that it may begin to decline than invest in a stock that’s already in a decline and try to guess when it will turn around.”
Regarding the discussion that momentum only works for short-side, Cliff Asness analysed Kenneth French’s momentum factor (UMD) in “Fact, Fiction and Momentum Investing” (C Asness, 2014) and by looking at the alphas of the long and short portfolios separately showed that the short positions only contributed 5.1% to UMD while the long positions contributed 5.5%. This highlights that momentum can be profitable with a long only portfolio as well. Trading costs have also been showed to be lower than previously expected.
The existence of momentum across asset classes
In Commodity markets, academic research has shown momentum to be profitable with 9.38% average annual returns and by analysing the constituents of the long-short portfolios, research reveals that the long portfolios mainly consist of backwardated contracts and the short portfolios of cotangoed contracts. In foreign exchange markets, cross-sectional momentum strategies have been shown to create alphas up to 10% per year between winner and loser currencies (L Menkhoff, 2011). Cross-sectional currency momentum also exhibits different characteristics when compared to carry trades, and interesting enough the returns are mainly driven by high country risks and are in general not dependant on monetary regimes, currency interventions, or capital account controls. Momentum returns in credit from the quote-based databases have been shown to be driven by the winners, whilst losers are driving momentum returns in the trade-based data due to being more actively traded. Overall, bond momentum has been shown to be robust with regards to risk, transaction costs, and liquidity, with returns of this strategy in corporate bonds being significant in stable credit regimes.
Option momentum
Option momentum has been shown to have significant returns after controlling for implied volatility and other factors. In his paper “Option Momentum” SL Heston et al, computed the monthly returns on at-the-money straddles on individual equities and then showed that options with relative high historical returns tend to outperform options with low historical returns for 6 to 36 months. They also showed this phenomenon to be robust for out-the-money options as well as delta hedging and showed the strategy has no long-run reversal following option return continuation. The delta-neutral straddles were constructed using equal positions of puts and calls with same maturity and strike price to set straddle’s overall delta to zero to make the performance of the portfolio nearly unrelated to momentum in the underlying stocks. The pre-cost Sharpe ratio was shown to be around three times of the cross-sectional momentum strategy for stocks. One-month return reversal over the following month were also shown but no long-term reversal with momentum being stale over every subsample in most subgroups that were based on firm size, option liquidity and credit rating. The short-term reversal is consistent with pre existing literature relating to order imbalances with positive order imbalances shown to predict low future returns and daily option return reversals or alternatively strong recent option returns resulting in reduced capital of volatility sellers resulting in stronger negative risk premia.
Cross sectional momentum was shown to have similar returns to “time series momentum”, with options displaying momentum at industry level and in factor portfolios as with equities. In contrast to cross-sectional momentum, “time series momentum” does not pass pairwise spanning tree test. The lack of long-run reversal points to no delayed overreaction taking place as well as the lack of crash risk and or negative skew in the returns points to an unlikely compensation for those risks. The paper also does not find sufficient evidence to produce momentum effect for either market underreaction or time-varying risk premia by analysing loadings on market, volatility, and jump risk factors.
Methodology
For running our implementation of the strategy we used option data from OptionMetrics between 2016 and 2020, for both puts and calls of Nasdaq100 stocks. The Nasdaq100 was chosen for the availability as well as the stronger liquidity of options on aggregate due to the individual equities having large capitalizations vs liquidity of options of small cap equities. For our signal creation we decided to use a training timeframe of 3 months, meaning that we separated the dataframe into quarters for each year for the use of the selection of the options to trade.
For signal creation we at first selected at-the-money options for every ticker and every available expiry date as follows. We specifically chose the closest to at-the-money options by minimizing the absolute difference between the absolute value of the option delta and -0.5. Then, the absolute value of the option delta was taken in order to cut down computational cost of having to check whether the option was a put or a call beforehand. At-the-money options were selected as they have the greatest liquidity and thus have the lowest transaction costs which is beneficial for the returns of the strategy as well as scalability. We made a distinction between expiration dates for the signal creation instead of choosing options that were all going to expire at the end of the holding period, meaning they had a maturity of 6 months, due to wanting to be able to capture movements in the volatility term structure of the individual equities.
For each of the then selected at-the-money options, with puts and calls being treated separately, we computed their respective return momentums by averaging the log return of each selected option over the time span of the training set. The individual return momentums were then ordered by percentiles and the 95th percentile of options received a positive signal whilst the others did not. The 95th percentile was selected for not being overly restrictive on the highest momentum compared to a 99th percentile and not overly loose. Afterwards we evaluated the robustness of the strategy by also running the strategy using the 90th percentile and the 99th.
For each of the options that received a positive signal, we then selected an option equivalent in terms of expiration date and ticker but that was at-the-money. As one would expect the options with strong returns momentum to be in-the-money at the time the formation period has ended, the need arises to select at-the-money options with otherwise similar characteristics as you would otherwise also pay for the amount the option is in-the-money making the returns of the strategy worse. This is due to the price of a far in-the-money option compared to an at-the-money option being far more expensive due to their large intrinsic value. In theory for an option where you would expect strong outperformance to persist, you would witness a similar absolute return in the option if it were in-the-money or at-the-money at time of purchase, which would lead to a greater percentage return of the at-the-money option and therefore of the strategy as well as risking less capital.
For computing the performance of the strategy we tested it on out-of-sample data for each considered period, which was the same as the initial data obtained before the partioning of the training sets. We ensured it was out-of-sample by entering the positions on the trading date following the last trading date used in the training set, and then tested the strategy on the three month holding period following it. For the performance of the strategy we computed the sharpe and the sortino ratio as well as the return. Our approach regarding trading costs for this article was to take our entry into the position as the best offer for each option and the closing price of the position was the best bid of each option, whilst not being completely realistic in the sense that you would be able to execute at best bid-offer for every position. This assumption is still reasonable enough to be used to represent trading costs, especially considering literature mentioned that trading costs did not have too major of an impact on the performance on the strategy as well as the low frequency of trades being initiated with a holding period of 3 months.
Performance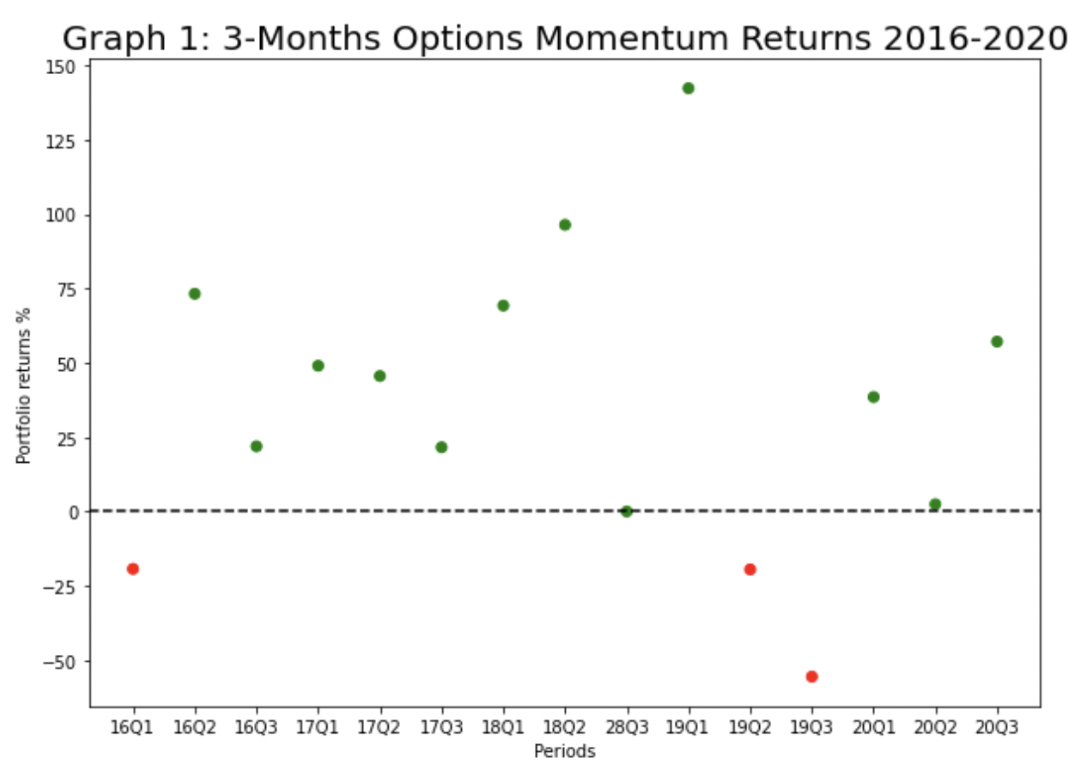 Graph 1, Source: BSIC
The data in Graph 1, each period represents the average return of the portfolio of options selected for each period of 3 months between 2016 and end of 2020. The performance of the strategy for each period is shown in Graph 1 while the overall expected return of the strategy taken as the average of returns of the traded periods was +33.3% while the strategy delivered a cumulative return of 18.4x over the 5 years period. The strategy was back tested on 14 periods between 2015 and 2020 and resulted in an average return of 33.3%, a Sharpe ratio of 0.19, and a Sortino ratio of 0.97 with a 95th percentile selection. I conducted robustness checks with the 90th percentile and the 99th. A 90th percentile gave an average return of 22.58%, an average Sharpe ratio of 0.112, an average Sortino ratio of 0.69%; the 99th percentile when tested was too restrictive.
Sources:
- Currency Momentum Strategies – (L Menkhoff, 2011)
- Momentum strategies in commodity futures markets – (J Miffre, 2007)
- Momentum in Corporate Bond Returns – (G Jostova, 2010)
- Fact, Fiction and Momentum Investing – (C Asness, 2014)
- Option Momentum – (SL Heston, 2023)


0 Comments