Introduction
Economic indicators are statistical data points and metrics that provide insights into the overall health and performance of an economy. These indicators help economists, policymakers, businesses, and investors assess and understand various aspects of economic activity. Economists and analysts use these indicators to monitor economic trends, assess the business cycle (expansion, peak, contraction, trough), and make informed decisions. Governments and central banks often use economic indicators to formulate monetary and fiscal policies, while businesses use them to make strategic decisions, such as investment and hiring plans. Investors use economic indicators to gauge the direction of financial markets and make investment choices. In this article we attempt to measure exactly how much “surprises” in these indicators affect financial markets.
History
In the world of economics, the use of indicators to measure and monitor economic activity has a rich and storied history that spans centuries. These essential metrics provide invaluable insights into the health and performance of economies, aiding policymakers, businesses, and investors in making informed decisions. Let’s take a journey through time to explore the evolution of economic indicators and their enduring significance.
From the annals of ancient civilizations to the corridors of modern financial institutions, the recognition of economic data’s importance has remained a constant. In ancient Egypt, rulers meticulously maintained records of agricultural production, taxation, and trade to gauge the wealth and productivity of their territories. Fast forward to the mercantilist era (16th-18th century), where European nations coveted wealth through exports and the accumulation of precious metals. Here, economic indicators like trade balances, gold and silver reserves, and population statistics shaped mercantilist policies.
The classical economists of the 18th and 19th centuries, such as Adam Smith and David Ricardo, stressed the value of economic data in their foundational works. Smith’s “The Wealth of Nations” discussed national income and wealth as crucial considerations. The Industrial Revolution brought forth a need for more comprehensive data as economies grew increasingly complex. Industrial production, prices, and wages became subjects of systematic record-keeping.
However, it was the Great Depression of the 1920s and 1930s that ushered in a transformative era for economic indicators. The sheer severity of the economic crisis drove an unprecedented demand for accurate and timely data. The United States established agencies like the Bureau of Economic Analysis (BEA) and the Bureau of Labor Statistics (BLS) to meet this need.
World War II intensified the importance of economic indicators, as the demands of wartime planning and production necessitated precise economic data. Concepts like Gross National Product (GNP) and Gross Domestic Product (GDP) were refined and adopted as standard measures of economic activity. In the post-war era, international organizations like the International Monetary Fund (IMF) and the World Bank emerged, collecting and publishing economic data on a global scale. Standardization of economic indicators became the norm.
Today, economic indicators are integral to economic analysis, policymaking, financial market monitoring, and business decision-making. They encompass an array of economic aspects, including GDP, inflation, employment, trade, and more. As data quality and timeliness continue to improve, these indicators play a pivotal role in shaping economic policies and strategies at the national and global levels.
Types of indicators
Economic indicators can be broadly categorized into three main types:
Leading Indicators: Picture them as early warning signals. Leading indicators are statistics that tend to change before the broader economy does. Take, for instance, stock market indices like the S&P 500 or the Dow Jones Industrial Average. A surge or slump in these indices can hint at future economic trends. Similarly, building permits, often overlooked but significant, can signal impending construction activity, which, in turn, forecasts economic growth. And then there’s the Consumer Confidence Index, a measure of consumer sentiment and economic expectations.
Lagging Indicators: These indicators play the role of confirming what the leading indicators have shown. They change after the economy has already set on a particular trajectory. Unemployment rates, a commonly tracked lagging indicator, tend to rise during economic downturns. Inflation rates, meanwhile, can give insight into whether the economy is heating up or cooling down. Corporate profits, often scrutinized by investors, reflect the performance of businesses, a crucial component of the broader economic puzzle.
Coincident Indicators: Imagine these indicators as the here and now, providing real-time snapshots of economic activity. The Gross Domestic Product (GDP) takes center stage, quantifying the entire economic output of a country. Industrial production, encompassing manufacturing, mining, and utilities, reveals the heartbeat of the production sector. Retail sales, a familiar term to shoppers, divulge the total sales of goods and services, offering a glimpse into consumer activity.
There exist many other types of indicators such as:
Composite Indicators: Some indicators blend multiple data points into a singular measure. A prime example is the Composite Purchasing Managers’ Index (PMI). It weaves together data on new orders, production, employment, and more, crafting a holistic view of the manufacturing sector’s well-being.
Monetary, Labor, and Trade Indicators: These indicators illuminate critical aspects of an economy. Monetary indicators revolve around interest rates and the money supply, shaping borrowing and lending dynamics. Labor market indicators provide insights into employment and wages, vital for understanding workforce trends. Trade and balance of payments indicators spotlight international trade, showcasing a country’s global economic position.
Housing Market, Sentiment Surveys, and Fiscal Indicators: Specific economic realms have their own indicators. The housing market, for instance, boasts metrics like home prices and housing starts. Consumer and business sentiment surveys gauge outlooks and confidence levels. Fiscal indicators encompass government finances, tracking revenue, expenditures, and budget balances.
In this article we look at 2 indicators in particular which are Non-Farm Payrolls (NFP) and CPI.
NFP is a critical economic indicator and a coincident one at that. It provides real-time insight into the labor market’s pulse. In essence, NFP tells us how many jobs were added or lost in the U.S. economy outside of the agricultural sector in a given month. This is no small feat, as it encompasses the vast majority of the workforce, excluding farm workers, government employees, and a few other categories. The NFP report, released monthly by the U.S. Bureau of Labor Statistics (BLS), is a harbinger of economic vitality.
Why does NFP matter so much? Jobs are the backbone of consumer spending, which, in turn, fuels economic growth. When NFP rises, indicating job creation, it typically suggests economic expansion and is seen as a positive sign. Conversely, a decline in NFP can hint at economic contraction. This indicator’s power lies in its ability to capture the labor market’s current state, allowing analysts to draw real-time conclusions about the economy’s health.
Now, let’s shift our focus to the consumer price index (CPI). Imagine it as a magnifying glass trained on the cost of living for the average person. CPI is a lagging economic indicator, reflecting changes in the prices of a basket of goods and services over time. The CPI is like an economic thermometer, measuring inflation’s temperature. It calculates the average price change for a wide array of everyday items, from food and housing to transportation and healthcare. This comprehensive snapshot of consumer expenses is published regularly by government agencies such as the U.S. Bureau of Labor Statistics.
Why is CPI crucial? Inflation, or the general rise in prices, can erode purchasing power. When CPI rises consistently, it can signal that the cost of living is increasing, potentially affecting consumers’ ability to buy the same goods and services with the same amount of money. This, in turn, can influence central bank policy, as they often aim to manage inflation within a target range. CPI helps policymakers and individuals alike understand how economic conditions impact everyday life. It plays a role in determining everything from wage adjustments and social security benefits to interest rates set by central banks. As a lagging indicator, CPI doesn’t provide immediate insights, but it offers a valuable historical perspective on how the cost of living has evolved over time, aiding long-term planning and economic analysis.
Effect on Markets
We’ll now examine the effects of some Economic Indicators (EIs) on markets. More specifically, we want to explore whether there is any connection between the magnitude/direction of a “surprise” in EIs and the subsequent effect in markets.
To quantify the degree of “surprise” of an EI reading we’ll take a look at the “Bloomberg Consensus Estimate”, which usually consists of around 50-60 estimations from various economists, and markets analysts. We can then calculate the “surprise” of a recorded reading, by measuring its z-score from the respective distribution of votes as seen below:
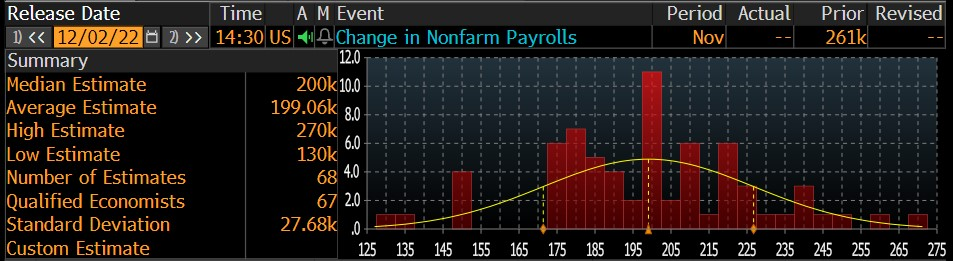
Source: Bloomberg
Our selection of NFP and CPI as focal points is predicated on the noticeable contrast in the level of “certainty” attributed to these indicators. The variances characterising their estimated distributions, together with their mean z-scores emerging from our analysis (0.33 for CPI and 0.66 for NFP), suggest that market participants are better at predicting CPI as compared to NFP.
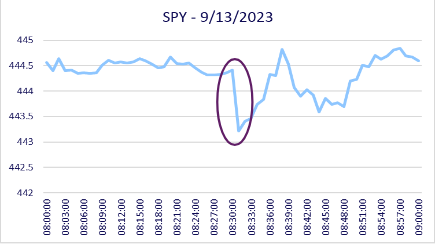
To see their respective effect in markets, we are going to observe market returns immediately after the EI has been announced. Our security of choice is SPY, because of its extensive range and high liquidity. To start off we’ll investigate the market reaction following the last two NFP, and CPI readings (Please note that all considered instances of EI readings, were published at 8:30am (ET)):
Market Reaction after NFP readings:
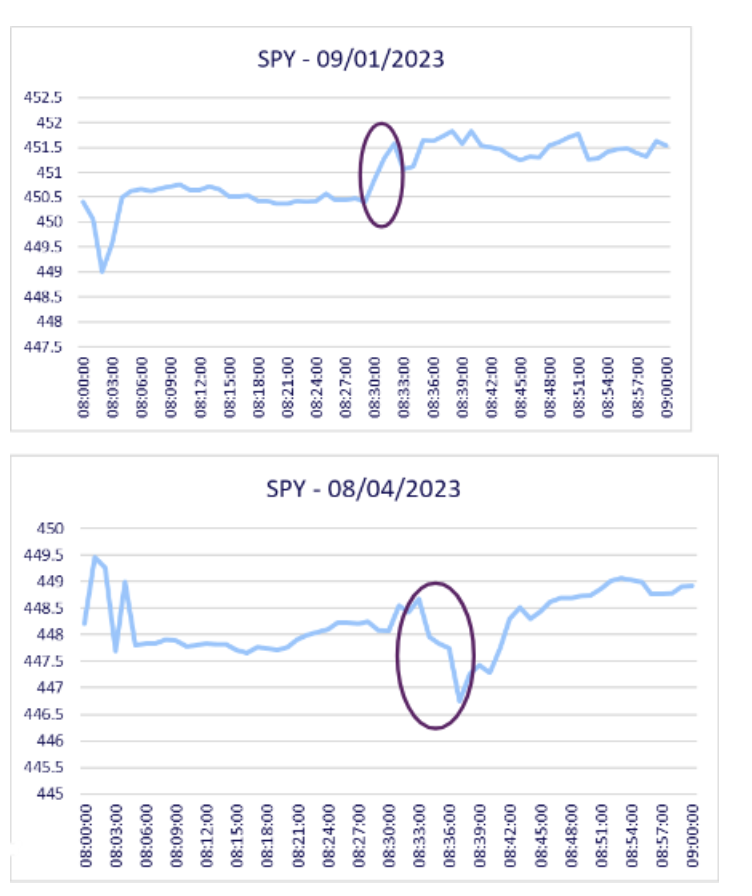
Source: Bocconi Students Investment Club
Market Reaction after CPI readings:
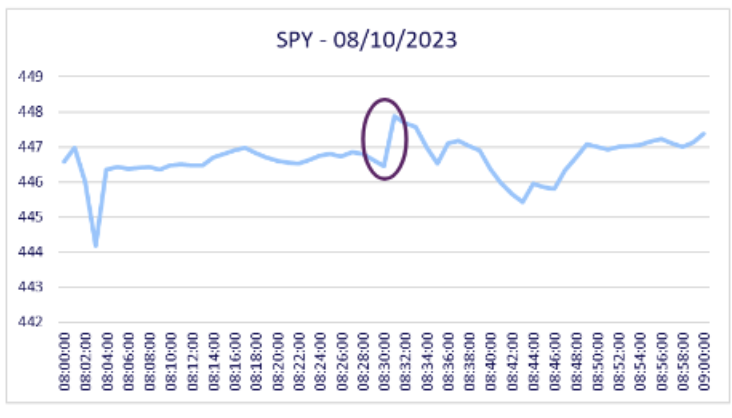
Source: Bocconi Students Investment Club
The purpose of these examples is not to prove causality, but rather to help build a better understanding of the time horizon of the expected price fluctuations. It is evident that even if there is a causal relationship between these events, the moves are short-lived as they don’t seem to last more than 5 minutes, and in some cases prices quickly revert back to normal. Even more volatile moves, like the 2.41% drop after the 10/13/2022 CPI reading, don’t seem to leave a lasting momentum:
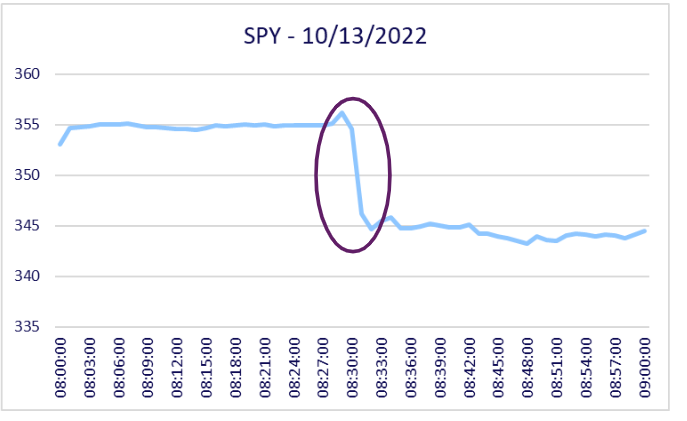
Source: Bocconi Students Investment Club
To further investigate the correlation between EIs “surprises” and market dynamics, we ran two linear regressions on the “surprises” of all NFP/CPI readings in the last 5 years, and market returns. In the first regression, we looked at the link between NFP “surprises” and SPY returns over a 5-minute period. We found a slight positive correlation with an R-squared value of about 0.2.
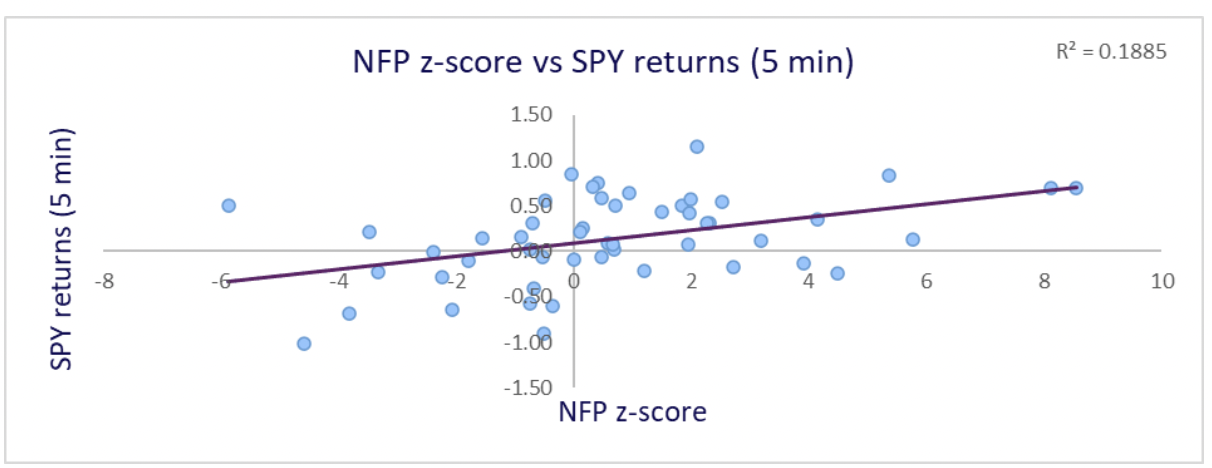
Source: Bocconi Students Investment Club
In the second analysis, we examined how CPI “surprises” relate to market returns over a 1-minute timeframe. Here, we observed a slight negative correlation, with an R-squared value of around 0.3.
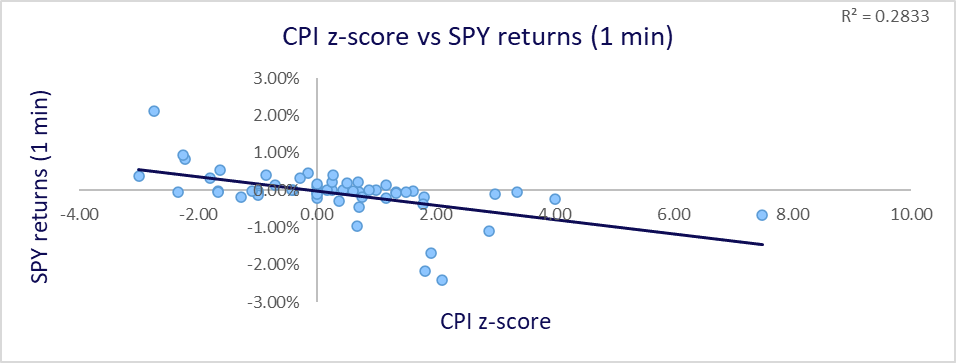
Source: Bocconi Students Investment Club
Among all the timeframes we tested, the 5-minute window showed the strongest correlation with NFP surprises. This indicates that it takes more time for market participants to adjust to new NFP readings compared to CPI. Conversely, with CPI surprises, the correlation weakened with each additional minute added to the timeframe of market returns. This implies that markets react faster and more decisively to CPI surprises, which aligns with the differences in magnitude of market reactions observed earlier. We can hypothesise that this is due to CPI surprises being more uncommon than NFP surprises, as mentioned earlier in the article. It’s important to note that as we extended the timeframe of returns, the correlation between EIs and market movements diminished, as previously pointed out.
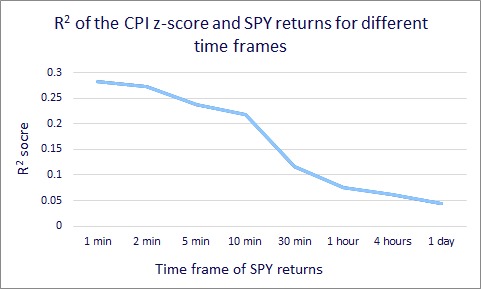
Source: Bocconi Students Investment Club
Lastly, it’s worth noting that both NFP and CPI surprises exhibit minimal predictive power regarding the direction of market movements. It appears that the actual reading of the indicator carries more weight in influencing market direction than the direction of the “surprise” itself.
In conclusion, while there appears to be a connection between EI “surprises” and market movements, more extensive data is needed to confirm this link definitively.


0 Comments