Introduction
When investors decide to allocate their money in a risky investment, they demand higher expected returns than riskless investments. Thus, the expected return on every risky investment can be seen as the sum of the risk-free rate and a risk premium that compensates investors for bearing the risk. For this reason, market participants that allocate a portion of their portfolios in equities are implicitly accepting the risk premium offered by the market at a specific time. This number, namely the equity risk premium, is paramount not just for corporate finance purposes, being a key input in estimating costs of equity and capital, but it is also a crucial metric in assessing the overall market. A critical evaluation of the different estimation approaches and an analysis aimed at understanding whether it can be a good predictor of relative future stock market performances are the matters of this article, which is based on a recent paper of Professor Aswath Damodaran of the New York University.
Why Equity Risk Premium matters
The equity risk premium reflects market participants’ view on how much risk is present in a certain equity market. This perceived risk is affected by multiple factors, such as the health of the local economy, the predictability of macroeconomic variables, the reliability of governments and central banks, and many more potential risk sources that, combined, justify the risk aversion of investors and the consequent existence of the risk premium. ERP directly affects the stocks’ expected returns and, consequently, the fair value assigned to them. Anyone who invests has a view on equity risk premium, though few investors are explicit about their views. Investors who believe markets to be efficient argue that the ERP built into market prices is always correct, and that its variations only reflect changes in the outstanding risks that the premium compensates for. Conversely, investors who believe the market to be overvalued or undervalued are implicitly asserting that the ERP priced in by markets is too low or high and that it does not adequately compensate for all the risks sources, or it is overstating them. It should now be clear how every debate about the overall equity market can be seen as a debate about equity risk premium.
Moreover, since it is possible to estimate a risk premium for every different equity market and compare them with risk premia in corporate bond market or in the real estate market, ERP makes a key difference in deciding both what geographical markets to include in a portfolio and how to allocate wealth across the different assets. For example, if you believe that equity risk premiums across the various jurisdictions are low relative to corporate bond premiums (which take the form of default spreads), you will overweight bonds and underweight equities. In a similar way, an investor which has to decide in what countries to invest the equity component of its portfolio will allocate a bigger fraction of it to those markets where he thinks the ERP is higher than it should be.
Before digging deeper, a crucial assumption needs to be made. We assume to take the perspective of the marginal investor, who is well diversified. That is because the equity risk premium compensates only for the risk component which is non-diversifiable, namely the market risk. When assessing the risk of a specific company, even though you still need a measure of the ERP compensating for the market risk, you are also required to add an additional premium that compensates for the firm specific risk, which it is not the matter of this article. For this reason, the equity risk premium is a market-wide number, in the sense that it is not referable to a single company, but it affects the expected returns and the value of the overall market.
Estimation Approaches: Surveys
There are three approaches to estimate equity risk premium. The first approach consists in surveying subsets of investors, managers, and academics (possibly constituting a reasonable reflection of the aggregate market) on their expectations about future equity returns and then subtracting the risk-free rate. While this method seems extremely logical and straightforward, it presents several potential downsides. Thus, apart from the fact that there are no constraints on the reasonability of the respondents’ answers, that sometimes end up being lower than the risk-free rate, survey premiums tend to be extremely volatile, changing drastically from time to time, especially after large market movements. Taking into account the practical difficulties in surveying a representative fraction of the entire market and the incentives of large portfolio managers to overestimate or underestimate their expected future returns based on their positioning, the disappointing conclusion we reach is that if survey premiums have any predictive power, it is in the wrong direction: when investors sentiment becomes more optimistic is more likely to witness poor performances in the future and vice versa.
Estimation approaches: Historical Risk Premium
The second approach to estimate equity risk premium is the historical approach, where the actual returns earned on stocks over time are compared to the returns earned on the risk-free investment. In this case, the estimation requires some key decisions on various inputs, that significantly affect the final result.
Firstly, you must decide how far back in time to go to estimate the ERP. Some analysts argue that shorter time periods guarantee an updated view on market risk aversion and therefore a more precise estimate. However, this comes with a significant cost: the shorter the time period, the higher the standard error associated with the risk premium: using the US data starting from 1928, the standard error[1] stands at around 2%, while shortening the time span considered, the error becomes higher. It is also worth observing that, with some databases, it is possible to obtain data starting from 1871 or even before. However, given that the nature of the market radically changed from 1871, when the US equity market resembled an emerging market in terms of volatility and risk, and that the older data is less reliable, it is preferable to do not excessively expand the estimation period.
Secondly, it is necessary to evaluate what is the best measure of the risk-free rate between short-term and long-term government securities[2]. Given that the yield curve in the United States has historically been upward sloping most of the times, using Treasury bills will result in higher equity premium than when estimated with Treasury bonds. The immediate decision could be to use the T-bills which, differently from T-bonds, do not bear virtually any price risk. However, since equities are considered as a long duration asset, it is preferable to use long term bonds, that guarantee a predictable return over a longer time span, even with price fluctuations, while rolling T-bills over multiple years would translate in reinvestment risk. Between the various long-term durations, the 10-year bond is probably the best choice, since its data series is the only one continuously available for almost the last hundred years.
The final determinant to estimate historical premium regards the type of mathematical average to use when averaging the returns on stocks and on treasury bonds. The possible choices are the arithmetic average, that simply measures the mean of the series of annual returns, or the geometric average, that looks at compounded return. Specifically, this is obtained by taking the value at the end of the period (VN) and the value at the beginning (V0), and then computing the following:
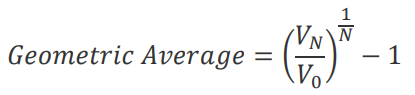
If you assume annual returns to be uncorrelated over time, and the objective to be the estimation of the ERP for the next year, the arithmetic average is probably the best estimate of the premium. However, many studies argue against the first assumption and, also, in order to assess the equity market price level, it is preferable to estimate future ERP for a longer period (five or ten years). For this reason, in the final section of the article, we preferred using geometric averages. To give the reader an idea of how significantly the ERP estimates vary depending on the different estimation period, risk-free rate, and averaging approach used, we have attached the following table.
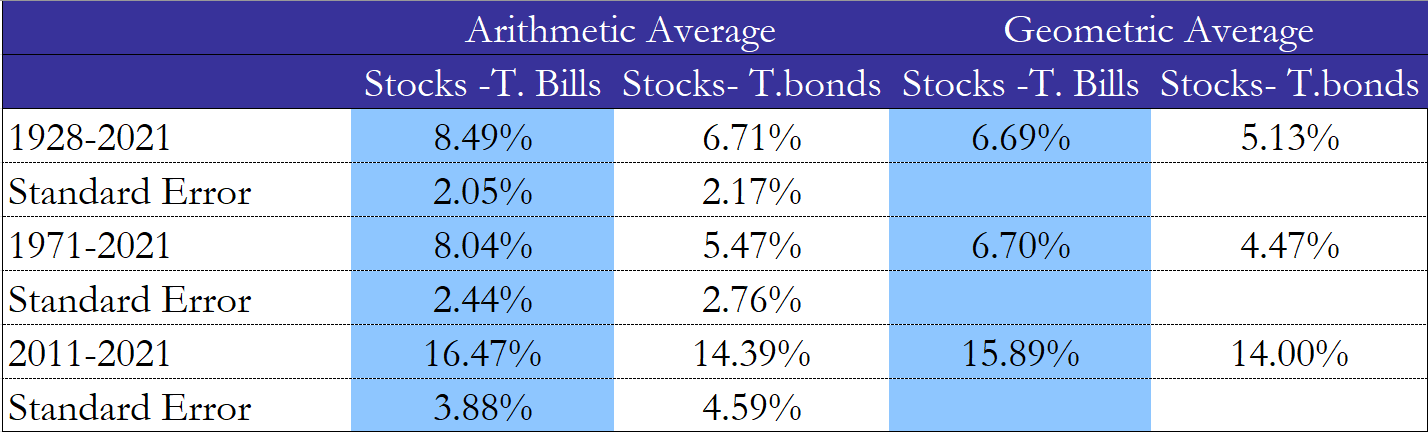 Source: Aswath Damodaran, Equity Risk Premiums (ERP): Determinants, Estimation, and Implications.
Estimation Approaches: Implied Risk Premium
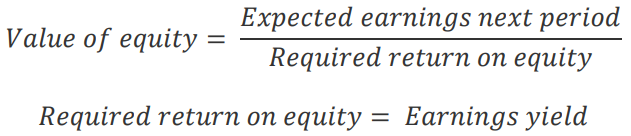
The problem with the historical approach is its backwards-looking nature. To this purpose, we now introduce the implied equity premium, which is yielded directly from current equity market price, in conjunction with expected future dividends, earnings or cash flows depending on the model used. Starting off from a very simple relationship, where value of equity equals the present discounted value of expected dividends, which are assumed to growth at a constant rate:

By solving for the required return on equity and subtracting the risk-free rate, one can obtain the implied risk premium. By making further assumptions, such as the expected dividend growth rate converging to the risk-free rate in the long term, the following equation is obtained, where the ERP simply corresponds to the dividend yield:

Consider now a refinement of this model, focusing on earnings instead of dividends and expressing the expected growth rate as a function of the payout ratio and return on equity (ROE):
![]()
Substituting back into the previous equation:

Assuming that, for the overall market, there is no excess return (ROE = Required return of equity), it simplifies as follows:
Therefore, the conclusion is that the implied risk premium can be seen as the difference between the earnings yield and the risk-free rate.
Both approaches are based on strong assumptions, such as stable growth in dividends/earnings, that are relaxed in the following generalized model. Firstly, the model makes use of free cash flow to equity (FCFE), which also takes into consideration stock buybacks, which have recently been more and more often used by firms to return money to equity holders, compared to dividends. Moreover, it also allows for a period of exceptionally high growth, after which FCFE stabilizes at stable growth values. It follows:
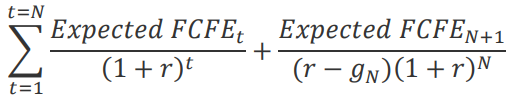
Where N are the years of high growth, r is the required return on equity and g is the stable growth rate after N years. Solving for r and subtracting again the risk-free rate, we obtain a more generalized and realistic measure of the implied equity risk premium.
As we will see in the last section of the article, the implied equity premium is the only type of ERP which is forward-looking, thus a good indicator of future premiums, and therefore of future returns. The downside of this approach is that it requires as input an estimation of future dividends/earnings/cashflows, which forces us (at least partially) to rely on analysts’ estimates, often biased by market sentiment. Moreover, with the implied ERP being a function of the equity price and future cashflows, changes on these metrics lead to significant variations of the premium, as shown in the following chart, where risk premium has been computed through a two-stage FCF model, including buybacks.
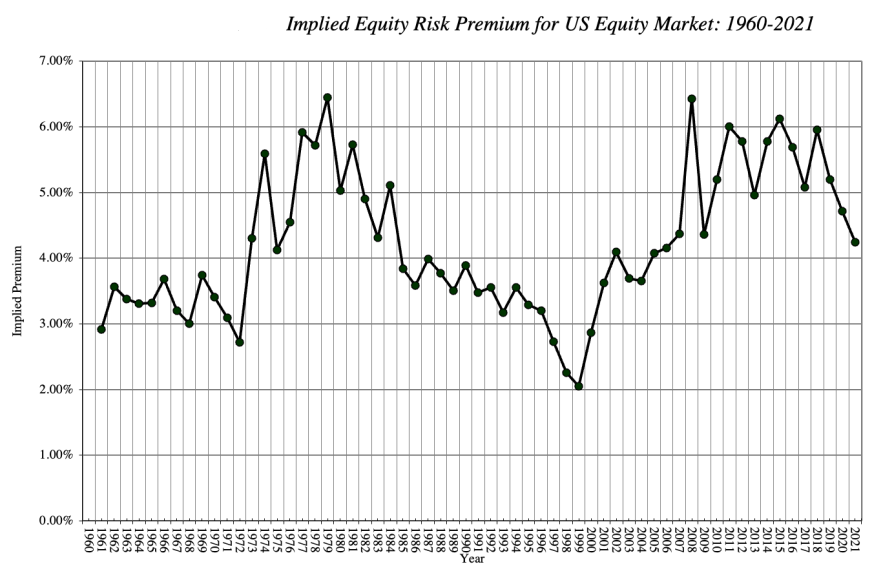 Source: Aswath Damodaran, Equity Risk Premiums (ERP): Determinants, Estimation, and Implications.
ERP in emerging markets
Once analyzed the different approaches to estimate risk premium in a mature market like U.S., it is time to briefly touch on how to assess risk in foreign countries, some of them characterized by shorter market history, political instability, unstable economies, volatile inflation, and other factors that significantly affect the degree of risk[3].
The problem with computing historical premiums for such countries is that, due to the short financial history of some of those, the availability of reliable data is limited, which increases notably the error around the ERP measure. An alternative approach that does not require such an extensive data sample consists in estimating a country risk premium to add to the base premium for mature equity markets. One of the most immediate methods to estimate country premium is to look at their ratings assigned by rating agencies. Even if these ratings measure default risk, they incorporate some common factors that also drive equity risk, such as political uncertainty, instability of the currency, debt level, and many more variables. Another valid option to estimate country premiums is to use country risk scores provided by some organizations (for instance the Political Risk Services Group), which should incorporate a more comprehensive view of risk. Unfortunately, these services are often very expensive for retail investors, and it is not clear how to convert the scores, usually ranging from 0 to 100, into actual country premiums. Finally, it is possible to use market-based measures such as bond default spread, credit default swap spreads or market volatility. Even if these measure, differently from ratings, are constantly updated, they still present relevant downsides: they rarely represent all the factors that cause country risk, but only specific aspects, they respond to market sentiment, and, especially for market volatility, they are altered by liquidity levels[4].
While the estimation of the historical equity premium for foreign countries requires, especially for emerging markets, considerable adjustments that are incorporated into the country premium, the computational process for the implied premium is more flexible, and can be extended to virtually every market, since it is based exclusively on current prices and expected future cash flows and does not require any historical data. As anticipated, this measure can be a powerful tool for portfolio managers, as comparing implied ERP across multiple jurisdictions allows to pinpoint overpriced markets, whose premium is too low relative to other countries, and underpriced countries, where the premium is relatively high. As an example, in September 2007 the implied equity premiums in China and India were almost equal to the ERP for the U.S. Despite the licit optimism on future growth rate for these emerging countries, it would have been hard to assign these countries the equivalent risk of U.S. equities, leading us to the logical conclusion that Indian and Chinese companies were overvalued relative to American firms.
What type of Equity Risk Premium is the best predictor of future returns?
In previous paragraphs we have analysed various ways to compute the ERP, but one question is still to be answered: what should be considered the best approach if our objective is to have an indication of future equity returns relative to risk free returns? It is necessary to highlight that there does not exist any best approach in absolute terms, but that the efficiency of various methods needs to be assessed only with respect to the objective of the analysis.
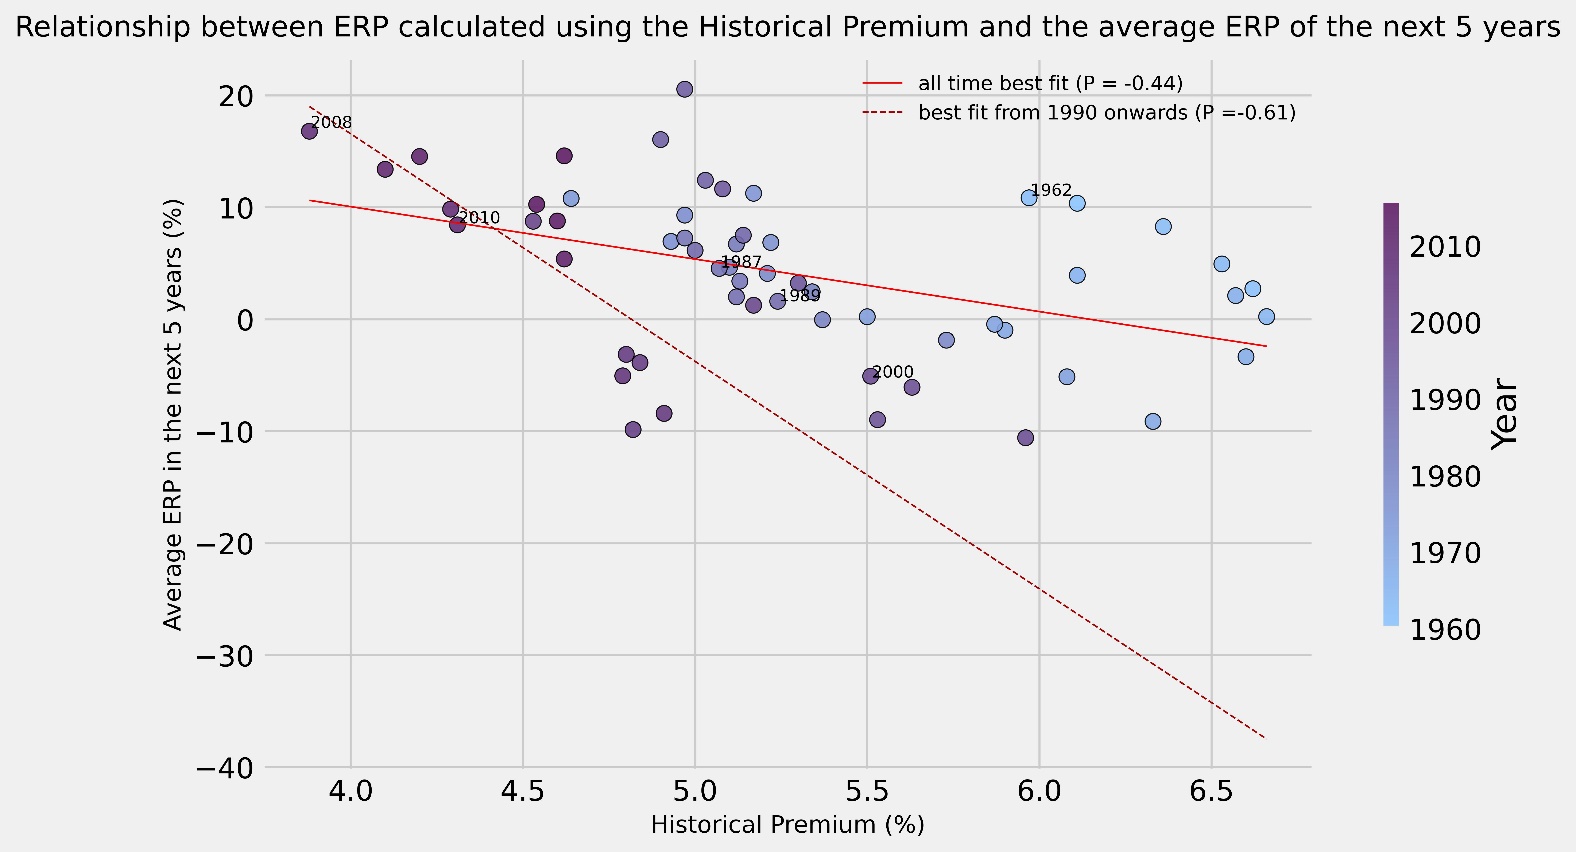
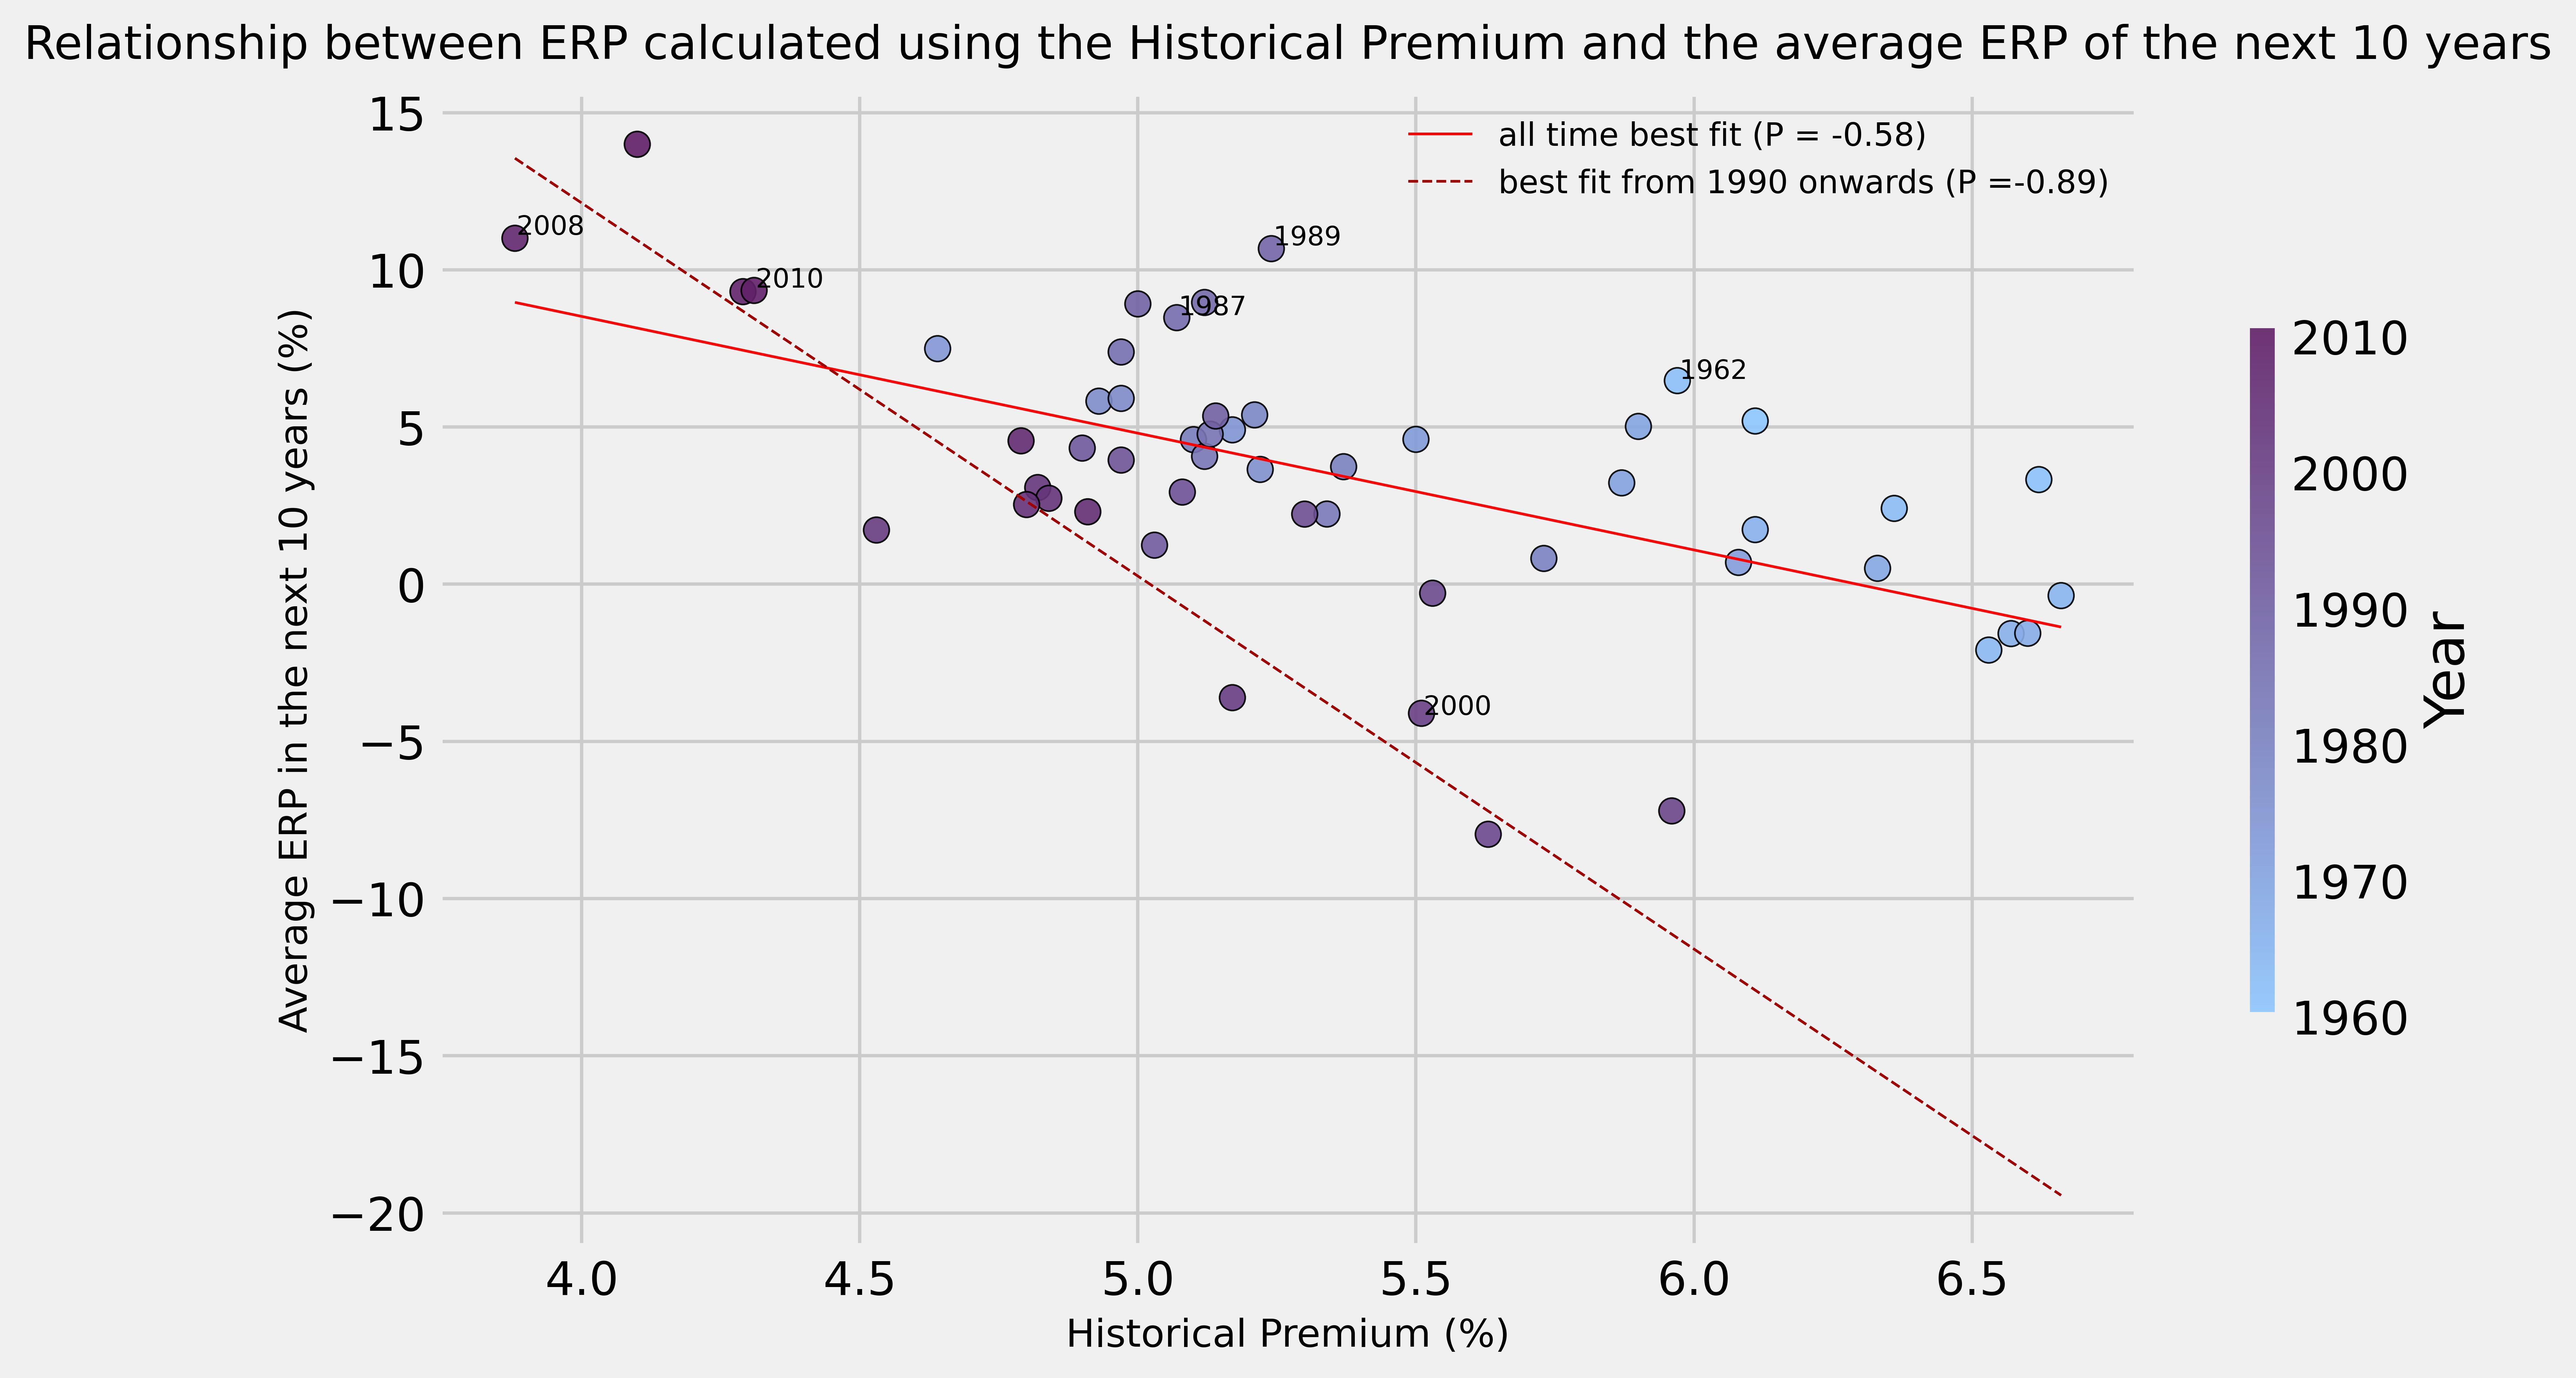
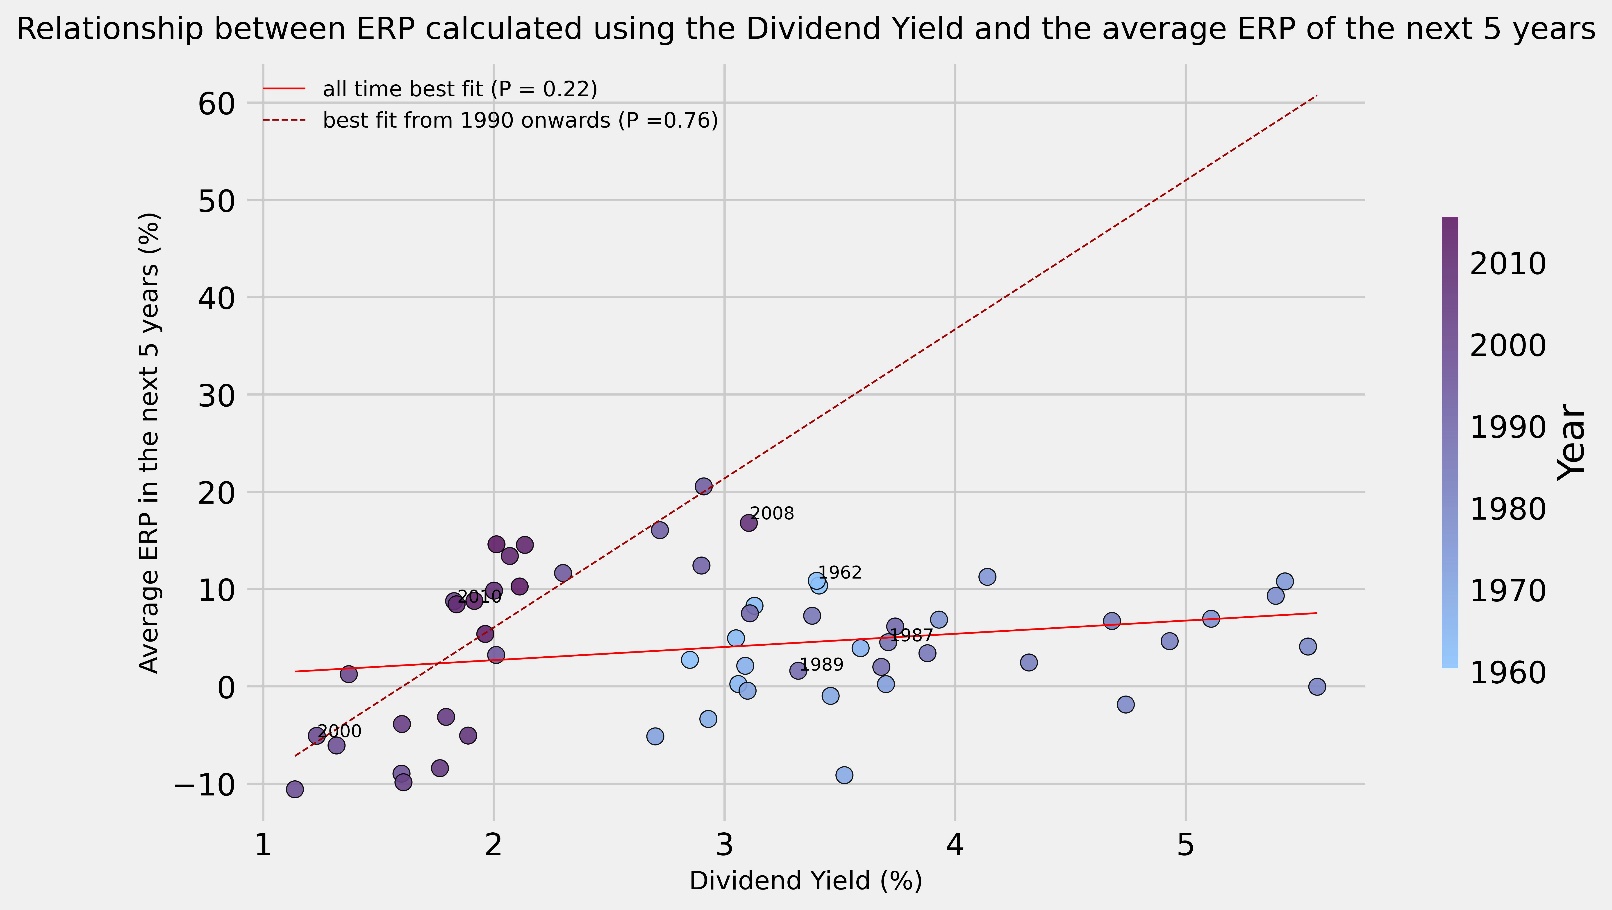
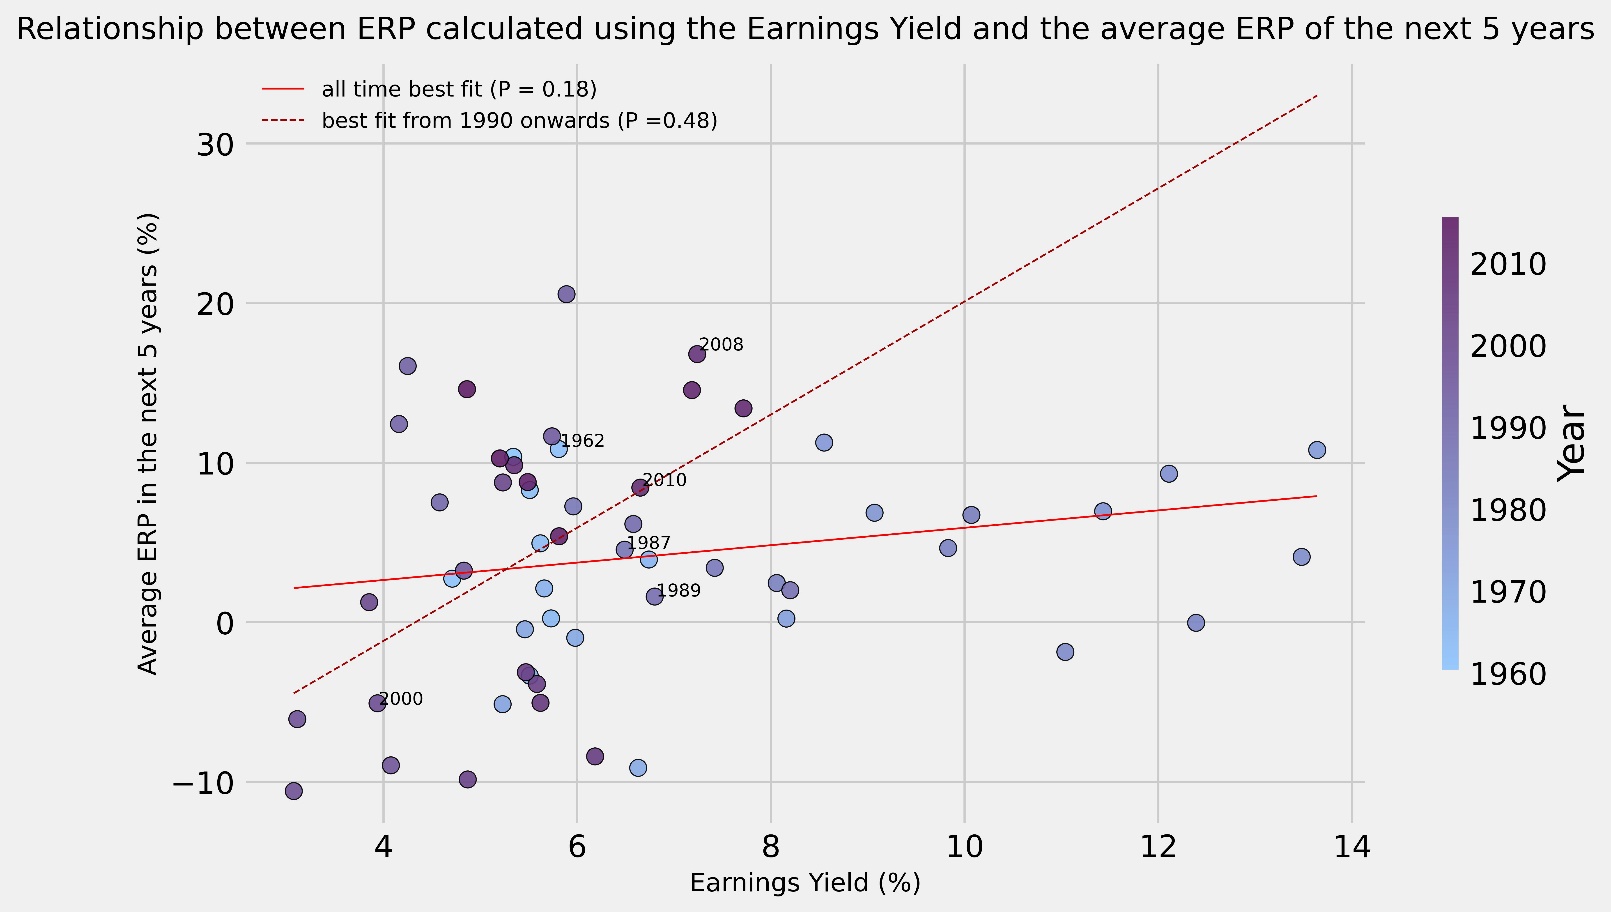
In our analysis, to get an idea of the reliability of each method, we looked at how well every ERP measure has historically been able to predict future ERP. We decided to consider multiple timeframes to see if they might have yielded different results, thus we looked at the average ERP of the next 5 years and that of the next 10 years (computed using the geometric average). We decided against looking at shorter timeframes to minimize the influence external factors may have had on the final calculation. For each year from 1960 onwards, we observed the end-of-year estimate of ERP and compared it to the average of both the next 5 years and the next 10 years average ERP, plotting the results on a scatter graph to observe their relationship. Moreover, we also plotted both the best fit line for all the points and a best fit line considering only more recent years, from 1990 onwards, in order to see if there is any difference between recent and all-time trends. Lastly, we highlight that what is actually important in this evaluation is not the actual number given by each approach, but rather the correlation coefficient of each approach compared to the future ERP, for example if we have a way of computing future ERP that always yield half the actual amount, this would be quite satisfactory, since finding the actual ERP is just a matter of doubling what we get each time.
The approaches we seek to compare are the following: the Historical Premium, the Earnings Yield, the Dividend Yield and finally the Implied ERP calculated through the FCFE.
For the Historical ERP, we opted to follow the recommendations made by Damodaran and multiple other academics, thus we utilized the geometric average, the 10-year Treasury yield as the risk-free return and bwe calculated the average from 1928, updating it year by year.
The results obtained are displayed below:

 Source: Bocconi Students Investment Club
The most surprising result is that, no matter the approach used, a significant jump in correlation is observable when we move from the measures relative to the full data set to the measures that regard only the more recent years. We acknowledge that the lower sample size renders the results of the recent trend less reliable, but the result is still fascinating and warrants deeper analysis. It is immediate to see how, in most graphs, there is a broad separation between the position of the points representing the years from the 60s to the 80s and the points of the 90s until now. We attribute this change in behaviour to a broad shift in the investing landscape that transpired between these two periods, we have so far found three hypotheses that might explain this change:
We could not reach a univocal conclusion to fully justify this omnipresent rise in recent years correlation, but we want to present three possible explanations, all referring to changes in the investing landscape, occurred in the 90s and at the start of the new millennium.
The first one is a shift from a value-oriented investing approach, focused on large, established, and profitable businesses, to a more growth-oriented approach, focused instead on companies that have bright future expectations in terms of revenues and profits. This has indeed brought great changes to the market, namely a lesser focus on dividends and a great increase in investments in growth companies, that usually do not distribute any dividend.
The second reason, which is closely related to the first, is the birth of the internet and the tech sector, which, over time, ended up dominating modern markets. Tech companies are often regarded as growth companies and possess many different characteristics from the rest of the stock market.
Lastly, over these two periods we have observed a gradual concentration of the stock market weighting into a few companies. These companies, the most famous example being Apple which alone represents 7.19% of the S&P500, have come to have outsized influence on the overall nature of the index, having therefore a significant impact on the behaviour of the market in general.
We now move on to an analysis of the performance of each single approach for estimating future ERP:
The Dividend Yield appears to be one of the weakest indicators of future ERP when considering the full period, showing weak correlations in both the 5-year and 10-year timeframes. It is reasonable to think that this method has not been able to achieve the same level of success as the others since dividends alone, without taking into consideration other methods of returning value to shareholders, such as share buybacks, paint an incomplete picture of the financial world. It is relevant to note that, while for the other results it is often lacklustre, the dividend yield has been the greatest predictor in average ERP for the coming 5 years when looking at recent trends (displaying a correlation coefficient of 0.76). We hypothesize that this result could be due to a discrepancy between the volatility of markets returns and the volatility of dividends, meaning that the market, whose return is mostly determined by the performances of volatile and growth-oriented big-techs, is much more sensitive to downturns than dividends, distributed by value companies that have a minor weight on market return[5]. For this reason, during bear markets, the dividend yield increases (as the market falls more than the dividends), while in bull markets, it decreases; considering then that returns “revert to the mean”, a terrible year (such as 2008) is likely to be followed by a recovery where the average returns are larger (the period from 2009 to 2013 had an average annual return of 18.5%, 80% higher than the average). Therefor a high dividend yield (representing a period of recession) could potentially be a predictor of great future performance and a low dividend yield could be one of lacklustre returns.
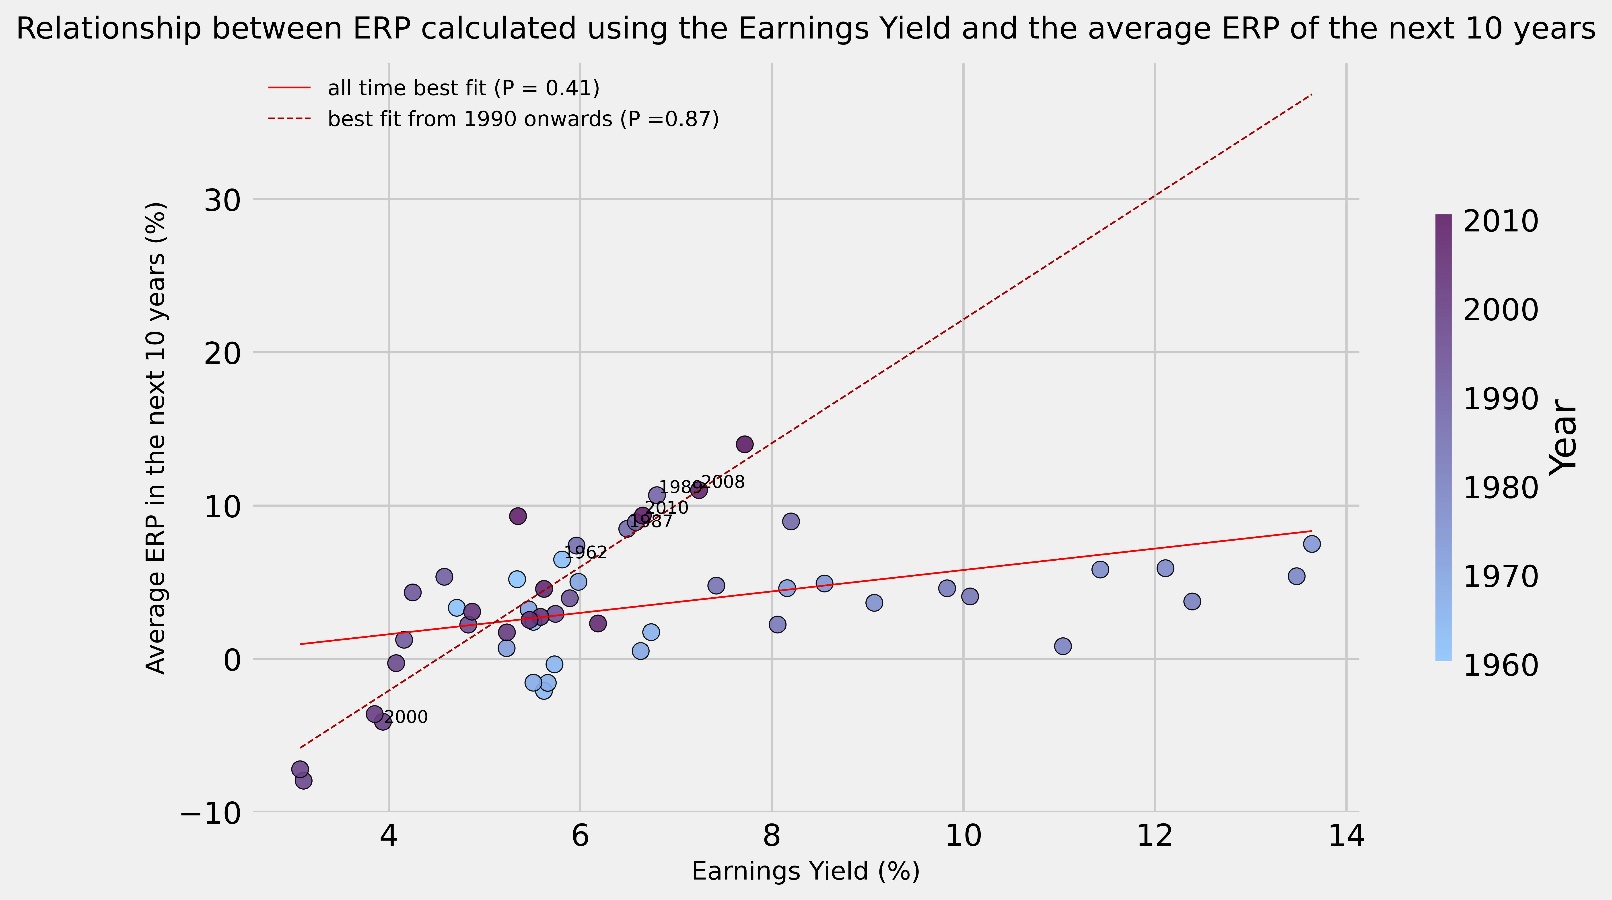
We now move on to the Earnings Yield approach, which appears to be a slight improvement of the Dividend Yield method. While its ability to predict the returns of the next 5 years is extremely limited, there are substantial improvements in forecasting long-term average ERP, boasting an impressive 0.87 correlation coefficient when considering recent times.
The Historical Premium presents a remarkable discovery as it seems to be negatively correlated with both the 5-year and 10-year average ERP so much so that, if taken as a contrarian indicator, it becomes one of the best predictors, displaying very strong negative correlations throughout all the scenarios tested. We hypothesize that this negative correlation stems from the geometric average still being quite sensible to big changes in the stock market (such as a change of -36.5% in 2008 or a 32.2% gain in 2013), which have historically been quite common. Therefore, a high historical premium likely signifies that a recent (or particularly long) rally has taken place while a low historical premium usually represents a recent drop. Again, utilizing the reversion to the mean argument mentioned above, it is possible to imagine how moments characterised by a low historical risk premium are usually followed by a period of recovery and vice versa.
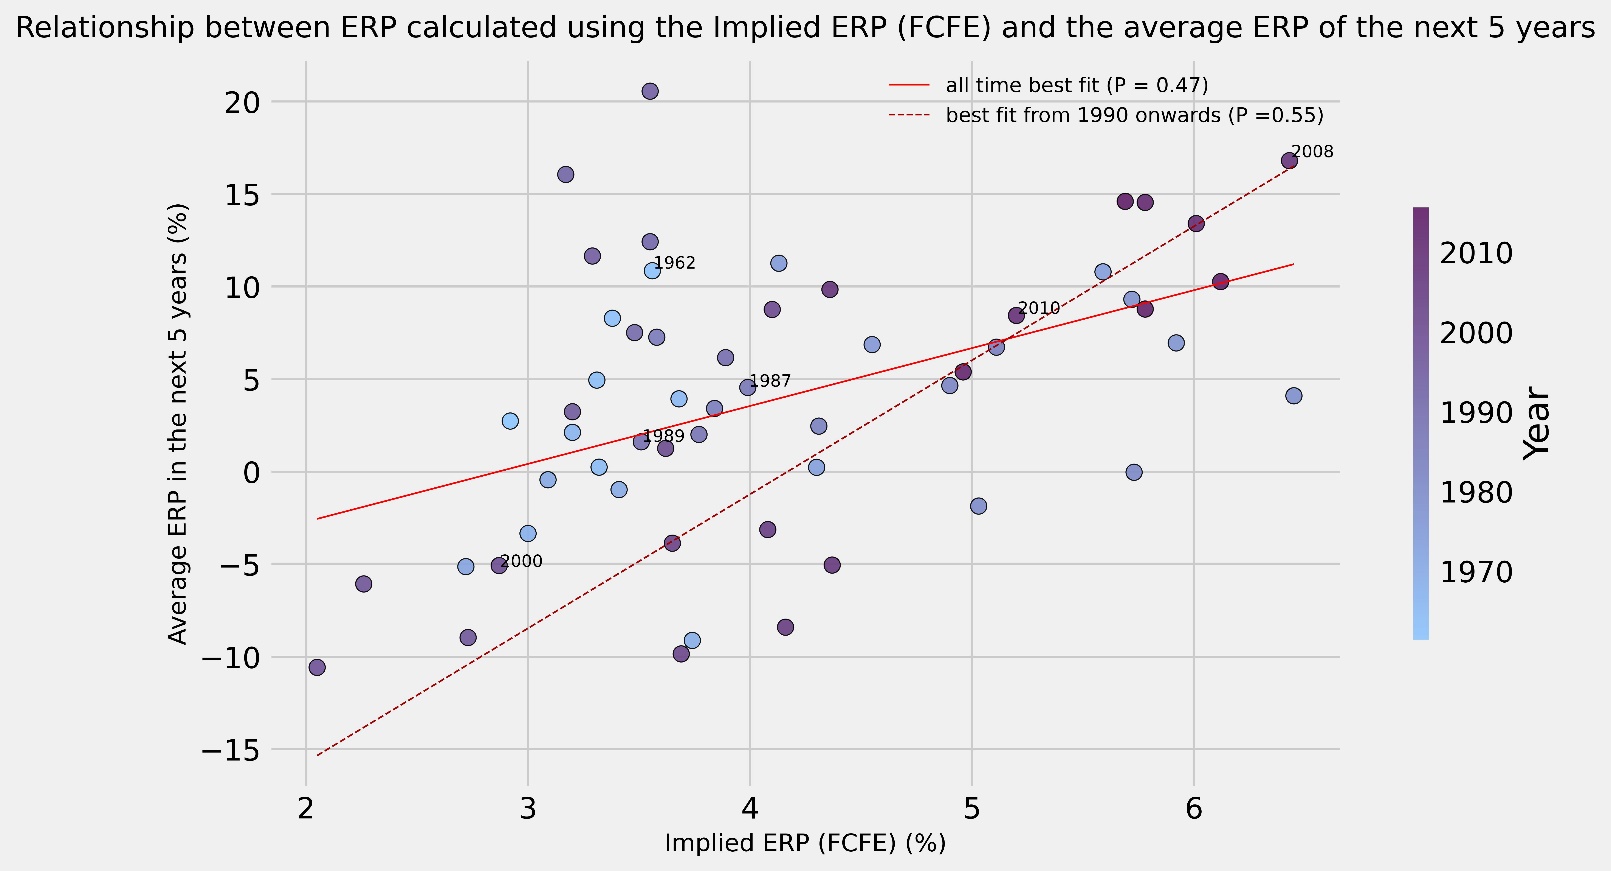
Finally, we get to the Implied Premium calculated through the FCFE, which we believe to be the overall most efficient indicator. A great benefit of this method is its consistency. In fact, while some other methods have displayed better predictability only under specific conditions, the FCFE approach has reliably guaranteed accurate indications in every circumstance. The benefits it gains from being the most comprehensive forward-looking metric have for now outstripped the costs of having to rely on external estimates for its determination, keeping in mind that correlations are still far from being perfect and that any investor seeking to compute an estimate for future ERP should use extreme care.
- The standard error is a measure of how reliable our estimate is based on the sample size. So having a small sample size leads to a greater standard error and vice versa. ↑
- For a more detailed discussion on the risk-free rate, you can consult the BSIC article “How to choose the right Risk-free Rate”: https://bsic.it/how-to-choose-the-right-risk-free-rate/ ↑
- Some economists argue that being the country risk diversifiable, it does not require an additional risk premium. However, due to the empirical evidence of a positive correlation across returns of different countries, we judge country risk to be not entirely diversifiable and to require an additional premium. ↑
- In an illiquid, no matter how risky, market prices do not move. Volatility is therefore extremely low and underestimates market risk. ↑
- In 2008, for instance, the S&P 500 ended the year down by 36.5%, while dividends were cut “only” by 20,4%. ↑


0 Comments