The past summer has been quite hot: we saw unexpected Brexit, Turkish failed coup, the presidential campaign in the US is on the peak, and EMs are bursting out of inflows. On the backdrop of all these events, one very interesting trend may have left out of the scope of attention: the USD LIBOR has significantly increased: 3-month rate stood at around 0.6% at the beginning of 2016, while it has reached almost 0.86% as of the end of September. That is the matter we are willing to get into in this article: we will try to analyze four potential reasons for this trend. As the name of the article suggests, we would consider two recent pieces of regulation: one considering LIBOR rate calculation, another dealing with money market funds. The article is followed by a brief conclusion, which is aimed to recap our key findings and considerations. Though let’s start with some history and theory.
Chart 1. 3 month USD LIBOR is on the rise.

Source: Bloomberg.
Chart 2. 3 month LIBOR spreads over 3yr USD swap stands close to 4 year lows, while spread over EFFR has breached 4 year highs.
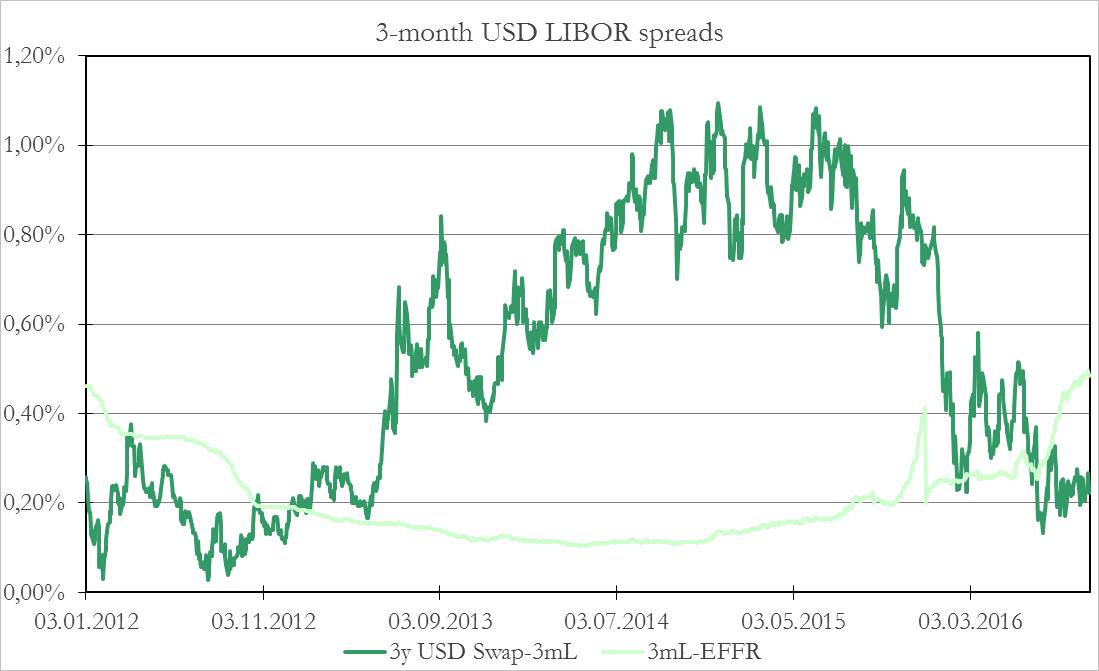
Source: Bloomberg.
LIBOR represents the average rate at which a panel of major banks (from 11 to 17, including JPMorgan Chase, The Royal Bank of Scotland, Bank of America, Citibank, Barclays, etc.) can obtain loans in the London interbank market for 5 currencies (USD, EUR, GBP, JPY, CHF) and maturities from overnight to 12 months.
The banks were daily asked the following: “At what rate could you borrow funds, were you to do so by asking for and then accepting interbank offers in a reasonable market size just prior to 11 am London time?”. LIBOR was then calculated as the trimmed arithmetic mean of the submitted rates after that the top and bottom quartile had been excluded, which means that the top 25% and the bottom 25% figures are not considered in the calculation to avoid outliers. Because the benchmark had to be published daily even if there have not been transactions in each currency and maturity, it was based on estimates rather than actual transactions. A major change in the way LIBOR was defined and calculated happened in 1998 when the British Bankers’ Association (BBA) switched from a rate at which the submitter believed a prime bank would have been offered deposits in the market to a rate at which the panel bank itself could borrow funds.
In 2012 a global investigation found traders from several banks were influencing the daily rate calculations by agreeing amongst themselves to submit rates higher or lower that the actual ones, in order to benefit their own books (a memorable mention, Barclays Bank was fined for £59.5 million by the Financial Services Authority (FSA) for failings related to the LIBOR and EURIBOR and for $360 million by US authorities for tampering and false reporting of the EURIBOR and LIBOR during 2005 to 2009). In June 2012, the key points of the incoming reform were introduced. The main arguments were a statutory regulation of the administration of, and submission to, LIBOR and the transfer of responsibility for LIBOR administration from the BBA to a new independent administrator. Since February 2014, the Intercontinental Exchange Benchmark Administration (IBA) has administered the benchmark rate under the name ICE LIBOR.
Reason one: Change in Fixing Methodology
The IBA conducted several consultations during the past months to define how the benchmark rate could and should be improved. On 18th March 2016 IBA published the “Roadmap for ICE LIBOR”, a summary of the previous publication and of the changes they intend to progressively implement before the end of the year. The measures are designed to “deliver a seamless transition to an even more robust rate which will make LIBOR more sustainable for the long term”, as reported on the published document.
Two major variations regarding the calculation method which could be responsible for the rise of the last months are:
– basing LIBOR in actual transactions to the greatest extent possible;
– widening the set of wholesale funding entities eligible as counterparty types.
The first purpose is achieved by getting trade data rather than the expected rate from the panel banks as often as possible. This goal is achieved by defining a waterfall of 3 levels of procedures, so that a particular procedure can be used only if the previous ones in ranking cannot.
– Level 1: LIBOR is derived from actual transaction data. IBA’s intention is to develop and implement its own algorithm, which will calculate the rate as a time-weighted Volume Weighted Average Price (“VWAP”) of the transaction rates. Transactions with maturities which fall close to the required submission tenors could be used for these tenors accordingly to determined interval of days (for instance, maturities between 80 and 100 days are used for the 3M LIBOR, while maturities between 330 and 390 days are used for the 12M LIBOR)
– Level 2: LIBOR is calculated using transaction-derived data. This can be accomplished by interpolation and parallel shift methods. Another way is updating historical data with the change of a correlated rate. There is a maximum number of submission days for which historical transaction can be used and varies between tenor and currency (for instance, USD goes from 3 days for 1M rate to 10 days for 12M rate, while JPY and CHF go from 5 days for 3M to 15 days for 12M)
– Level 3: LIBOR is estimated by expert judgment “using a documented methodology for basing submissions on transactions in related markets, committed quotes, indicative quotes and other market observations”
Banks could have been submitting an underestimated rate until recently, when this new methodologies and regulations had forced them to report the actual rate. They have an interest in reporting a low rate, because individual submissions are published (even if with a three-month delay) and the lower the rate, the more creditworthy the financial institute is perceived. However, after the scandals in 2012 the regulatory and governance measures were strengthened (manipulation or attempted manipulation of LIBOR is now a criminal offence in the UK), so it seems unlikely that the whole board could and wanted to falsely keep the LIBOR 40 basis points lower than its real value for this length of time.
Regarding the second change, as the interbank market has lost liquidity after the financial crisis, the IBA decided that Unsecured Deposits, CP and CD with a broader set of wholesale funding entities could be considered eligible for the LIBOR calculation. These entities are: Banks, Central Banks, Non-Financial Corporations, Government entities, Multilateral Development Banks, Non-Bank Financial Institutions (including Money Market Managers and Insurers), Sovereign Wealth Funds and Supranational Corporations. The gradual inclusion of transactions with corporations could be one of the causes of the LIBOR rise. The IBA estimates an increase up to 15% of the transaction volume, which means that the interest rate applied with companies would have a weight of 13% in the calculation of LIBOR. In spite of that, the bank in the panel always acts as the borrower, thus there is no influence by the credit risk of corporations and the rate should be equivalent to the one required when borrowing from the other entities.
So, in our opinion, the new method and the new requirements used for the calculation of the ICE LIBOR should not be the main cause of its recent surge.
Reason two: Market Participants’ View on Fed Policy
Fundamentally, LIBOR reflects two main components: benchmark USD policy rate, namely Effective Fed Funds Rate (EFFR), and the credit spread of the banks-contributors. In this and subsequent sections, we are going to look deeper into these two components to determine what has changed over the past 9 months. First, the plot below reflects how tight has been the relation between 3mL and EFFR for the past 16 years.
Chart 3. 3 month LIBOR has closely followed the benchmark USD rate.
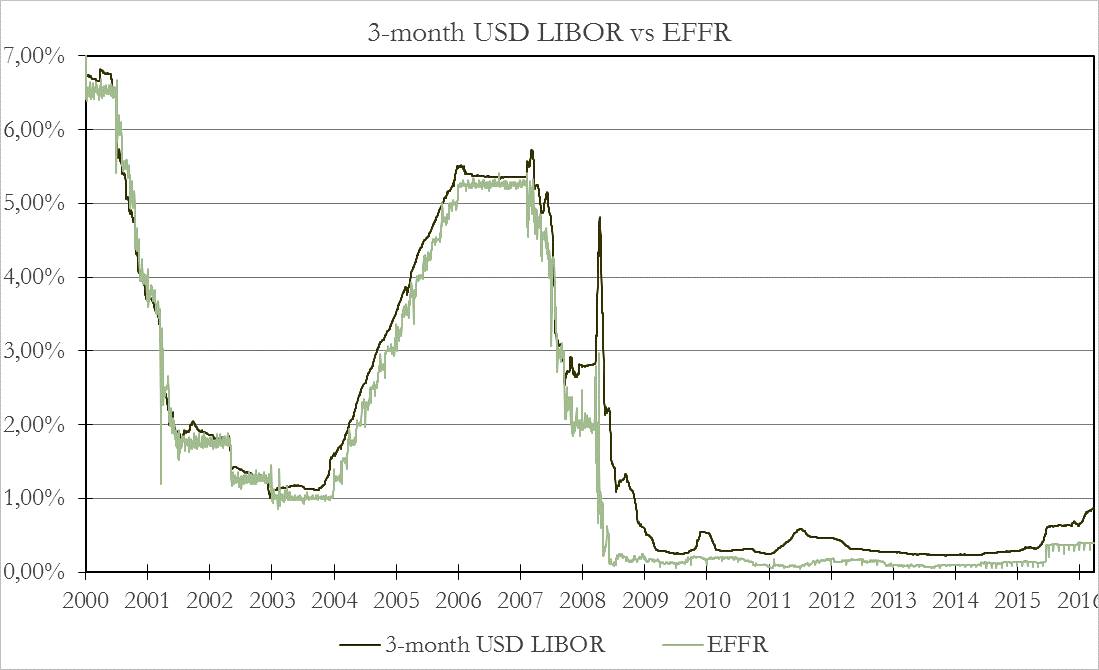
Source: Bloomberg.
It can be seen that the deviation between the two rates has breached 1% only once, at the outage of the Financial Crisis, meanwhile the average deviation was around 0.1-0.15%. This means that the rate hikes anticipated in the near future are likely to push LIBOR rate higher. This means that if, for example, the market is anticipating 25bp increase during the next 3 months, the quoted 3 month LIBOR should also incorporate this amount.
However, the actual market evidence does not seem to support the idea that the increase in LIBOR could be attributed to expected USD benchmark rate increases: right after the past hike, which the Fed underwent in December 2015, the market, as well as the analysts, converged in future rate hike path estimates, forecasting and pricing into FF futures from 3 to 4 hikes for 2016, with the large probability given for 2016 March hike. Nevertheless, very soon the correction came, situation in China deteriorated, and as soon as in 2 months, the market priced almost zero probability for March hike. More or less the same situation has held until September, when market first began to incorporate the probability of the hike in the next 3 months in excess of 50%.
What has been happening to 3 month LIBOR all this time? It has been predominantly stagnating at around 0.6-0.65% till the middle of the summer, and past this point it has started rising. Obviously, the version with rate hikes fails to explain current LIBOR developments.
Reason three: Change in Credit Spreads of the Prime Banks
Another very important component is banks’ credit spread. Basically, LIBOR reflects the rate at which banks would take short-term deposits. However, it is not all about the banks: as in any market, the price (here, the rate) is formed both by supply and demand, and the riskier are the banks, the less other market participants are willing to deposit their funds with the banks. The effective rate will increase till the balance is found. As we have already stated, LIBOR is determined by two components: EFFR and credit spreads, so if EFFR stays the same the increasing market fears towards banks’ solvency will have the direct effect on LIBOR.
Chart 2 suggests that current LIBOR spread over EFFR is on the record highs in 4-year time frame, which is confirmed by the right end of Chart 3. The data on credit spreads is fully consistent with that: according to our research, the significant deterioration in the credit spreads began 1.5 years ago.
At that time, only 1 bank out of 16 was granted the credit rating lower than A-, meanwhile the median stood at A: 1 bank had AAA rating, 4 banks A+, 6 banks A, 4 banks A-, only one BBB+. At the end of 2015, there were already 3 banks with credit ratings at BBB+, while as of the end of September 2016, the structure looks as follows: 1 bank AAA, 3 banks A+, 4 banks A, 2 banks A-, 3 banks BBB+, 2 banks BBB, and one is BBB-, standing one step away from the junk category. Outlook is mostly stable, a bit skewed into negative (in 3 cases), only one bank’s outlook is positive.
The downgrades brought credit spreads deterioration: according to our estimates, the average of 1-year credit spread among the banks in consideration should have increased by 20bp from the year end of 2015 till the end of September 2016, given the downgrades we saw. Actual 5-year spread, calculated using the latest USD unsecured debt issues on the two dates, increased by 65bp over these nine months for 6 banks in the sample. Given the distribution of banks’ credit spreads, the estimated value should be close to the true value, should it have been estimated using the whole sample.
Given non-linearity of credit spread curve over various maturities, it is quite difficult to quantify the exact effect the increase in credit spreads had on LIBOR, however it should be true that at least part of the recent LIBOR uptick was caused by the deterioration in perception of the prime banks’ solvency.
Reason four: New Money Markets Regulation in the US
What is particularly interesting with the recent LIBOR rise, is that it has been happening mostly at the short end of the yield curve: the spread between 3-month LIBOR and 3-year swap (basically, the same as the average of 3-month LIBOR forward rates over the next 3 years) has substantially reduced, gong down from around 100bp to almost 20bp. This means that 3-month LIBOR forward rates did not change that much, and now the curve is way too much flatter than it was at the end of 2015. This creates an incentive to look for some technical, instead of fundamental, reason for the recent trend.
And there is a very strong one! Namely, it is the ongoing change in US money-market funds regulation. In general, there are two types of money-market funds in the US: government funds (invest only in short-term US Treasury Notes) and prime money-market funds (invest in non-governmental short-term notes: commercial paper, certificates of deposits, repo agreements).
So, here is the brief recap of the reform: starting on 14th of October 2016, prime money market funds will be obliged to report their floating NAV (Net Asset Value), which means that they will need to mark-to-market it all the time, instead of just fixing it at $1 per share, as it was before the regulation. Another point is that there will so-called “gates” put in place: should the value of the assets, that could be liquidated in a week’s time, fall beyond a certain threshold, there may be a redemption fee imposed, or the redemptions could be banned completely. Namely, if the value of this assets goes down by more than 30%, the ban preventing redemptions completely for the next 10 days can be imposed.
The market reaction to the new regulation was very sharp: over the period of one year the balance between government and prime money market funds changed in the following way: as of end of August of 2015, the AUM (assets under management) of the two group of funds were at around $950bn vs $1.4tn, correspondingly. As of the end of August of 2016, the AUM has become c. $1.65tn vs $850bn (source: Crane, 2016). The prime funds saw outflows of around $550bn, or 40% of their initial value in just a year! How this affected LIBOR: at the end of 2015, prime funds held almost 85% of all commercial paper and ST certificates of deposit issued. As the industry reduced so much, demand imbalance must have led short-term rates rise: the vast majority of commercial paper is linked to LIBOR.
Conclusion
So, 3-month USD LIBOR has gone up by almost 30bp since the beginning of 2016, while there is no obvious reason for that. We tried to evaluate several potential factors, and here are our findings: in our view, the rate hike estimate modifications did not drive LIBOR that much, since the actual projected rate hike probability has decreased over the course of the time in consideration. At the same time, the recent money market funds regulation should have had the most significant effect on spot LIBOR rates.
Initially, we claimed that the new fixing rules did not affect LIBOR directly, however, there is one important point to consider: as a result of the new fixing rules, USD LIBOR is increasingly becoming driven by actual transactions, instead of estimates, which, according to IBA, would enable market participants to get the most accurate and updated LIBOR quotes: LIBOR has been very quick to reflect the current deterioration in credit spreads.
That is why we decided to mention regulation in the name of the article: there seems to be no sphere related to contemporaneous financial sector, in which the legislation does not hold the dominating role.
[edmc id= 4098]Download as PDF[/edmc]


0 Comments