US
US equities mainly lost this past week, with their most followed index closing this week almost 3% down (S&P500). Russell 2000 led the way down with a 3.82% decline week on week, closely followed by the tech heavy tracker (Nasdaq composite) which closed 3.62% down compared to Monday opening. Both the S&500 and the Nasdaq have now fallen for three consecutive weeks.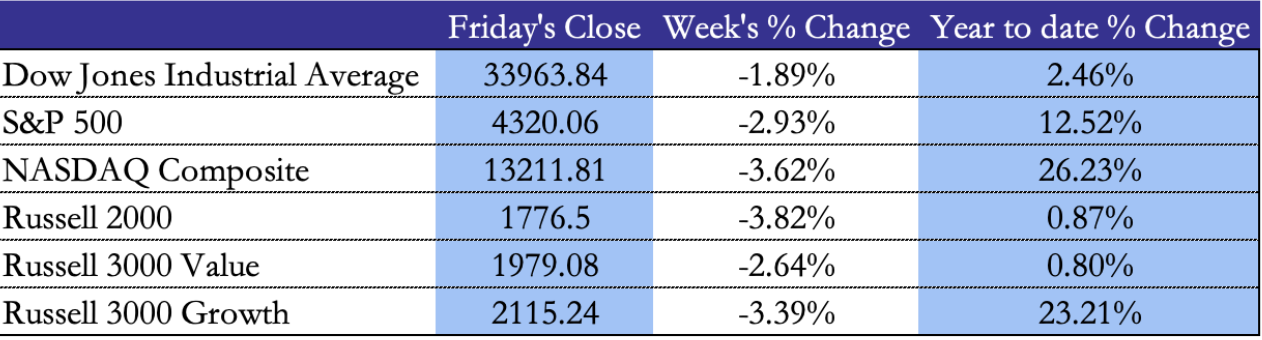
This follows a historic week of central bank activity. Indeed, the FED signaled a pause in its rate hikes at its FOMC meeting on Wednesday, leaving rates unchanged at 5.25%-5.50%, a move that was overly priced and expected by markets. However, markets reacted negatively to the strongly hawkish forward guidance that Powell expressed in his speech, leaving room for further rate hikes at the end of the year (12 of the 19 FED officials still expect to raise rates once more this year). They also see fewer rate cuts in 2024 that previously anticipated, letting the “higher for longer” stance dominate market sentiment, mostly due to “sticky” inflation and a resilient job market. Their projections led them to believe that inflation will fall under 3% next year and return to their 2% target by 2026. The labor market remains extremely tight as new jobless claims came in much lower than the overall analyst expectation, pointing to the overall resilience of the US economy. The four-week moving average fell by more than 3%.
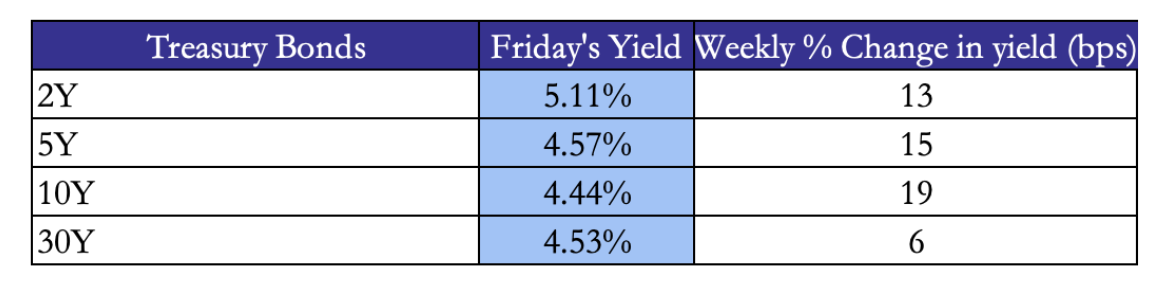
Following the FOMC meeting, the bond market saw strong movements with the policy sensitive two-year US notes finishing the week with a 5.11% yield. The 10Y US Treasury retreated 4bps on Friday from its 16-year high. Indeed, it reached 4.51%, the highest level since November 2007 this Thursday. Another strong measure of confidence came out this week. The S&P Global flash composite purchasing managers’ index, a measure of manufacturing and services sector activity in the US, came in at 50.1 in September. That was down slightly from the previous month, but is hovering around the threshold of 50, readings below which indicate the sector is contracting.
EU
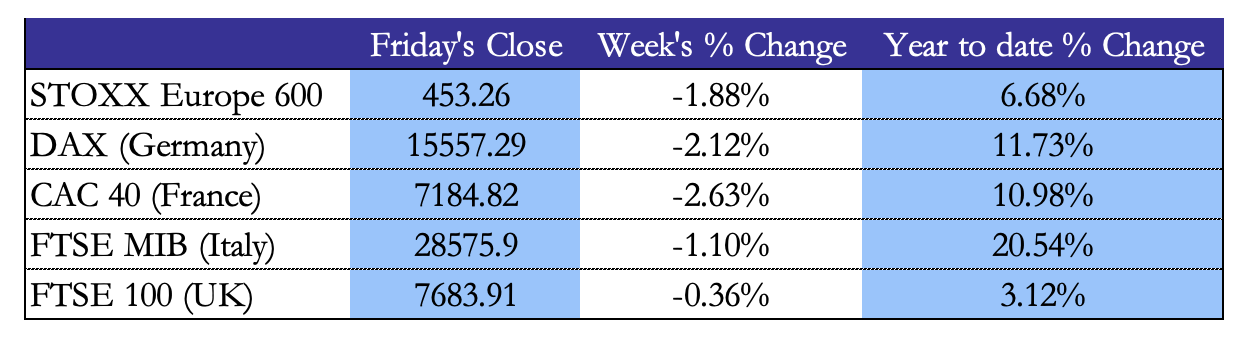
European stock markets closely followed their American peers with all national index extending some relatively strong loses, contrasting from the strong year to date % change. French CAC40 led the selling, with a 2.63% weekly loss, followed by Germany’s DAX at -2.12%. The FTSE mitigated the loses with a 36bp fall from the start of the week. This week’s main focus was ECB’s hike, a Christine Lagarde raised the ECB’s main benchmark rate to a record high 4% on Thursday night (a 25bp increase). This can in part be explained by the stickier than expected inflation, notable due to strong headline inflation. Indeed, energy prices have been skyrocketing due to 1) Opec cuts 2) Russia announcing a ban on oil exports.
An important surprise of the UK market environment was the pause in interest rate hikes by the Bank of England, leaving rates unchanged at 5.25%. Andrew Bailey signaled that 1) inflation has significantly slowed down (6.7% in August, due to slowing food prices) and 2) the high interest rate environment was starting to “hurt the economy”. The main question remains how much energy prices will impact the journey to getting inflation back to 2%, as we look back historically, this has proved to be a challenge for central banks.
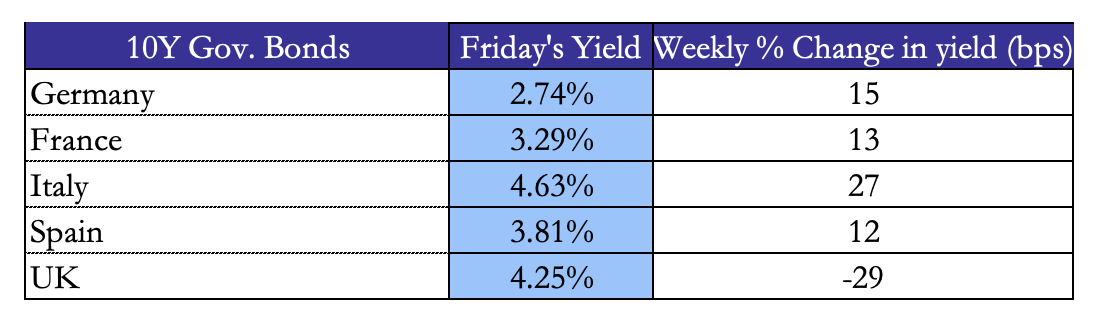
On the EU bond market, yield on the 10-year gilt were down 2.9%, reaching 4.25% following BoE’s decision to hold rates at the same level. Germany’s 10-year Bund yield rose to 2.74% while this week’s biggest mover is Italy with its yield reaching 4.63%.
European PMIs increased this week to 47.1, above analyst’s expectations of 46.5 but still under the 50 benchmark. We can interpret this as rising confidence as managers have the last rate hike in sight.
Rest of the World
In Asia, the main focus has been the BoJ’s decision to maintain its ultra-low-rate policy. This comes in a context of rising inflation. Indeed, consumer price growth has exceeded the 2% target for the 17th consecutive month, rising 3.1% in August. This has sent the yen down 50bp against the US dollar, reaching level of 148Y per $. The predominant view is that tools such as yield curve control and ultra-low rates should be eased in spring of next year, as Kazuo Ueda waits until inflation gets more entrenched (especially relative to wages).
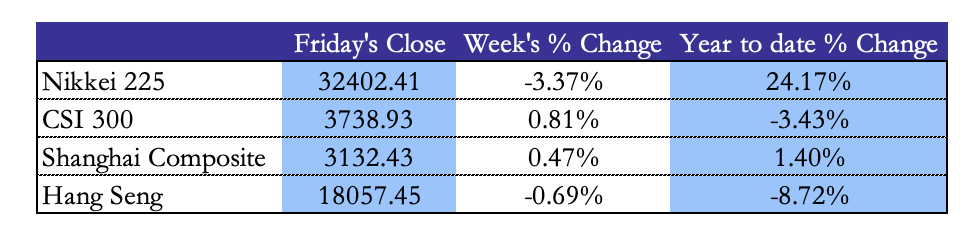
Asian equities mostly drifted during the week, except for the Nikkei 225 which dropped 3.37% week on week. This comes at a contrast with the year-to-date performance of the index, one of its best in the last 20 years. The Hang Seng Index (HSI) stayed flat with a 69bp drop, along with the performance of both Shanghai Index.
The rest of the world mostly had a mixed equity performance, with Brazil, South Korea and Australia performing quite poorly. The South Korea Kospi equity index dropped 3.58% while the ASX (Australia) followed closely with a negative performance of 2.89% week-on-week. On the other hand, Turkey and Mexico had a relatively flat week, with both indices staying under the 1% increase (0.97% and 0.63% respectively).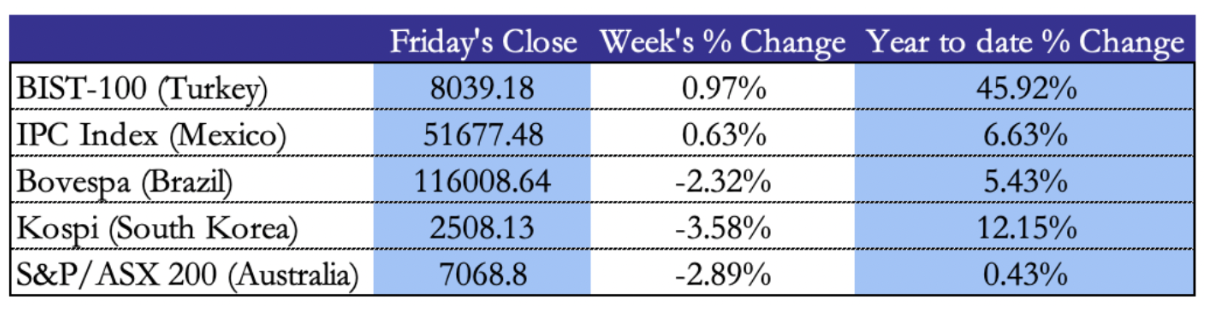
FX & Commodities
The dollar index strengthened to a six-month high with a 0.2% increase, mostly due to the strong forward guidance issued by the FED on future rate hikes. The BoJ announcement of maintaining ultra-loose monetary policy sparked a strong yen selloff, with 148Y per dollar reached within minutes of this announcement. Investors expect Japanese authorities will intervene to prevent a too strong drop in the yen’s value, particularly past the 150Y per dollar mark, reminding that we are not far from last year’s low of 152 Yen. Gold price has turned south in recent weeks, reacting negatively to US’s economic resilience, closing at 1925.42 dollars per ounce.
Oil was the main topic of discussion this week, with Opec and Russia announcing cuts to their productions. This has sent the brent up to 95$ at this week’s peak. It has now since retreated to 92$ but many analysts expect it to cross the 100-dollar mark (Goldman Sachs has been quite vocal about it). An article from the FT analyzed how this significant price hike in recent weeks has been fueled by headlines, but that up to 30% of could be due to hedge fund activities setting up long positions on the instrument.
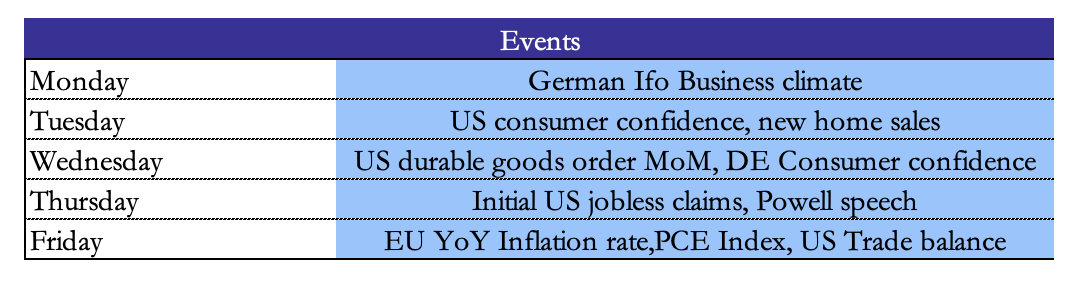
Next Week’s Events
Brain Teaser #01
You have two ropes, each of which takes I hour to bum. But either rope has different densities at different points, so there’s no guarantee of consistency in the time it takes different sections within the rope to bum. How do you use these two ropes to measure 45 minutes?
SOLUTION: For a rope that takes x minutes to bum, if you light both ends of the rope simultaneously, it takes x I 2 minutes to bum. So we should light both ends of the first rope and light one end of the second rope. 30 minutes later, the first rope will get completely burned, while that second rope now becomes a 30-min rope. At that moment, we can light the second rope at the other end (with the first end still burning), and when it is burned out, the total time is exactly 45 minutes.
Brain Teaser #02
Follow up to the previous brainteaser, if instead of having two ropes, what if you only had one rope, how would you measure 15 minutes?
Source: Brainstellar.com


0 Comments