A Match made in Heaven
In this article, we aim to integrate the momentum and carry factors to devise a strategy that enhances risk-adjusted returns.
The underlying concept is straightforward. We seek to avoid positions with negative carry. Even with a momentum signal prompting us to go long on a specific instrument, negative carry would result in sustained losses throughout the holding period. Given that momentum strategies often entail lengthy holding periods (with a minimum of 1 month in our case), negative carry translates into significant costs.
Conversely, positive carry-on positions amplify the impact of the momentum signal. As a result, the effects of momentum are enhanced through favourable carry conditions. Or that is what we thought initially.
Momentum
Time series momentum stands as a well-documented risk factor in financial markets, asserting that past returns can serve as indicators of future performance. Across various asset classes, the past 12-month returns consistently exhibit predictiveness for future returns. This phenomenon prompts a deeper exploration into the dynamics and implications of momentum trading.
The rationale behind time series momentum encompasses several potential factors. One prominent consideration is the willingness of momentum traders to assume risks that others may find discomforting. Notably, momentum trading entails exposure to crash risk, wherein momentum traders may be slow to close positions promptly during sudden market downturns, potentially resulting in amplified losses. Moreover, the momentum phenomenon can be fuelled by hedgers and price-insensitive institutions, whose activities may drive prices away from underlying fundamentals. Nevertheless, the fundamental driving force behind momentum echoes the timeless adage, “The trend is your friend.”
Notably, time series momentum emerges as a robust risk factor that transcends asset classes and time. Its efficacy has been observed across diverse financial instruments, underscoring its resilience and universality. Interestingly, momentum principles even find resonance in sports betting markets, further highlighting its pervasive influence beyond traditional financial domains.

Time-trend t-statistic (TREND): another way to capture the trend of a price series is by fitting a linear trend on the past 12-month daily futures price series using least-squares. The momentum signal can then be determined based on the significance of the slope coefficient of the fit. Assume the linear regression model:

The significance of the time-trend is determined by the t-statistic of , , and the cutoff points for the long/short position of the trading signal are chosen to be +2/-2 respectively:

Carry
Carry stands out as another extensively studied risk factor, defined as the return derived from holding an asset that is not attributable to price appreciation. While the phenomenon of carry has been most rigorously examined in foreign exchange markets, its presence resonates across all major asset classes, offering valuable insights into market dynamics.
Carry trades typically find execution through futures markets, where carry is inherently priced into the contracts themselves. This inherent pricing mechanism significantly streamlines and economizes the construction of carry trades, as traders need only purchase the contract to initiate the strategy.
The returns generated by an asset can be decomposed into three distinct components: carry, expected price appreciation, and unexpected price appreciation. We can define the return of a futures contract as follows:
At any time, t, consider a futures contract with an expiration date . Has a current futures price Ft and a spot price of St. is the margin required. For simplicity, we assume margin is equal to the futures price (A fully collateralized position). Then the return would be given by the following equation:

The carry is the excess return of the futures under the assumption of a constant spot price. Then as we reach t+1 the price of the futures and the spot should converge and thus the carry Ct is given by:

Based on this definition of carry we can write the return of the asset as:

Where is the carry, is the expected return due to price change and is the unexpected return due to price change which has a mean of 0.
As you can see, carry plays a role in the returns of the future that are separate from the movements in the underlying spot price. The important thing is that carry as defined here is easy to calculate and thus examine (Moskowitz).
Definition of Terms and Strategy
Basis:
We define the basis as the logarithmic difference between the price of the closest to maturity futures and the second closest to maturity futures as they do in (Marat Molyboga et. al. 2020).

Here is the price of the first futures which we will consider as spot from now on. is the price of the second closest to maturity futures. We annualize the basis at time by multiplying it by 365 and dividing by , the number of days between the expiration dates of the 2 contracts. If the market has a positive basis we can say that it is in backwardation and if it is negative it is in contango. When the basis is negative, the carry is also negative and vice versa.
Momentum:
We define momentum in the same manner as previously outlined in the article: simply as the 12-month return of the asset. The basic momentum strategy entails taking a long position in the asset if it exhibits positive momentum, and conversely, a short position if momentum is negative. For the sake of clarity, we will denote this strategy as “MOM.”
Combination:
The strategy is straightforward. After we compute momentum and basis for the futures contract, we take a position only if the signs of both signals coincide. We take a long position only if the last 12-month returns have been positive and the basis is positive. Alternatively, we short only if momentum and basis are both negative. Otherwise, we do not do anything.
There is one notable exception to this rule, particularly observed in commodities, where this strategy tends to yield poor performance. However, we found that incorporating the momentum signal with a negative carry position notably enhances the efficacy of the MOM strategy. Consequently, for commodities, we opt for a long position when positive momentum coincides with a negative basis, and vice versa.
While the exact reasons behind this relationship remain uncertain, we explore potential explanations later in the article.
Strange Effect
We find that we improve the strategies risk-adjusted returns for fixed income, FX, and commodities if we condition it on the sign of the basis, but in the opposite way that we expected. If we have a short momentum signal, we act upon it only if there is a positive basis and vice-versa. This is counterintuitive because we are taking negative carry trades. Nonetheless we believe that there are some valid explanations caused by the differences in market dynamics in the different asset classes.
When there is a demand shock for a certain commodity and there is not enough supply to meet it, the spot price of the commodity rises more than the futures price and the futures curve turns into backwardation. If market participants expected this demand to extend into the future, they would simply sell their commodity on the spot market and buy it from the futures market and make a risk-free gain while avoiding storage costs. This seems like an obvious arbitrage opportunity, but for some reasons market participants choose not to do this. We believe that this reflects that they expect the increase in price to be transitory and thus taking a position in the commodity at that point would be pointless, since the holding period of momentum strategies is quite long. And as we cannot see the reason behind the price increase, we take the backwardated curve as an additional source of information as to why the momentum is positive and incorporate it into the decision-making process of our strategy.
Results
Here we present the returns of the different strategies: Buy and Hold, Momentum, and Momentum + Carry

Source: BSIC
When considering Commodities, FX, and Fixed Income, the Momentum + Carry strategies trades when the momentum and carry signal have opposite signs. In the case for indexes, the strategy trades when the signs coincide.
These are the average returns for each asset class when taking a single trade. This means that for a momentum and carry Long only trade on commodities, you can expect a return of 1.09% after closing the trade. In the strategies we use an equal weighting of the contracts.
As you can see the use of the carry signal improves the Sharpe ratio of the momentum strategy when considering both long and short trades. It is quite interesting to look at commodities where that Sharpe goes from 0.33 to 2.2329.
Another interesting case to look at is Fixed Income Long Only, which improves the Sharpe from 1.79 to 5.5991. In all cases Momentum + Carry beats the Buy and Hold strategy.
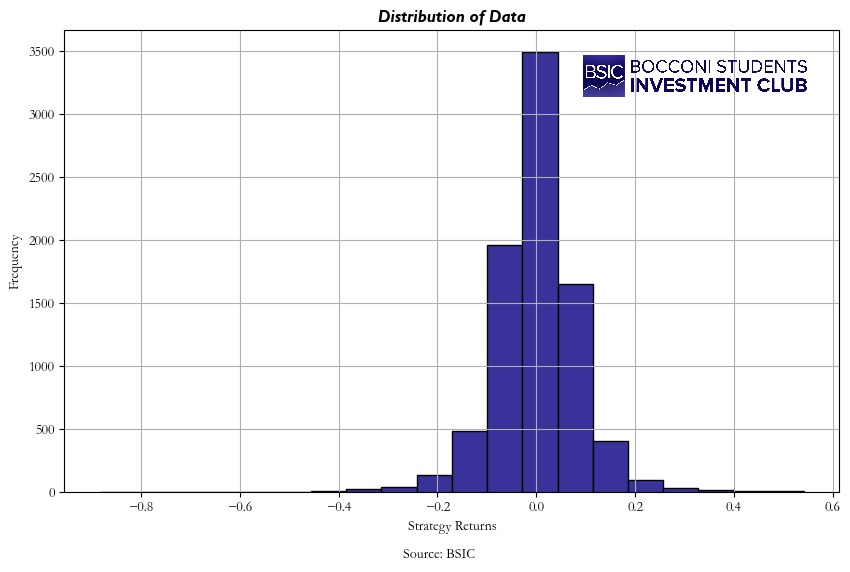
Here you can see the distribution of the Momentum L&S monthly returns.
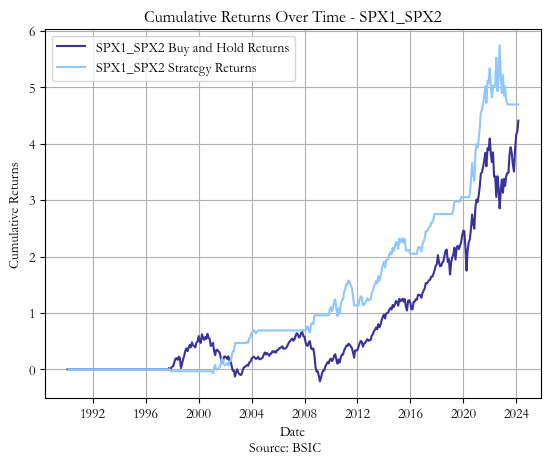
Here you can that when the Momentum + Carry Long and Short is applied to SPX, it improves both the Sharpe and the cumulative returns. Even though the strategy looks quite correlated to the Buy and Hold (B&H), you can see that it avoids some of the biggest drawdowns like the one in 2001, 2008 and 2022.

Here you can see how the Long and Short Momentum Strategy performed relative to the SPX. As you can see, it has smaller returns than the B&H and a worse Sharpe than the Momentum + Carry Strategy. It also does not protect from the drawdowns as well as our strategy
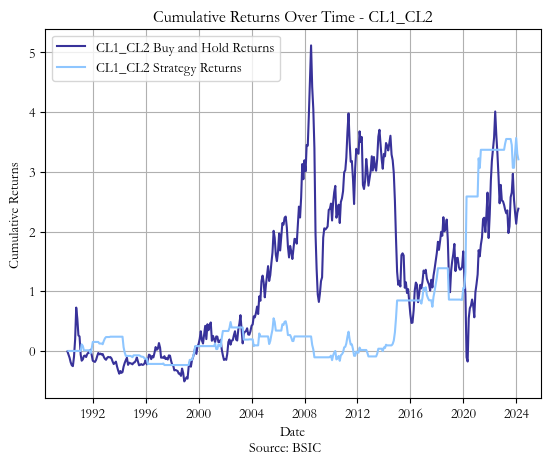
Here you can see how MOM L&S performs against a buy and hold. You can observe the same things as the SPX example: larger returns, better Sharpe and very small drawdowns compared to the Buy and Hold.
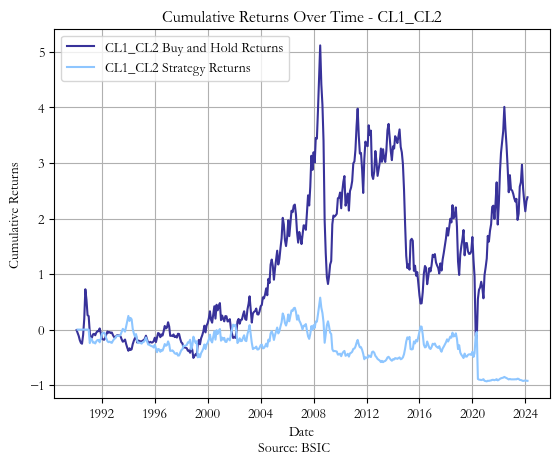
In comparison the Momentum Strategy Performs much worse, delivering negative returns.
References
[1] Molyboga M., Qian J., He C., “Carry and Time-Series Momentum: a Match made in Heaven”, 2020.
[2] Moskowitz T., Koijen R., Pedersen L.H., Vrugt E., “Carry”, 2017.
[3] Hurst B., Y.H. Ooi Y.H., Pedersen L.H., “A Century of Evidence on Trend-Following Investing”, 2017.
[4] Jones C.M., “A Century of Stock Market Liquidity and Trading Costs”, 2002.
[5] Moskowitz T.J., Ooi Y.H., Pedersen L.H., “Time Series Momentum”, 2011.
[6] Molyboga M., “Back to Basis: a Universal Return Predictor across Asset Classes”, 2020.
[7] Ferguson M.F., Mann S.C., “Execution Costs and their Intraday Variation in Futures Markets”, 2001.


0 Comments