Introduction
One of the most discussed topics in Q1 of 2026 is probably the current commodity “Supercycle”. Having become an extremely covered theme thanks to the stellar performance of precious metals (namely Gold and Silver), there seems to be a consensus among investment professionals on the fact that this bullish sentiment is set to rotate away from precious metals and toward other assets in the commodities space. We believe one such asset, belonging to an often overlooked yet promising niche, is Uranium.
In this article, we will analyse the features, players, and structure of the Uranium market, going through some of the most relevant history of the commodity that has helped shape the latter, and then propose an investment thesis based on the more recent trends and developments, which we believe will influence its price moving forward.
What is Uranium?
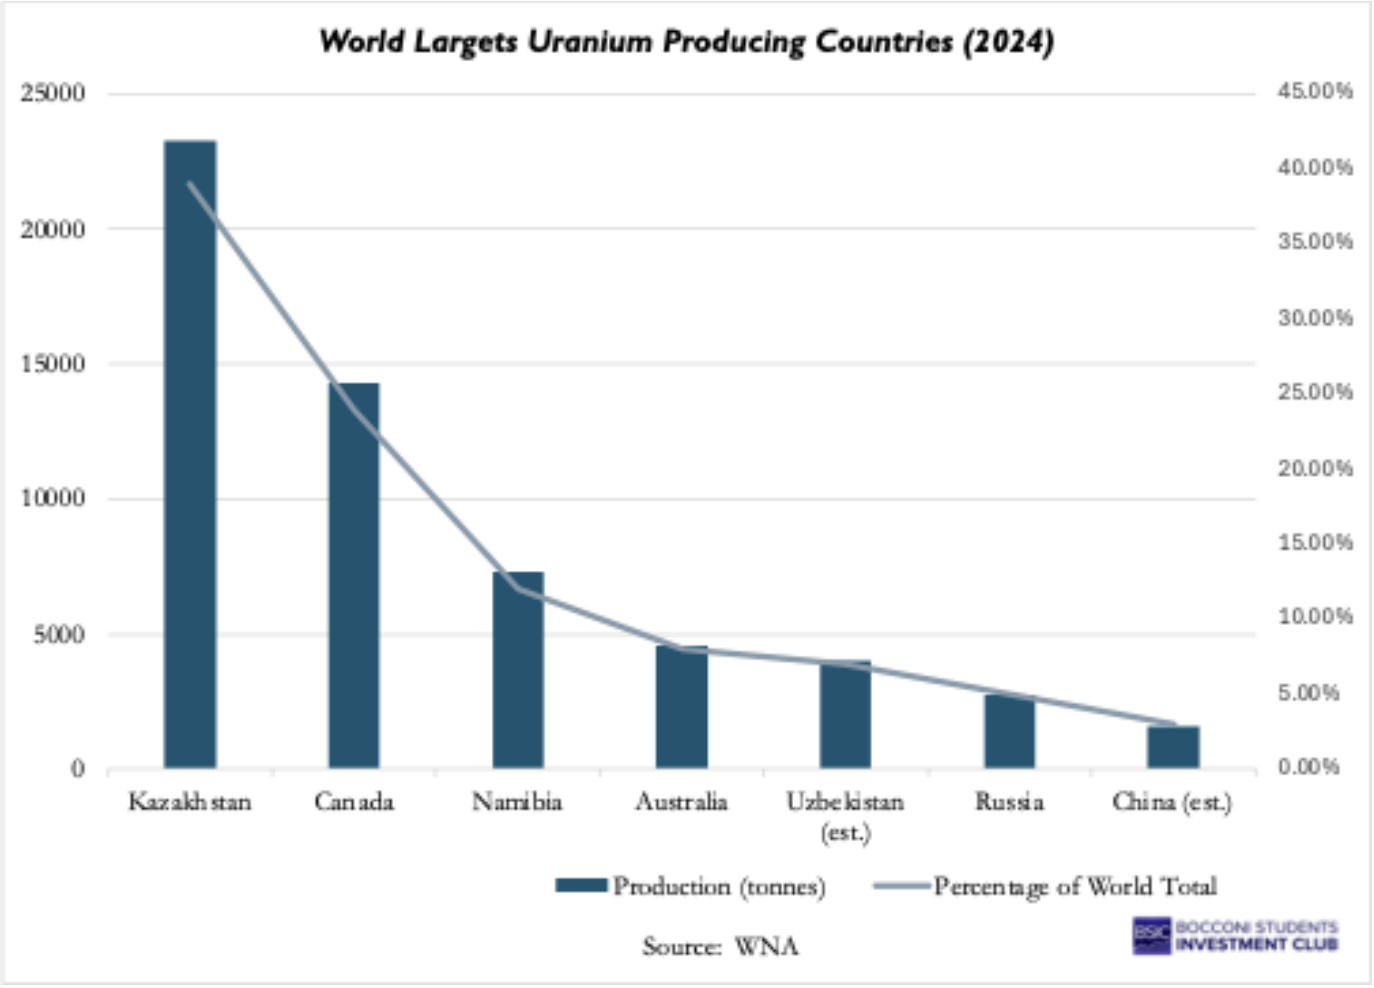
Uranium, as commonly referred to, is the abbreviation Uranium Oxide (U3O8), the ore also known as “yellowcake,” which is extracted from mines. The metal itself is fairly common in nature, yet presents 2 main issues: on one hand, firstly, its availability is extremely concentrated in a few regions of Earth, with 5 countries controlling 70-80% of its extraction.
Secondly, Yellowcake cannot be used in reactors as it is: it usually undergoes a long and multistep procedure of transformation to become usable, which entails a refinement step called “conversion” (which transforms U3O8 into Uranium Hexafluoride UF6) and the well-known enrichment phase, during which the latter compound, naturally poor of the U-235 isotope used in nuclear fission, is separated from heavier isotopes of U-238 to increase the concentration of U-235 from 0.7% to the 3-5% range used in Low-Enriched Uranium reactors or up to 20% for use in state of the art Small Modular Reactors (SMRs). The complex process needed to make Uranium useful represents another significant supply bottleneck since conversion and enrichment facilities are highly capital-intensive and geographically fragmented, creating “choke points” where capacity outages can severely disrupt reactor-ready material availability.
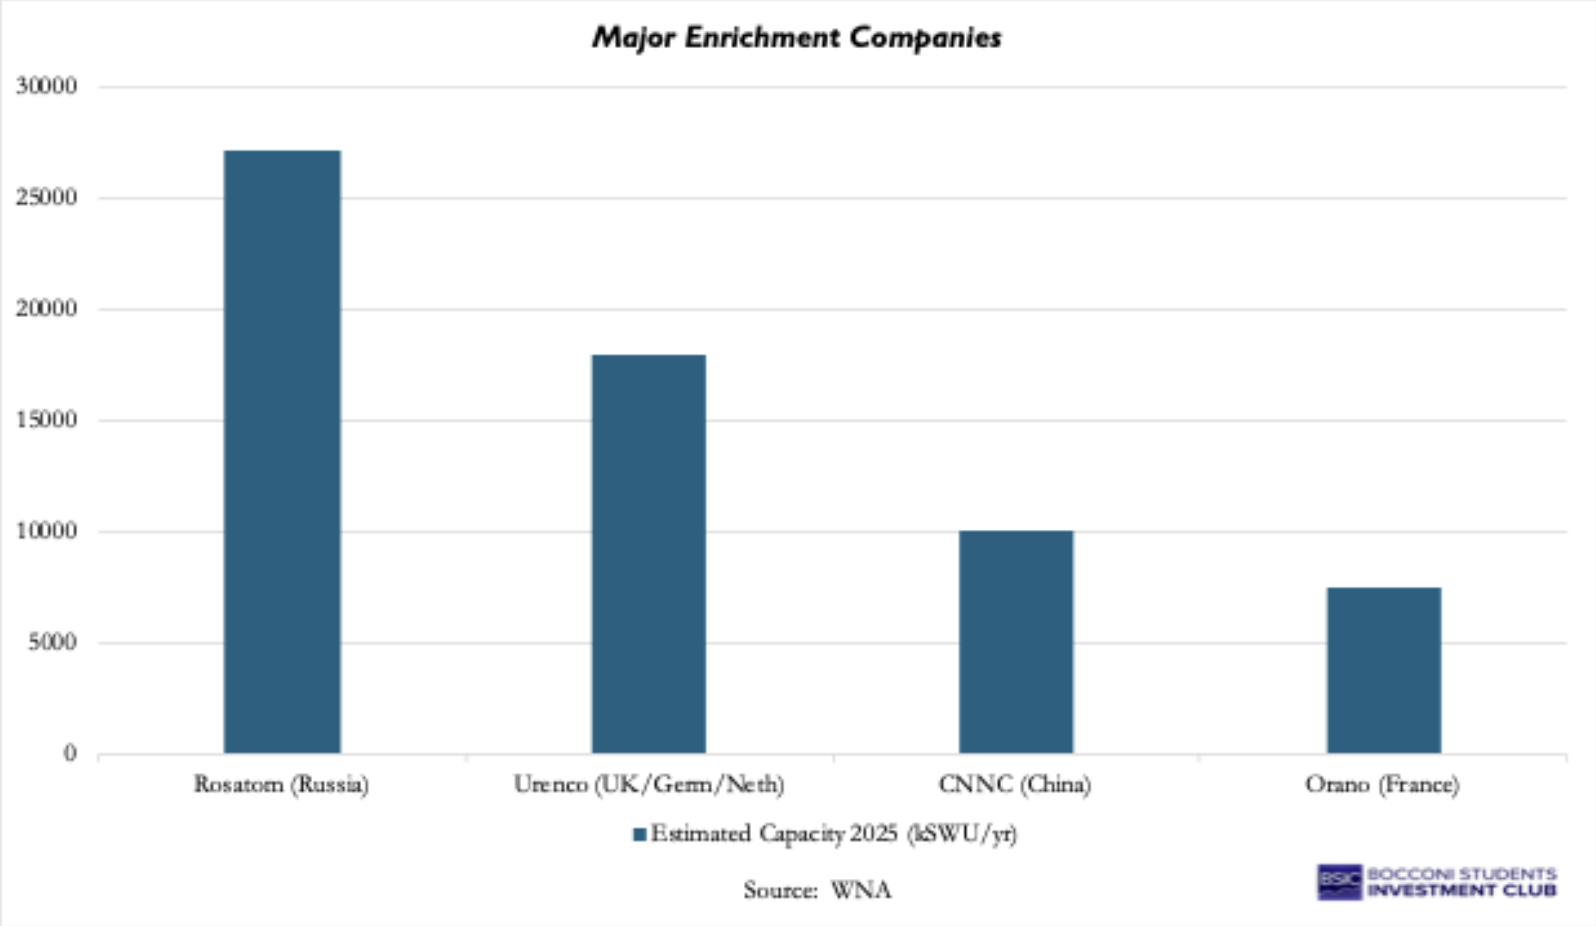
A critical, often misunderstood variable in this process is the “underfeeding” versus “overfeeding” dynamic. For years, excess enrichment capacity allowed enrichers to “underfeed” centrifuges, effectively creating a secondary supply of uranium. However, as Western utilities now self-sanction or face bans on Russian enrichment services (which represent ~40% of global capacity), Western enrichers are running at maximum capacity and “overfeeding” centrifuges to produce fuel faster. While some enrichment capacity is being built in China and France as well, which could keep pace with existing demand, it is unlikely to be sufficient for long term projects. This shift mathematically destroys that secondary supply and geometrically increases the demand for mined uranium feedstock to achieve the same final volume of fuel. Once enriched, the material is finally reconverted into uranium dioxide powder (UO2) and pressed into ceramic pellets to fill the fuel assemblies that power the reactor core.
Supply-Side Dynamics
As briefly mentioned above, Uranium production is highly concentrated in the hands of a few main Countries and a similarly restricted number of mining companies. Moreover, the high cost of capital and the long timeline (usually 7-10 years) involved in creating new mining projects have both contributed to an under-provision of Uranium relative to demand by reactors. According to data by the World Nuclear Association (WNA), while the total global demand by reactors is 68,000 tons of Uranium per year, mining output was only ≈ 49,355 tons in 2022 (74% of utilities’ requirements), jumping up to a little over 60,000 tonnes in 2024 (90% c.a. of demand) and is forecasted to fall by around half of this figure after 2030, as older mines are dismantled. This means that the rest of the demand was satisfied thanks to inventories and secondary supplies.
While the former is quite self-explanatory, the latter is an umbrella term to indicate several categories of uranium sellers that are relatively elastic to price changes. One example is the Cold War program “Megatons to Megawatts” (1993-2013), which down-blended Soviet weapons-grade uranium to reactor fuel for a total of a little less than 10,000 tons per year, satisfying around 15% of world demand throughout the duration of the programme. Another such source comes from re-enrichment of depleted uranium (although technically more challenging), while a major source has been driven by the underfeeding mentioned previously, which was extremely prominent in the 2010s in the aftermath of Fukushima’s accident but is now over, and the industry has officially moved to an overfeeding regime as described above.
While other possible “unconventional” sources are being explored (like treating rock phosphate to get uranium as by-product), the picture of the supply side of the industry is that of an highly concentrated production, which has depleted most of its stockpiles during the last decade, and is now struggling to keep up with the rigid demand for raw and enriched uranium on an annual basis.
Uranium scarcity is not geological; it is financial. Known recoverable resources exceed six million tonnes globally, and the cost of discovering uranium, roughly $1–1.5/kgU, represents only a small fraction of prevailing spot prices. What constrains supply is not the physical availability of uranium in the earth’s crust, but the willingness of capital to endure decade-long permitting timelines, regulatory scrutiny, political risk, and extreme price cyclicality. In fact, the industry has experienced only one true global exploration boom, largely driven by the price spikes of the late 1970s, and that single cycle has supplied decades of nuclear demand. Unlike copper or iron ore, uranium remains a structurally young commodity, where production capacity reflects past investment waves rather than steady depletion dynamics. Its price behaviour is therefore best understood as a capital allocation cycle: when prices collapse, exploration budgets evaporate, and future supply capacity quietly erodes; when prices spike, capital floods in and often overshoots. The result is a structurally volatile market driven more by financing conditions than by geological scarcity.
On top of this, geopolitical tensions are a concrete threat to production. As we explored, a large portion of the yearly production of yellowcake is based in Kazakhstan, with the main mining company Kazatomprom being majority-owned by the government with substantial investments by the Russian Government, which also participates in the value chain as the most prominent converter and enricher. Given the sanctions that came after the invasion of Ukraine, Western countries effectively “self-sanctioned” by halting new contracts with Russian entities. It is trivial to see that, given the highly unstable geopolitical landscape, sudden shocks to production are a realistic possibility.
Demand-Side Dynamics
Demand in the uranium market is mainly driven by nuclear reactor requirements, which is among the most rigid kinds of demand in the commodity markets. Indeed, once a reactor is operational, it refuels regularly, ignoring short-term input fluctuations, as the upfront cost of developing the nuclear reactor and the potential shutdown costs are far greater than those that might be incurred because of Uranium’s price volatility. Indeed, “fuel” costs make up approximately 4-8% of the plant’s operating costs, making the demand for Uranium extremely inelastic.
In order to understand in depth the dynamics of Uranium demand, we shall analyse two main aspects: pricing and players.
On the pricing side, given the confidentiality of the vast majority of transactions, which are concluded OTC, we will primarily rely on what is reported by independent market consultants (mainly UxC LLC and TradeTech), although up to 60% are completely invisible to public investors. Most of Uranium’s procurement is done through long-term contracts (3-15 years in length), following what could be defined as a “hybrid” pricing, like the following:
![P_{contract}=\alpha\left[P_{base}\times(1+i)^t\right]+(1-\alpha)\,P_{spot\,index}](https://bsic.it/wp-content/ql-cache/quicklatex.com-bf267c21941c019d726ab2d76e4f8555_l3.png "Rendered by QuickLaTeX.com")
Which is essentially a weighted average between a fixed price agreed at the time of signing and a portion following the spot price at the time of delivery. Alternatively, it can be procured at future spot entirely with a floor and a ceiling provision:

A smaller portion of the volume (nowadays 25% c.a.) is traded on the spot market, where financial players like Hedge funds and other institutional investors typically account for more than half of overall activity. There is a distinct lack of liquidity in the futures market, which occurs OTC, and most of the physical buying of the commodity on the spot market is done by investment funds such as SPUT (Sprott Physical Uranium Trust) and Yellow Cake plc, whose details will be described in the next section.
Given the dynamics of the operations in nuclear reactors and the relatively small percentage of costs represented by the ore, as said above, demand results in being quite inelastic, giving suppliers large leverage in contracting and in negotiating more favourable provisions when concluding long-term contracts with buyers. Such a dynamic can be spotted by looking at, for instance, the percentage of flexible pricing throughout history (the  term in the first equation) or alternatively at the floors and ceilings in the second equation.
From the players’ perspective, we should highlight that demand is set to grow substantially in the coming decades, and there has been an upward trend since the stagnation that followed the aftermath of Fukushima’s disaster. The expansion is driven by a new wave of reactor construction and the life-extension of existing plants, as reported in the forecasts of the WNA:
In a report published in 2023 by the latter agency, a surge in demand to over 150,000 tonnes is forecasted by 2040, with the increase being driven by countries such as China (with 59 operational reactors and 20 under construction), India (a forecasted increase in capacity from 7 GWe to 22+ GWe), the US (extending the life of its 94 reactors and investing in SMRs construction) and players like Japan and South Korea turning back on their denuclearization policy of the 2010s.
On top of this, investments from Europe and their effort for a Green transition and less dependence on foreign energy sources, as well as possible increased demand from the electricity-hungry AI and tech sector, could be substantial drivers of World demand in the upcoming years.
A brief history of Uranium Market Structure and Pricing
Uranium is a “contracted” market, not an openly traded one. Unlike commodities such as oil or copper, uranium transactions are dominated by private long-term contracts between producers and utilities. Historically, about 80–85% of uranium moves under multi-year agreements, with only 15–20% trading in the spot market for prompt delivery. This structure evolved because nuclear plant operators prioritize security of supply and predictability (aligned with reactor refuelling cycles) over daily price fluctuations. As Trade Tech notes, the spot market mainly provides a price indicator, while the long-term market “yields the material that satisfies reactor needs”. In practice, uranium can be physically tight even if spot prices appear soft. For example, when utilities delay new contracts and draw down inventories, the thin spot market may not immediately reflect looming supply deficits.
Two benchmark prices and why they diverge.
Industry participants reference two price indicators for U₃O₈ concentrate (yellowcake): the spot price, which reflects recent one-time delivery deals, and the long-term price, which reflects prices agreed in multi-year contracts. The long-term price has historically averaged about 10% higher than spot, partly because it factors in miners’ full costs and future delivery risks while spot deals often clear excess secondary material. Contracts are priced in a few ways. Early-era deals often used fixed prices (or base prices with escalators) that adjust for inflation over the contract term. Modern contracts commonly use market-related pricing, where the delivery price is set near the time of delivery (e.g., pegged to spot or an average of published price indices) but with negotiated floor and ceiling protections. For example, a utility might pay “spot minus X” with a floor to protect the miner if prices crash, and a ceiling to protect the utility if prices spike. Some contracts even include “soft” ceilings or floors (where the disadvantaged party can defer performance if the price goes beyond the limit). These tailored terms mean that realized contract prices can vary widely from the quoted spot at any given time. Overall, the prevalence of long-term contracting and the flexibility in contract structures have historically dampened price volatility for utilities but also delayed price signals for producers.
The uranium price cycle is a story of underinvestment and overreaction. Uranium’s pricing history has been marked by long boom-and-bust cycles rather than steady equilibrium. In the early decades, production was driven by geopolitical needs. During the 1945–1965 “military era,” uranium output surged to supply highly enriched uranium and plutonium for weapons, then collapsed as stockpile needs were met. Production literally halved by the mid-1960s when that first demand boom ended. The next phase, mid-1960s to mid-1980s, saw civilian nuclear power expand rapidly; many new mines were financed under long-term contracts with utilities, and Western production peaked around 1980. For a few years, mine output even exceeded reactor requirements (leading to inventory builds). This overhang set the stage for a prolonged glut: by the mid-1980s to early 2000s, reactor construction slowed sharply, yet many utilities were still locked into uranium deliveries from prior contracts. Excess supply was exacerbated in the 1990s by an influx of material from former Soviet stockpiles (e.g., the Megatons to Megawatts warhead down blending program). As a result, primary mines supplied only a fraction of what reactors were using; the rest was coming from inventories and secondary sources, and spot prices languished at historically low levels by the early 2000s.
The 2000s ushered in a dramatic price renaissance and its collapse. Market sentiment flipped around 2003 as investors anticipated a “nuclear renaissance” and realized that decades of low prices had deterred new mine development. From 2003 to 2007, uranium spot prices surged roughly 13-fold. This spike was fuelled by a thin spot market and a few notable supply shocks. One famous example was the October 2006 flood at the Cigar Lake mine in Canada, which was then slated to be one of the world’s largest producers. A rockfall led to catastrophic water ingress, forcing Cameco to delay Cigar Lake’s startup by years. Such events created a perception of severe supply shortfall. By mid-2007, spot uranium reached about $148 per pound, an all-time high. The frenzy even prompted financial innovation: in May 2007, NYMEX launched the first uranium futures contract in partnership with UxC, aiming to bring more transparency and hedging tools to the market. For a brief period, speculators could trade cash-settled uranium futures for delivery months out, and the initial futures prices suggested expectations of further price rises (contracts for late 2007 traded around $150). However, this exuberance was short-lived. Uranium’s thin market meant that when buying subsided, prices fell just as fast as they rose. By 2008, new mine supply (and revived output from Kazakhstan in particular) began catching up, and the spot price cooled off. Then came the Fukushima accident in March 2011, which was a severe demand shock. Japan shut down its reactor fleet and many planned builds worldwide were delayed or cancelled. From 2011 to about 2016, uranium entered a “lost decade” of oversupply and low demand growth. Spot prices plunged more than 70% after Fukushima, hitting lows around $20/lb in 2016. In fact, late 2016 saw spot prices briefly trade below $18 levels not seen since the early 2000s. At those prices, nearly all high-cost mines were unprofitable. The industry responded accordingly: major producers curtailed supply. For example, Cameco announced in late 2017 that it would suspend its flagship McArthur River mine and Key Lake mill, removing ~18 million pounds U₃O₈ annually from the market. This cut, effective by early 2018, was explicitly due to “continued uranium price weakness” and a large inventory overhang. Other companies followed suit or delayed projects, allowing the market to slowly tighten as secondary supplies were drawn down.
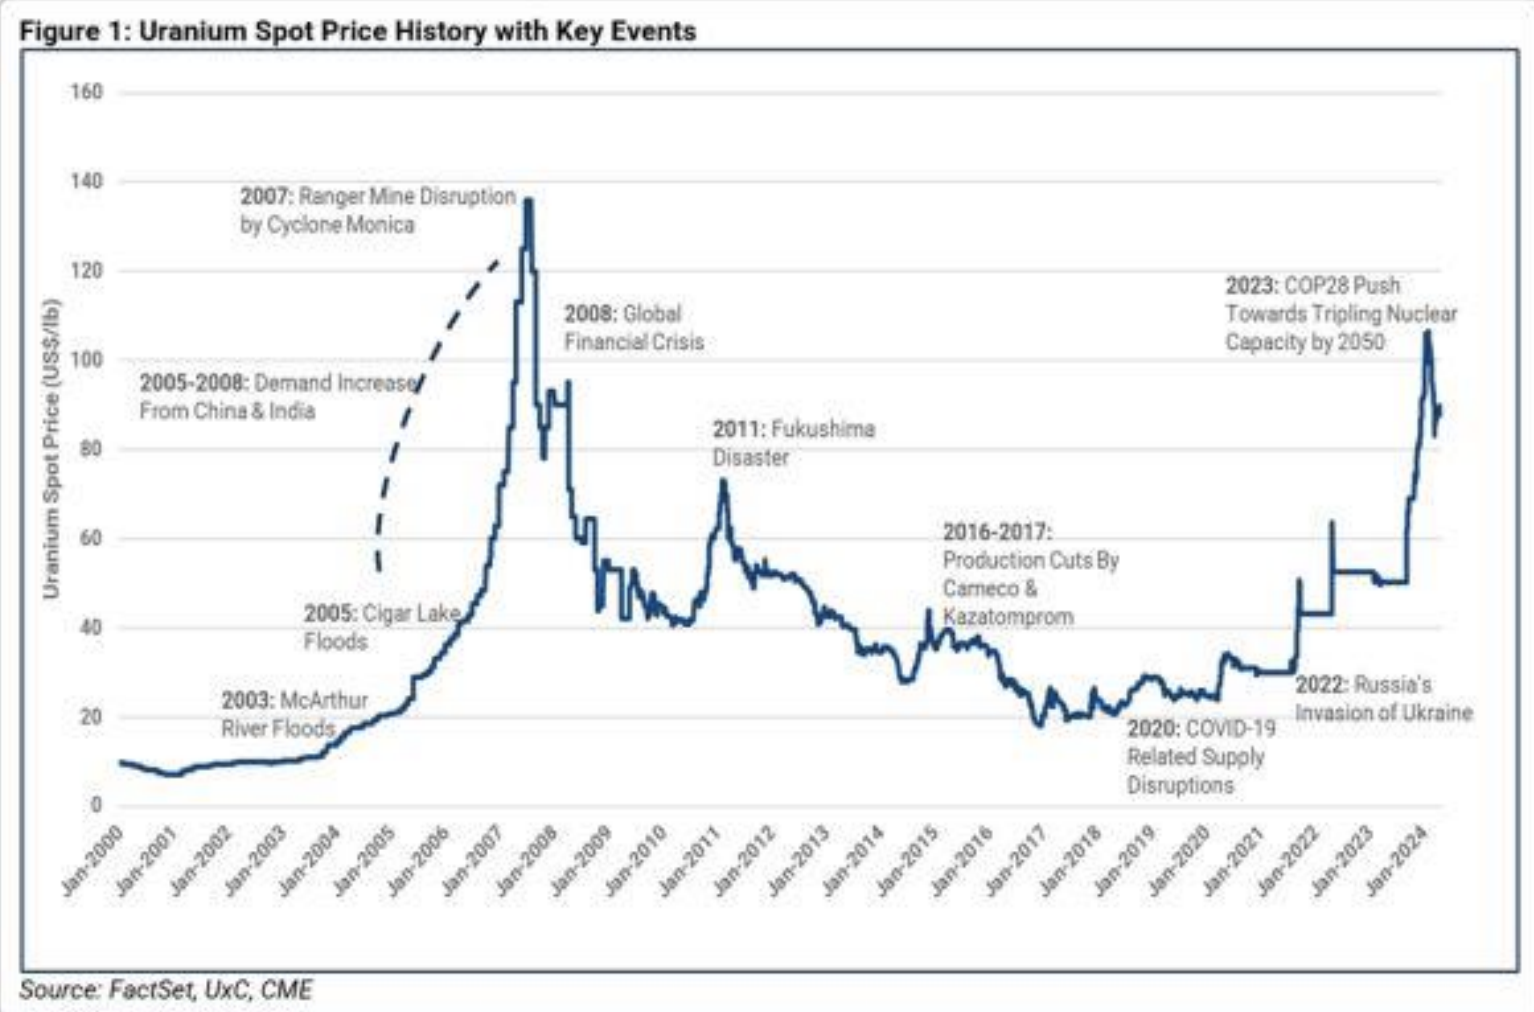
2018–2020: Market balance improves, but new forces emerge. By 2018–2019, the persistent primary supply deficit (mines produced less than reactors consumed) finally began to register. Japanese utility stockpiles, which had flooded the market via “secondary demand” as Japan sold excess fuel, were depleting. One of the most misunderstood features of the 2011–2020 uranium bear market was the role of Japanese inventories. After Fukushima, Japan shut down its reactor fleet, but utilities continued taking delivery of previously contracted uranium. With reactors offline yet contractual obligations still in force, Japan accumulated one of the largest civilian uranium stockpiles in the world. Over the following decade, the gradual liquidation of this inventory acted as a persistent secondary supply source, effectively masking the emerging primary mines deficit. From roughly 2014 through 2020, Japanese selling absorbed tightening fundamentals elsewhere in the market. Today, that buffer has largely been depleted. With Japanese inventories normalized and reactor restarts progressing, the market no longer has this structural pressure valve. The disappearance of this secondary flow is one of the key reasons the current tightening cycle is more durable than prior rallies.
The result was that by 2020, uranium prices had quietly moved up from their bottom. Then, an unexpected catalyst arrived: financial investment in physical uranium. In mid-2021, the Sprott Physical Uranium Trust (SPROTT) [TSX: SPUT] launched and began buying millions of pounds on the spot market, sequestering them in a vault. This effectively introduced a new class of “buyers” that are neither utilities nor producers, but investors betting on higher future prices. The entry of such financial entities, along with geopolitical concerns (e.g., Russia’s 2022 invasion of Ukraine), set the stage for uranium’s ongoing upswing. By 2022–2023, spot prices had doubled off their lows, and by early 2026, they had pierced the $100/lb level again. Unlike 2007, however, this rally is occurring alongside a robust rise in term contracting by utilities and genuine supply-chain bottlenecks (in conversion and enrichment) that make the situation more fundamentally grounded. The bottom line is that uranium’s market structure and pricing have historically been driven by cycles of capital discipline and overshooting. Low prices in one decade sow the seeds of the next bull market by discouraging exploration and mines development. Years later, when demand catches up, and secondary supplies can no longer fill the gap, a supply crunch ensues, and prices spike, often overshooting the level needed to incentivize new production. Then, as new projects finally come online, another period of surplus and price decline sets in. This pattern has played out at least twice (1970s boom and bust, 2000s boom and bust), and the current cycle may be midway through another such iteration, albeit with some new twists discussed next.
Back to Today: What’s the Future of Uranium Trading?
Convergence of three trends. The uranium market of the late 2020s is at an inflection point where three forces are intersecting: (1) financialization of the spot market, (2) expansion of hedging mechanisms, and (3) fuel-cycle bottlenecks shifting value within the supply chain. These trends are reshaping how uranium is traded and priced, even as the underlying contract-driven structure remains intact.
- Financial players are amplifying spot volatility, but utilities still set the tone.
Uranium will likely remain primarily a long-term contractual market because utilities cannot run reactors on volatile spot purchases without risking fuel shortages. TradeTech emphasizes that the long-term market dominates nuclear fuel trade, while the spot market plays a relatively small role in actually supplying reactors. However, the visible price (spot) is increasingly influenced by financial demand. Vehicles such as the Sprott Physical Uranium Trust (SPUT) and Yellow Cake plc have become structural buyers of physical uranium, removing material from the available float. When these vehicles trade at premiums and raise capital, they can drive incremental spot buying; when they trade at discounts, buying can pause, increasing volatility. This financial activity can force utilities to react by accelerating term contracting, reinforcing the long-term price.
- A slowly maturing futures market will improve uranium’s liquidity.
A defining feature of uranium has been the lack of a deep, exchange-traded market. The 2007 NYMEX uranium futures were an early step, but liquidity remained limited for years, leaving utilities and producers reliant on contract structures and bespoke hedges. This is gradually changing. CME/NYMEX uranium U₃O₈ futures still exist (linked to UxC pricing), and participation has been building, supported by improved index publication and contracting tied to reference prices. Over time, better hedging tools could broaden participation, improve price discovery, and provide producers and utilities more flexible risk management—though greater liquidity can also introduce more financial volatility.
- Fuel-cycle bottlenecks are shifting the focus upstream.
Perhaps the most important change versus a decade ago is stress beyond mining, particularly in conversion and enrichment. In the 2010s, excess enrichment capacity enabled “underfeeding,” creating a meaningful secondary uranium supply. Today, the situation has flipped: as Western buyers reduce reliance on Russian enrichment and capacity tightens, the industry shifts toward “overfeeding,” which increases natural uranium consumption per unit of enriched output. The result is additional pressure upstream at the uranium level, alongside sharply higher conversion and SWU prices. For market participants, the classic mine supply vs reactor requirements framework is no longer sufficient; the fuel cycle meaningfully changes effective uranium demand.
- HALEU and advanced reactors: a wildcard demand source for the 2030s, with near-term implications.
Another development is the rise of SMRs and advanced reactor designs, many of which require HALEU (5–20% enriched uranium). While large-scale deployment is primarily a 2030s story, the fuel-cycle implications are already relevant: HALEU is difficult to supply at scale and increases strategic focus on enrichment capability and domestic fuel security. Governments are increasingly becoming active participants via programs and inventories designed to secure future supply chains.
A concrete example is Oklo, whose first core is intended to use HALEU derived from recovered legacy material under DOE involvement. While this is not the main driver of near-term mine demand, it illustrates how advanced reactors can pull policy, enrichment capacity, and strategic fuel arrangements into the pricing and trading narrative.
- A structurally tight market at least until new mines and facilities come online.
Pulling these threads together, many observers expect uranium to remain tight through the rest of the 2020s: utilities are returning to term contracting, financial vehicles can tighten the spot market, and fuel-cycle constraints increase upstream pressure. On the supply side, meaningful new production takes time. Projects such as NexGen’s Arrow represent potential tier-one additions, but permitting, financing, and development timelines mean large-scale greenfield supply is unlikely to materially rebalance the market before 2030. Beyond that point, the industry could face a tug-of-war between new mine supply and incremental demand growth from life extensions and SMRs.
All of this has contributed to stronger uranium pricing into 2026, alongside sharp increases in conversion and enrichment pricing. The key risk is that uranium cycles can turn violently: demand shocks, macro slowdowns, or a reversal in financial flows (including SPUT dynamics) could create short-term dislocations. But absent such shocks, the structural setup remains one of constrained supply response and elevated strategic value.
Trade Idea
We suggest a Relative Value play between spot uranium and uranium miners (long SRUFF vs short URNM), predicated on a sector rotation from miners into spot. We are currently seeing a decoupling where equities have front-run the commodity to a point of exhaustion, with uranium miners’ ETF up 30% to the start of the year. Meanwhile, the physical market is a coiled spring due to regulatory bottlenecks and supply-side shifts.
As mentioned briefly earlier, the uranium market is structurally unlike other commodities in the sense that it is legally prohibited to take physical delivery due to the highly regulated and radioactive nature of yellowcake. The futures market is functionally illiquid for speculation, with wide bid-ask spreads, and is designed as a hedging tool for utilities rather than for speculation. Sprott Physical Uranium Trust (SPUT) bridges this gap and acts as a licensed intermediary via its At-The-Market program. First, when trading at a premium to NAV, it automatically issues new units to the market and uses this cash to enter the market as a “whale buyer”. The trust buys physical uranium and moves it into its own account at secured facilities under its mandate to “buy and hold”, effectively operating as a price-insensitive buyer in an inherently thin market.
Today, SPUT has amassed a $70 million “war chest” which it has so far been unable to deploy due to ongoing negotiations with the OSC (Ontario Securities Commission). Once these negotiations conclude, SPUT will re-emerge as a large buyer, which is an important catalyst for this trade. This resembles prior squeeze-like setups, e.g., Q3 2023, where physical tightness became self-reinforcing.
We believe the system is also at an inflection point because the “Post-Fukushima Buffer” has officially been exhausted. For a decade following the 2011 disaster, the market was defined by an inventory overhang while Japan and Germany shut down reactors, turning utilities into forced sellers. This led to a cycle of carry trades that cleaned out global mobile inventories (secondary supply) to bridge the gap during years of mine supply curtailment by giants like Cameco and Kazatomprom. By late 2025, the industry acknowledged this inventory overhang had ended, helping drive the structural shift from a buyer’s market to a seller’s market.
This shift is visible in contracting: old fixed-price contracts from the early 2000s are expiring, and new contracts are being increasingly negotiated at market-referenced prices with massive spreads ($70+) between ceilings and floors, reflecting producer confidence. Fuel buyers have no option but to adhere as they are extremely price inelastic. On the demand side, while realistically natural gas will fuel AI demand through 2030, Big Tech has already entered the nuclear market through either direct Power Purchase Agreements (PPAs) and reactor restarts, bringing with it a speculative fever that the physical market has yet to fully price in. Additional upside catalysts include sovereign stockpiling (US/EU fuel concepts), and the potential for tech players to secure direct offtake deals with emerging producers (or invest in conversion/enrichment), which can further tighten near-term availability.
Supply constraints remain strong, and large new supplies, e.g., NexGen is unlikely before 2030 due to the supply inelasticity of the uranium market. Kazakhstan is also renegotiating JVs, shifting towards higher state take from 50/50 to 75/25 or even 90/10, increasing the incentive for higher pricing. Meanwhile, Western utilities are unlikely to benefit from one of the largest ongoing nuclear projects – the Budanovskoye project – cofunded by Russia and Kazakhstan, which further tightens the marginal availability that sets prices.
Because SRUFF (currently trading at 28.6 CAD) and URNM (69 USD) are in different currencies and have different betas, we anchor to relative returns rather than price levels. Let  be the % return of SRUFF, let
  be the return of URNM. define spread PnL (beta adjusted) by
  where h is the hedge ratio, which is chosen to be less than 1 as miners typically have higher vol than physical. We assign roughly 45% probability to a base-case rotation where spot outperforms miners (+8-15%), 28% to a squeeze scenario tied to SPUT re-engagement (+15-30%), 10% to a risk off widening discount drawdown (-8-15%) and 2% to a demand destruction event eg nuclear incident (-20-40%), implying a practical framework of taking profit around +10-20% or resizing after the +10% mark. A soft stop would be around -8%, where we would reassess the timing of the catalysts, with a hard stop at -15%. This gives the trade a risk-reward profile of around 1:1.9.
The key catalysts remain the removal of inventory overhang, price inelastic fuel demand, structural supply constraints, and SPUT reengaging in the market alongside a tech company nuclear push. The key risks are mainly the increased building of enrichment facilities
As the trade progresses, the short URNM leg can shift from hedge to drag. If spot begins moving and SPUT re-rates miners can recouple and rally with higher beta, compressing the spread upside. At that point, we believe it is better to cover the short and remain outright long SRUFF to keep exposure to the structural bull thesis without fighting miners’ leveraged upside.
Overall, this trade expresses a short-term rotation within a structural bull market. We are not betting against miners fundamentally, but rather, we are positioning for mean reversion in relative performance as the physical market reasserts price leadership. Should spot break higher and miners recouple, the structure allows us to transition from relative value to outright long exposure.
References
[1] Cameco Corporation (2024) Annual Report 2024. Saskatoon: Cameco Corporation. Available at: https://www.cameco.com (Accessed: 14 February 2026).
[2] International Atomic Energy Agency (IAEA) (2023) Nuclear Power Reactors in the World. Vienna: IAEA. Available at: https://www.iaea.org (Accessed: 14 February 2026).
[3] Sprott Physical Uranium Trust (2025) Management Discussion & Analysis and ATM Program Disclosure. Toronto: Sprott Asset Management. Available at: https://sprott.com (Accessed: 14 February 2026).
[4] UxC, LLC (2025) Uranium Market Outlook and U₃O₈ Price Indicators. Roswell, GA: UxC LLC. Available at: https://www.uxc.com (Accessed: 14 February 2026).
[5] World Nuclear Association (WNA) (2025) Supply of Uranium. Available at: https://world-nuclear.org/information-library/nuclear-fuel-cycle/uranium-resources/supply-of-uranium (Accessed: 13 February 2026)


0 Comments