The use of Copper and Gold
Can commodities help us predict future interest rate movements? In this article, we will analyze the relationship between the spot prices of copper and gold and the ratio between them to predict future interest rates. Copper is used in the majority of industries such as semiconductors and wiring. Gold is quite the opposite, in the sense of the metal not being used for industrial production, but rather its financial value as a safe storage of value.
Copper, Gold and the Economy
Copper is a material commonly used in electronic equipment. The world’s largest supplier is Chile and more than 20 million ktons are produced on average every year as of today.
Due to the high usage of copper in industrial and technological sectors, if there is an economic slowdown or a recession, production is scaled back, and since supply is relatively constant, the demand for copper decreases, lowering the price. Additionally, as the industrial sector is often the one-hit first and toughest from economic problems this change in price is often quite extreme. Thus, copper is a cyclical metal which in times of economic expansion increases in value and a recession decreases in value. This can be seen in the diagram below, where the grey highlighted times are times of economic crisis.
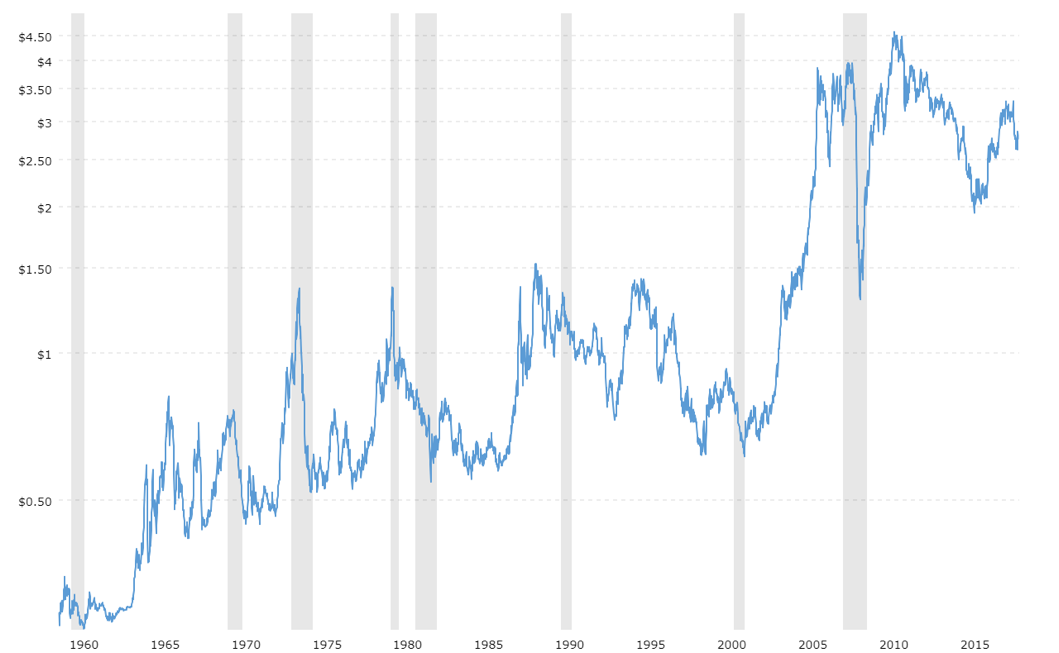
Source: Macrotrends
Gold, on the other hand, is seen as a store of value due to its rarity and, as sometimes argued, its financial history. In times when other assets perform poorly or uncertainty quells the markets, holding gold is often the way to go for many market participants. Except for the period between the end of WW2 and the Nixon shock we can see that in general gold prices increase in anticipation of or during crises
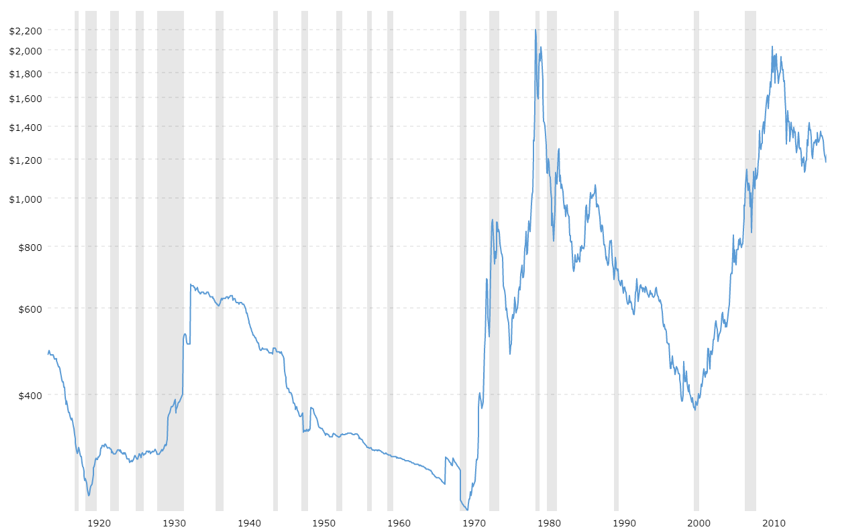
Source: Macrotrends
Copper/Gold Ratio and Treasury Yields
It is this contrasting usage of the two metals that give rise to a very interesting ratio. The copper-gold ratio. It is quite simply found by dividing the price of copper by the price of gold. The absolute value of the ratio standing by itself is quite insignificant. However, when examining the values over time this changes. In theory, the copper to gold ratio should increase in good economic times due to a decreasing price of gold and an increasing price in copper due to a healthy industry, while the opposite should happen during economic downturns. The predictive power of copper-gold stems from the distinct roles of industrial versus precious metals, the former rooted in the physical and the latter in the finance working inversely in economic environments.
There is another financial instrument which is often associated with being relatively safe as an investment where one aspect of its value behaves like the copper/gold ratio. This instrument is the US 10 year government bond. When struggles are ahead investors often flock to the 10-year bond driving up prices and thus lowering the yield on it. On the other hand in good economic times, other investments seem more attractive and investors sell the 10-year US government bond driving up yields. Ignoring the fact of a, in general, lower interest rate environment throughout the last decade, this is confirmed by the chart below.
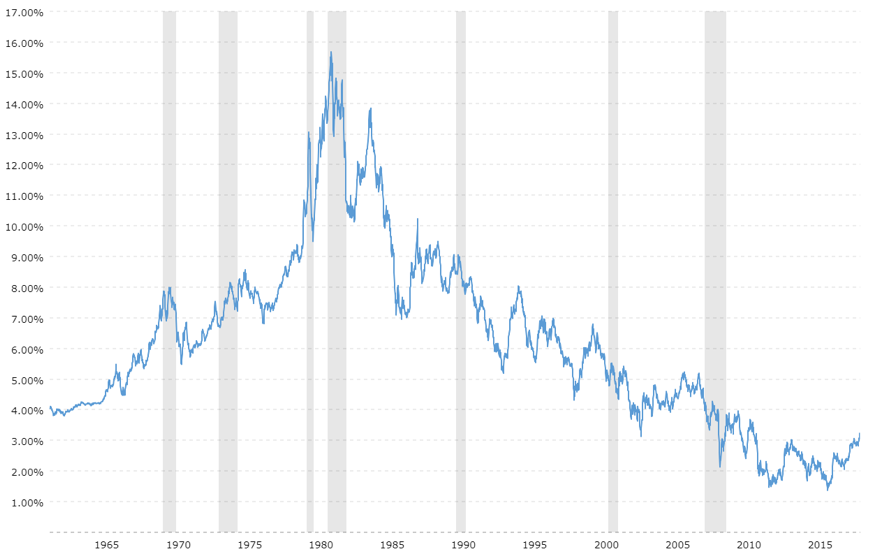
Source: Macrotrends
The relationship between C/G and 10Y rates
When analyzing the relationship between those two variables we need to take into account a few factors. First of all, as copper and gold are commodities, inflation tends to increase their respective prices over time, making it so that in the long run the copper-gold ratio remains more or less the same, with deviations depending on the economic cycle.
Second, the relationship between yields and the ratio is not direct. It is not the absolute value of the C/G ratio that matters, but rather its direction, which should be the same as the change in yield. This again is because in the long run rates lowered and lowered while the C/G remained constant in the long run.
To solve those problems we can analyze the rolling 50 months correlation between those variables. This way we can solve both of the previous problems and test whether a relationship exists between those two parameters.
50-day rolling correlations
As we can see from above, in the past 24 year 10Y yields and the C/G ratio have more or less always been correlated with each other, especially since the financial crisis.
We can see that in the aftermath of the dotcom bubble the correlation suffered a sudden crash. We can hypothesize that this is because at that time the ratio was particularly stable in those years, and didn’t change in either direction.
In conclusion, while a relationship exists between spot prices of commodities, gold and copper in particular, and interest rates, this relationship cant help us predict rates, as the C/G ratio and yields move together at the same time, with neither being a leading indicator over the other.


0 Comments