Introduction
Renewable energy sources are finally gaining traction, pushed by the international community rushing to slow down climate change before consequences become unrepairable. But the shift towards clean energy has much deeper and structural roots from geopolitics to economics, that explain why certain countries have invested with more or less conviction. This article, the first out of two on the renewable sector, will explore the underlying industry dynamics and showcase the challenges that still loom over the industry.
Global Energy Market
Overview
Renewable sources accounted for 19,408 TWh, around 12.5% of total energy consumption (154,619 TWh) in 2020, according to BP Statistical Review of World Energy. Currently having a value of $613.7bn, the renewable energy sector is expected to continue its growth in the future, reaching a $1.1tn valuation by 2027.
The main unit of measurement for power is watt, which should not be confused with watt-hour, which is a measurement of energy, a separate physical quantity. Power is the rate at which energy is generated or consumed and is measured in watts. For example, a 50W light bulb draws 50 watts of power at any time, and if it works for an hour, it has drawn 50watt-hours of energy. Power plants can be rated by different units. The “capacity” of a plant is the maximum power it can produce at any time, therefore is measured in power units. Its output, however, is the energy production over a period of time and is measured in energy units, typically megawatt or gigawatt hours. For reference, Three Gorges Dam in China, the largest dam in the world, has a capacity of 22.5 GWs and produced 112 TWhs of energy in 2020.
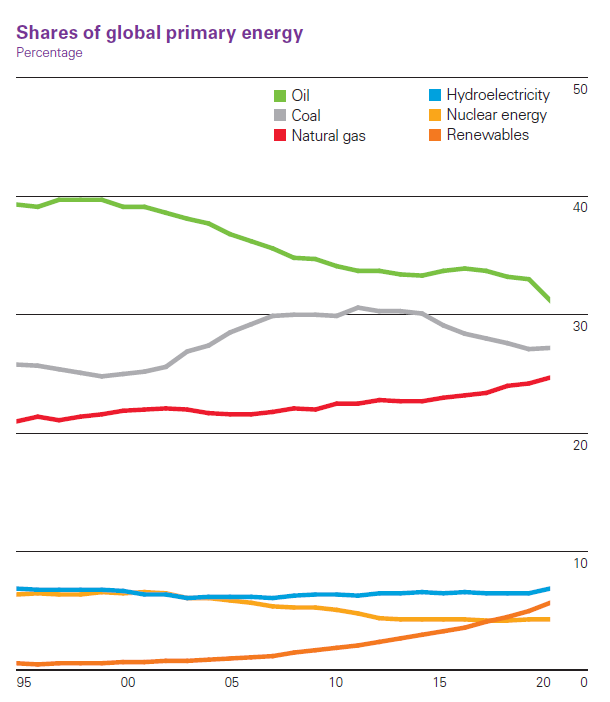
According to Our World In Data, renewables have been increasing their shares continuously since 2000, producing 10.7% of worldwide energy consumption in 2019, up from 7% at the start of the millennium. Currently, however, 84.3% of the world’s energy consumption still depends on fossil fuels. One notable trend is the increasing share of natural gas, replacing more carbon-intensive resources like coal and oil.

Source: BP, Statista
BP and the International Energy Agency regularly publish predictions for future energy consumption. Organized along a few different scenarios like net zero by 2050, exact statistics may vary. The chart above demonstrates predictions based on the “business-as-usual” scenario, in which no drastic action to limit fossil fuels is taken. All scenarios, however, agree that the share of renewables will keep rising in the next decades, surpassing 20% by 2050.
Source: BP Statistical Review of World Energy 2021
Main Renewable Energy Sources
Hydroelectric power – Valued at $202bn in 2019 with a production of 1308 GW and projected to reach approx. 1498 GW by 2026 and $318bn by 2027, hydropower is the dominant source within the renewables sector, comprising 58% of the total energy generation from renewables (according to Our World In Data). Allied Market Research projects that the global hydropower generation market will grow at 5.9% CAGR from 2020 to 2027. There are two conventional hydroelectric facilities:

Compared to wind power or solar power, the energy supply of hydro is less elastic as it requires larger and more long-term investments that may take years to become operational.
Wind power – Valued at $62.1bn in 2019 with a total generating capacity of 743 GWs in 2020, and it is estimated to rise up to 1000 GWs by 2025, wind power is the second most important source of energy in the renewables landscape, representing roughly 21% of the total production from clean energy (according to Our World In Data). According to Allied Market Research, the sector itself is estimated to grow at a considerable CAGR of 9.3% from 2020 up to 2027.
There are mainly two alternative types of wind farms, which both revolve around the use of wind turbines:

Solar power – Valued at $52.5bn in 2018 with a total output of 773 GWs in 2020 and it is forecasted, in a best case scenario, to reach 2 TWs by 2025, solar power is the renewable energy that is growing the most in the recent years. According to a report by Allied Market Research, the value of the industry is expected to increase at a compound annual growth rate of 20.5% from 2020 to 2026.
There are fundamentally two competing solar energy technologies available in the market:

Growth Drivers
Increase of world leaders attention to the climate cause
For the world to reach net zero by 2050 (the commitment taken by the majority of OECD countries after the Paris agreement in 2015), renewable energy technologies will require a massive increase in investment. The funding would be distributed largely to the markets with the greatest economies and those who are now the most behind in their transformation. China would require €373bn in investment by 2028, the United States €157bn, and among EU countries – Germany €50bn, France €13bn, Belgium €13bn. Funding for the energy transition will be needed on a scale that neither companies nor governments can provide on their own; it will require both private and public sector investment. Innovative technologies and projects may be de-risked, made bankable, and deployed more quickly by using a hybrid public-private funding approach.
The requirement for significant development in renewable energy addresses both elements of the Paris Agreement – react to the threat of climate change and promote sustainable growth. Governments would also be wise to begin giving incentives to early-adopter energy firms to stimulate a quick increase in investment. China was the primary driver of renewable energy development, accounting for over half of the worldwide increase in wind and solar capacity. According to statistics provided by China’s National Statistics Administration at the end of June, Chinese wind capacity (72 GW) has notably risen from 210 000 GW in 2019 to 282 000 GW in 2020, and some of the stated increase is likely due to changes in Chinese subsidy and accounting procedures. When looking at the data over a longer term, wind and solar capacity more than doubled between 2015 and 2020, growing by almost 800 GW, or 18% on average every year.
Regarding Europe, the Renewable Energy Directive establishes guidelines for the EU to meet its objective of reaching a 32 % share of renewable energy by 2030. The incorporation of renewable energy sources (RES) into the energy mix can also help with other conventional EU energy policy aims, such as increasing energy price competitiveness and lowering dependency on imported fossil fuels. Furthermore, the promotion of renewable energy may provide new possibilities for local employment, assist EU manufacturers maintain their leadership in green technology, and contribute to overall economic growth.
By 2030, the US energy mix is expected to be only 10% renewable. When the benefits of improved health and fewer CO2 emissions are considered together, the needed investment of $86bn per year may save the US up to $140bn per year by 2030.
Geopolitical ramifications
Besides the mounting public pressure on governments to push towards renewables for environmental reasons, there are also other deep economic reasons to switch to renewable energy sources. Arguably one of the most important reasons is securing domestic energy supply independent of external geopolitical influences. This became painfully evident in recent months in Europe as gas prices spiked due to a tightening of Russian exports. The dependence of the EU on the pipeline Nord Stream 2, stresses the importance of increasing the energetic independence through heavily investing in the renewable energy sector.

Source: Eurostat
In the EU, oil still remains the most important energy source for the European economy. Natural gas comes second, with renewables and biofuels rapidly catching up in recent years. With winter approaching, storage levels in Europe are already considerably below the typical for this time of the year, which has been the primary driver of the recent energy price increase in the region.

Source: Eurostat
The lack of domestic energy supply and increasing dependence on imports has been addressed in China as well. Despite efforts over the last year to stockpile coal and natural gas, China is at risk of running out of fuel as competitors in North Asia and Europe battle for a finite supply. As income levels rise, consumer preferences are increasingly shifting towards health, pollution awareness, and a greener economy. Planning to catch-up with the rest of the world, China has made great progress in the field of renewable energy, and by 2021, it possesses the world’s largest wind generating capacity.
Despite the rising market share of renewable energy, the United States continues to rely largely on its oil and natural gas surplus. The bulk of the energy utilized in the United States has come from coal, oil, and natural gas. In 2020, such fossil fuels accounted for around 80% of the nation’s energy consumption. Despite the fact that coal usage has declined in recent years, natural gas consumption has grown. Even though the US lacks the geopolitical incentive to implement renewable energy sources, the political environment has pushed towards a greener economy. President Joe Biden has set objectives for combating climate change, including halving US carbon emissions by 2030 and achieving a net-zero carbon economy by 2050. The plan calls for power generation, which economists believe is the easiest economic sector to “turn to green” by 2035.

Source: US energy Information Administration
New-found cost-effectiveness
Despite the political resolve and the geopolitical advantages pushing towards larger adoption of renewables, the key economic variable that made the change possible is the cost of energy generation.
Indeed, the past decade has seen an incredibly steep decline in costs for renewables that became reliably cheaper than coal around the mid 2010s. In particular in the US, the Levelized Cost Of Energy (LCOE) for Solar PhotoVoltaic has dropped by 90% since 2009 and Wind power has dropped by 70% in the same period, versus a 30% reduction in Gas energy production. It is important to note that LCOE is an industry specific measure that comprehensively accounts for every cost involved (including discounted depreciation of assets and future maintenance costs), thus it might not reflect the real profitability of the industry as investments are being made and economies of scale are often yet to be met. It also includes government incentives as a factor, therefore these numbers are to be taken with the due disclaimers, but they indicate a systemic shift nonetheless.
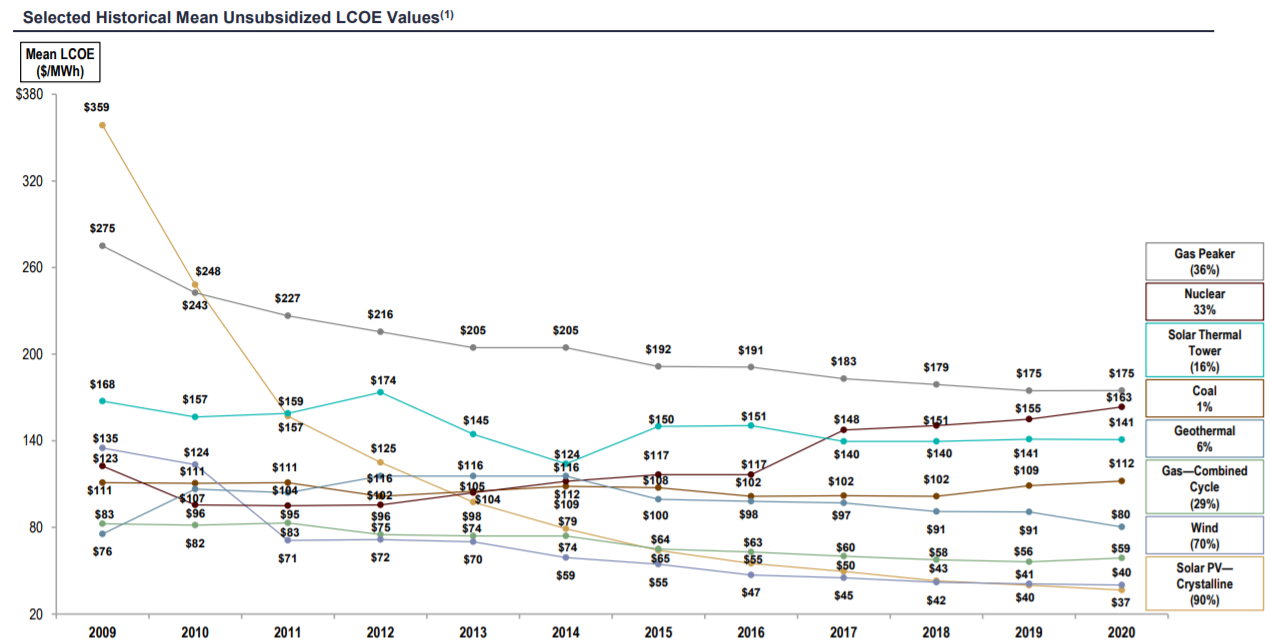
Source: Lazard’s levelized cost of energy analysis — version 14.0
Potential Issues
As we have seen so far, there are deep economic reasons why renewables are finally becoming a major source of energy. However, there are still important challenges to be overcome before the world can start relying on them entirely.
Unreliable generation and storage technologies
The first challenge in fully completing the transition has to do with the fact that energy generation can fluctuate unpredictably and is not available constantly – sometimes the sun will not shine, wind will not blow, there could be droughts, etc. Such instability could lead to difficulties in meeting supply and demand especially intraday and where there is a seasonal pattern. An increasingly viable remedy for this, that is now the focus of attention, is to store the energy generated and use it when needed. This requires efficient long-duration storage technologies, which are being continuously developed. An example for such a solution is high-capacity batteries.
The price of lithium-ion battery technologies – the most common type of batteries used in everything from mobile gadgets to grid storage and electric cars – has fallen significantly (by 97% according to OurWorldData) in the last three decades: from $7500 for a 1kWh in 1991 to $181 for the same capacity in 2018. The chart below shows the price trend of lithium-ion batteries in the period from 1991 to 2018.
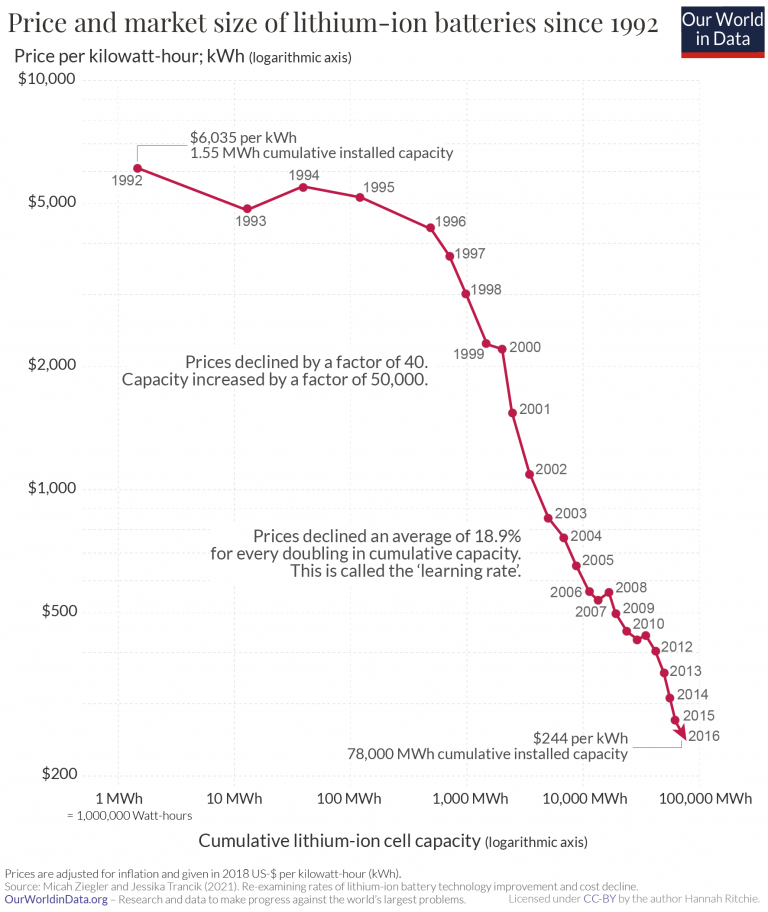
Source: Our World in Data
With the increasing share of variable renewable energy into the electricity system and the above-mentioned cost reductions in battery productions, demand for battery electricity storage is rising, especially for longer duration energy storage. This will further reduce the cost of battery modules and contribute to rapidly reducing the costs for installation of stationary battery electricity storage (BES) systems. However, the least-cost solution is uncertain, since energy storage technologies as a solution will be competing with other ways of managing the fluctuations in renewable energy generation, such as concentrating solar power (CSP), reservoir hydro, power-to-gas, or power-to-hydrogen, among others. In any case, renewable energy storage is not a concern for the days to come – the relevant technology is developing innovative solutions continuously and rapidly.
Shrinking margins in the renewables industry
The second main issue, however, is painting a bleak decade for renewable companies. Indeed, there are several factors that have severely impacted the profitability of the sector in the past years as the industry is developing.
The first is the drop in global energy prices ever since the 2015 oil glut caused by oversupply in the US. Since then, it has not recovered to previous levels due to the abundance of oil from the fracking boom in the USA. As we can see from the figure below, the global price index further dropped in 2020 for the fall in demand caused by the pandemic which is projected to rebound in 2021, but then only slowly increase. These low prices are squeezing the margins and potentially hindering the investments, thus pressing politicians to find creative approaches to provide incentives and make investments. We will further explore this topic in the next article of the series, but for now suffices to say that it might generating mixed results.

Source: Statista
In particular, the government and market pressure on the energy incumbents have pushed them to make sudden and heavy investments in the sector. Companies from BP Plc to TotalEnergies SE are willing to potentially overpay for clean energy assets as they transition away from fossil fuels. This sudden and heavy inflow of investments is boosting competition and compressing margins for developers. Wind giants Orsted A/S and Vestas Wind Systems A/S reported lower returns in 2021 as rising competition is being met by a limited pipeline of projects. For instance, auctions for offshore wind sites in the U.K. (which represents almost 20% of the installed active sites) saw record prices earlier this year as oil companies led by BP battled for the right to develop projects in the Irish Sea.
The last piece of the puzzle is the spike in raw materials price in 2021, which stopped the decades long reduction in solar and wind energy costs.
Shares in solar companies have fallen by 18 per cent this year, after more than tripling in 2020, according to the MAC Global Solar Energy Index, as companies face higher steel, polysilicon, and freight costs. This has also impacted turbine makers such as Siemens Gamesa Renewable Energy SA, which lost money as materials rallied.

Source: Financial Times
If you add to the mix the cost of shipping, which skyrocketed due to the global pandemic, we can see the list of challenges facing renewable energy companies getting longer by the day. Indeed, this is a significant issue because producers of green power tend to strike deals to sell the electricity they produce before construction even begins. While that strategy helps them obtain financing, it may also leave them exposed to swings in the cost of materials.
Conclusion
Looking at the aggregate data a sense of wary optimism seems justified. The international community seems committed to reach the emission goals also thanks to the increasingly viable and cost-effective renewable solutions. However, it might not be enough. Indeed, it is evident that the industry is getting crowded and the inelastic supply, combined with the increase in raw materials costs is severely impacting the margins. The international community’s answer to push capital in the industry despite short-to-medium-term unattractiveness was “Green finance”. This is a set of regulatory and fiscal incentives that constitutes the strength of ESG investing philosophy. It is a very powerful idea that is really helping gathering capital where it is needed, but it has its weaknesses and creates a series of unforeseen market dynamics that are been exploited by investors in different ways. The following article in this two-installment series will focus on the opportunities that “green finance” opened in new and old energy.


0 Comments