Introduction
Traditionally, the carry factor has been associated with a trading strategy in the FX markets. For decades, practitioners and academics have thoroughly studied the phenomenon by which currency speculators were regularly profiting from deviations from the uncovered interest parity condition. Borrowing in a low-interest rates currency (e.g. the Japanese Yen), investing in high-interest rates one (for example the Australian Dollar) and then converting the money back in the original currency, they could lock in some profit while repaying the original debt. The strategy exploited differences in interest rates but bore a risk too. The excess return was granted by the fact that investors expected spot rates to move more sluggishly than forward rates so that, at maturity, the exchange rate would have been closer to its original value rather than to the forward value.
As the understanding of FX carry trades became more widely spread and established, subsequent academic publications have explored potential applications of the carry concept across other asset classes, looking for evidence of a potential carry premium to be exploited.
What is carry?
Taking a step back, it is quintessential having clear in mind the meaning of carry and its different nuances before delving more into the technicalities of trading strategies. Essentially, you have to carry when you’re investing in a higher-yielding security while bearing lower funding costs. That’s the case when setting up a long-short strategy with two bonds trading on different curves, with one higher than the other. Or, trading two bonds on the same curve but with different maturities. The gains from such portfolios can be disentangled into two components:
- the yield pick-up, that is approximately the (positive) difference between the two yields. This is what is referred to as carry or level;
- the repricing of the bond as it rolls down the yield curve. As time passes, the bond value increase as term risk decreases. Mathematically, you are discounting the cash flows at a lower rate, hence generating a higher PV. Of course, a backward-sloping yield curve would make this component negative. This component is what is referred to as roll-down.
In the simple long-short strategies above, it is clear that you’re buying the security with the higher carry and selling the one with the lower.
The fixed income carry factor
This strategy started to spread out after the publication in 1972 of “Inside the Yield Book” by Leibowitz and Homer, who explicitly defined “rolling yield return” as the combination of the bond’s periodic income earned and the additional price gain from the term structure premium. This return is computed under the similar premise of the FX carry trade, that is, the yield curve is assumed to remain unchanged during the bond holding period. It comes as a natural consequence that fixed-income investors would not always invest in bonds with maturity matching their investment horizon but instead might consider and, eventually, prefer longer tenor bonds which would expose them to the carry factor. Specifically, the slope and the curvature of the yield curve determine the extra roll-down component of the carry.

Source: FTSE Russell
Targeting segments of the yield curve
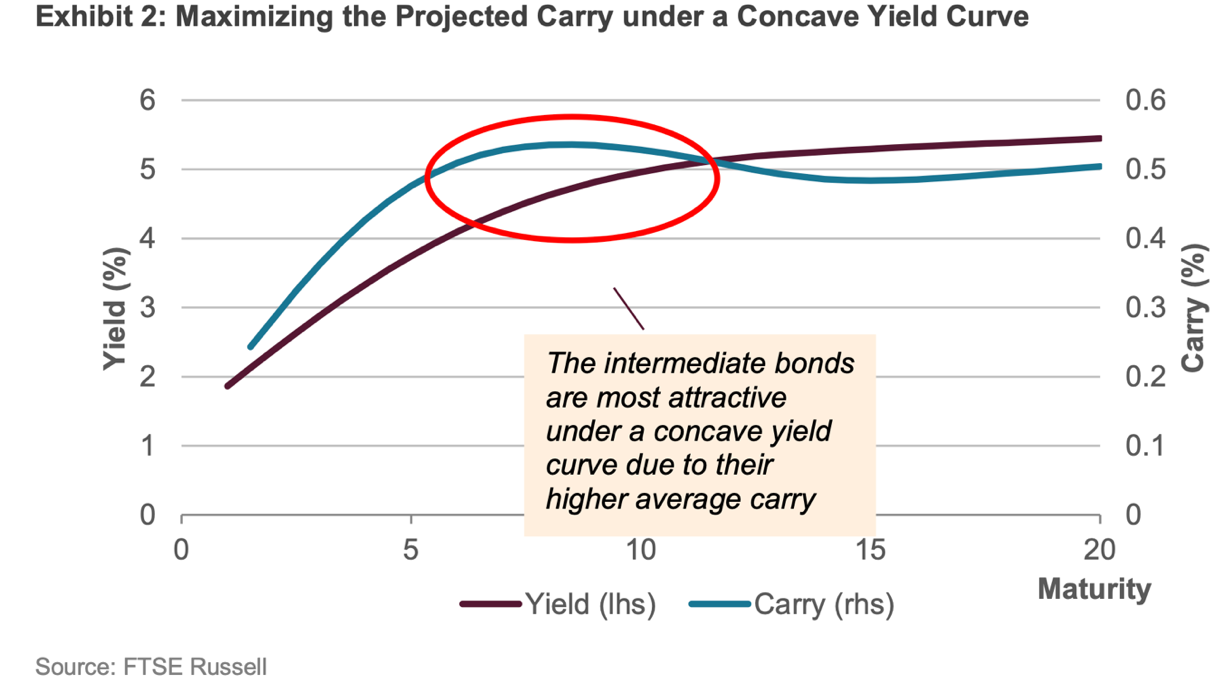
In normal times, yield curves tend to be positively sloped, thus compensating investors for holding bonds with longer tenors which entail greater inflation and interest rate risks. On the one hand, whenever the yield curve shows concavity, it is worth targeting the intermediate term-bonds which show more attractive carry.
Source: FTSE Russell
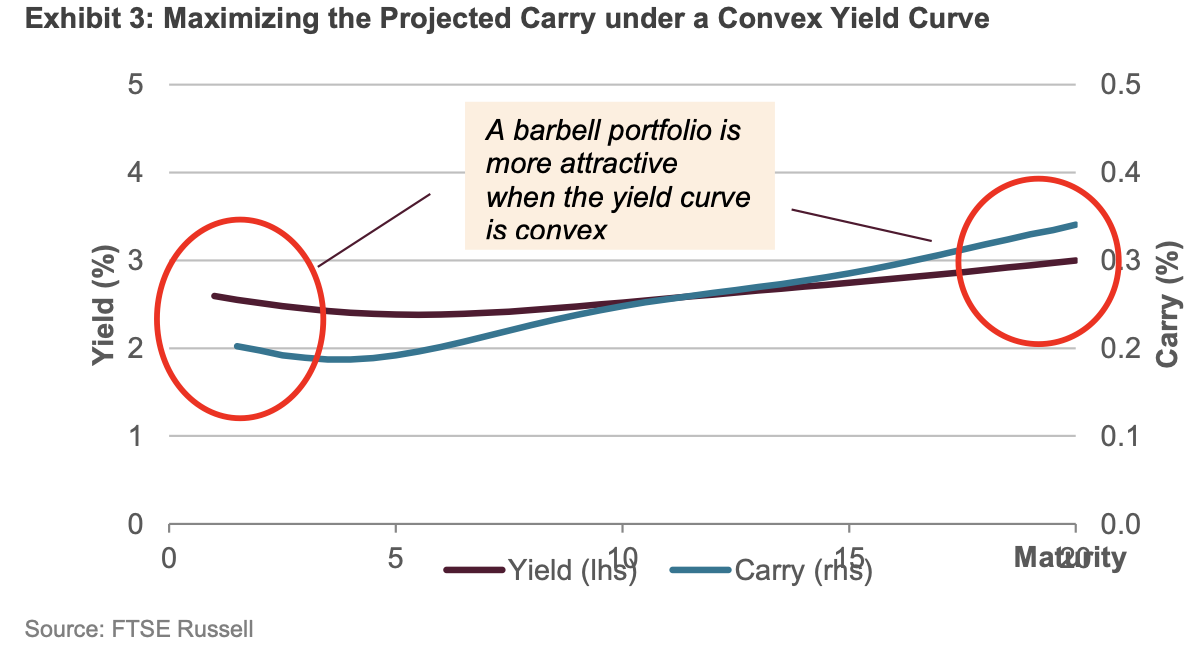
On the other hand, when the yield curve shows convexity, the suitable carry factor strategy can be a barbell investing in short-term bonds at one end and in long-term ones at the other end, thus maintaining a medium-term duration. The strategy reduces interest rate risk as short-term bonds can be reinvested in a rising-rate environment; at the same time, it benefits from the higher yields of the long-term bonds.
Source: FTSE Russell
This latter approach allows investors to obtain a strategy which can increase the carry factor exposure while leaving unchanged the interest rate one. It could be inferred by the above picture that it would rather be recommendable to invest merely in the carry of the long end, but actually, this would entail additional interest rate risk for investors since it would push them away from the duration of the benchmark. Therefore, the optimal strategy remains to include also the short-term bonds. Such a portfolio would need to be re-optimized and rebalanced monthly based on the prevailing yield curve at the time, thus ensuring its duration matches closely one of the benchmarks.
Empirical evidence across different sovereign bond markets
Studies conducted in five different sovereign bond markets (US, Japan, Germany, Italy and the UK) over a period which ranges from the beginning of 2007 to the end of 2018 showcase the potential of exploiting carry trading strategies. These generally appear to yield better performances than the benchmark index. Furthermore, they also provide improvements in the respective Sharpe ratios, i.e. return to volatility ratios. These studies have been based on the formation of portfolios which are the outcome of an optimization process to maximise the targeted exposure to the carry factor while at the same time remaining duration neutral. In a nutshell, this entails choosing the bonds that offer, at a specific point in time, the maximum exposure to carry. Though, this choice is constrained by the prerequisite that the duration remains one of the index.
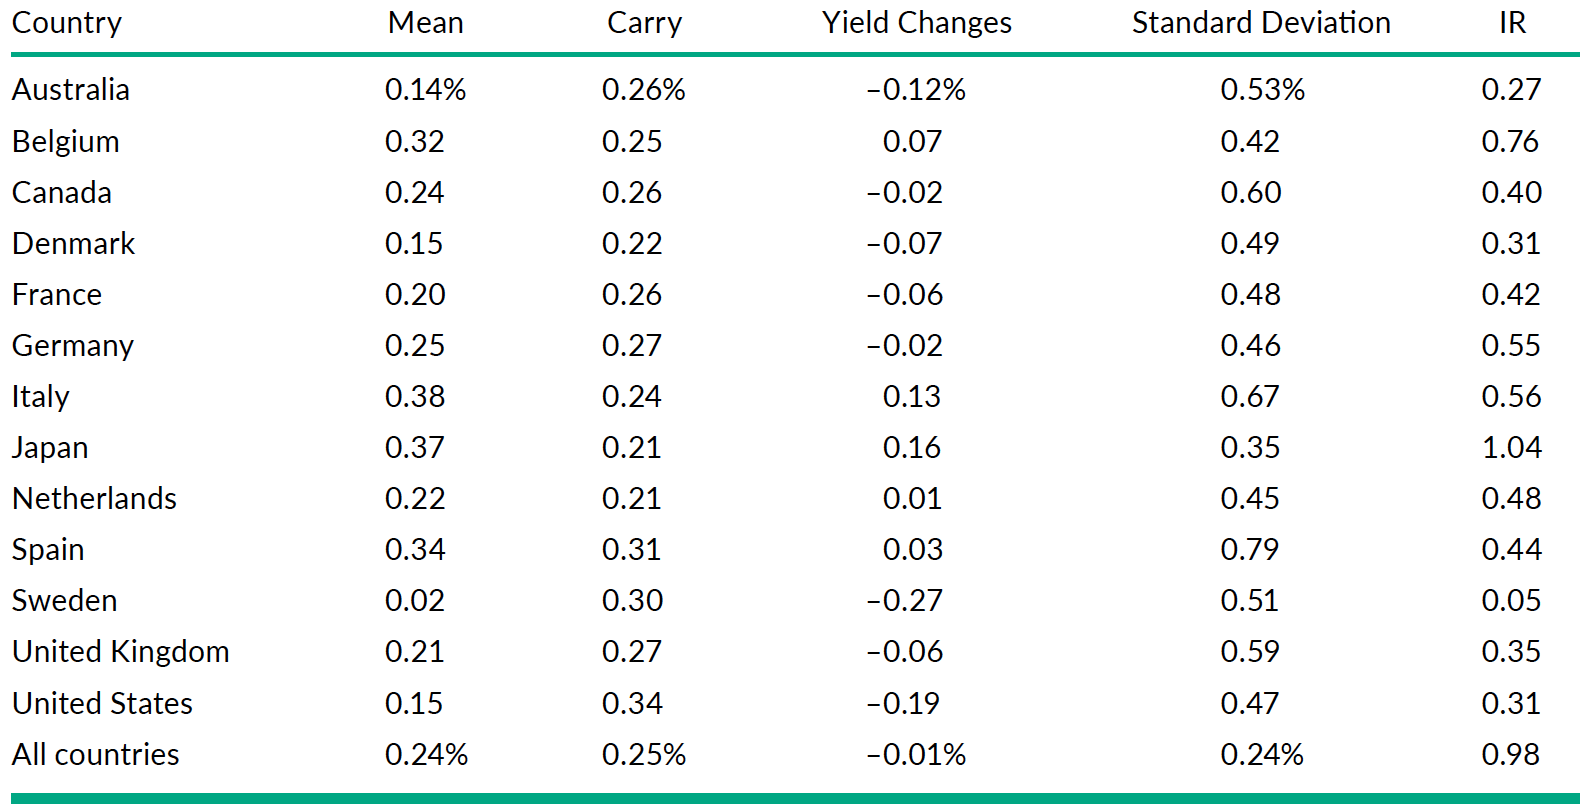
One of these studies has been carried out by Martens at al. [2019]. They apply a curve carry strategy to a global portfolio of bonds and find that carry factor has an information ratio of 0.98. The information ratio is the difference between the portfolio and the benchmarks returns, divided the volatility of the difference of returns. A positive value of the information ratio signals the strategy beats the benchmark consistently. In this case, the benchmark is represented by a long-only strategy on the same bonds.
In the study, the authors select the government bonds of 12 developed countries, spread them into maturity buckets, and compute the annualized excess carry for maturity bucket as:

Where:
- ytT[M] is the yield of the maturity bucket
- rtf is the t-bill rate
- Dtmod[M] is the modified duration for the maturity bucket M
- ytT[M]−1 is the yield the bucket would roll to in one year from now if the yield curve did not change
Note that the first part of the equation is the bond yield pick-up, the second the roll down.
The strategy buys bond in the maturity buckets with high carry per unit of duration and sells those in maturity buckets with low carry per unit of duration. In total, the strategy is long one-year duration and short one-year duration. It is important to use excess bond returns per unit of duration and carry per unit of duration to account for the fact that bonds with longer durations have more risk than bonds with shorter durations.
The global portfolio buys 1/13th in each of the 13 countries curve carry strategies and is implemented over the period January 1985-October 2018 with monthly rebalancing. As said, the carry strategy has an Information Ratio of 0.98. Note that this is the parameter we’re most interested in as the strategy is scalable.
The authors find that carry factor exists for global government bonds, and not only the US ones. They also establish it is truly a factor, as it’s alpha cannot be explained by existing bond factors in the literature.
Source: Martens at al. [2019]
The table reports the result of the study. For the mean annualized excess return (column labelled “Mean”), it shows the decomposition into carry (return when the yield curve does not change) and yield changes.
Nevertheless, despite the advantages of the strategy highlighted, the US active bond funds still tend to be underexposed to the sovereign carry factor. This can be substantially explained by the fact that certain sovereign portfolio managers are very much bounded by the mandates of investment they have to comply with, which prevent them from exploiting these opportunities.
Carry factor and flat curves
It is worth mentioning that the carry strategy thrives when yield curves are steep. Reasonably, in today’s world, it is not as attractive as in the past, for two reasons: on the one hand the carry factor is lower when curves are flattened; on the other hand, if the curve is flat, there is the risk that it steepens on the short leg on the trade, augmenting the carry and making the position unprofitable. In that case, carry would work against you. Even adopting more leverage, practitioners report that carry is too low compared to volatility for the strategy to be attractive. For these reasons, quants have developed new exotic variances that trade OTC swaps, repos and swaptions. For example, in April, UBS launched a strategy that trades ten different country swap curves at different points. Conversely, Société Générale proposed a strategy that exploits different costs of funding in the repo term structure. This curve did not flatten as the bonds’ ones as it is more susceptible to strong imbalances in supply and demand for repo financing. A third strategy involves trading the US rates swaption volatility surface, that tends to be upward sloping at shorter expires and downward sloping at the longer ones.
Nevertheless, these strategies are riskier than the original one. For example, imbalances in demand and supply can reverse, squeezing repo curve carry trades. Then, quant models seem not yet reliable when they deal with the long end of the swap curve. Therefore, some think that the success of these new alternative strategies will be much limited than the fixed income one.


0 Comments