Introduction
Straddling into earnings is a long-volatility trading strategy that consists of entering a long straddle position right before companies’ earnings announcements and closing it after the earnings are released. By buying a straddle before an earnings announcement, investors are betting that the stock will experience a large price movement in either direction, driven by the release of new information. The main assumption of the strategy is that investors underestimate volatility ahead of periods of uncertainty such as earnings announcements, and thus entering a long-volatility position during these periods can lead to an arbitrage. Previous findings suggest that this strategy was profitable from 1996 until 2013, but it remains the question of whether it has been arbitraged away by market participants in recent years. We backtest the strategy on the Standards & Poor’s 500 from 2011 to 2021 and find that it delivers consistently negative returns, in contrast to previous literature.
Earnings Announcements
Earnings announcements are a key event in the financial markets, and the timing of these announcements is known in advance. This allows investors to separate the uncertainty associated with the earnings date from the uncertainty associated with the company’s fundamental performance. These periods are information-dense, and stock trading volume can increase by as much as 50%. The buildup of uncertainty before the announcement and the subsequent decline in uncertainty afterward is often referred to as the “IV crush,” as implied volatility is commonly used as a proxy to measure uncertainty.
Research has shown that stock prices tend to rise in the days leading up to earnings announcements. This is commonly referred to as the “earnings announcement premium,” which has been observed and studied in the literature since Beaver’s work in 1968. Numerous subsequent studies, such as those conducted by Chari et al. (1988), Ball and Kothari (1991), and Cohen et al. (2005), have confirmed the existence of this premium. Moreover, Lamont and Frazzini (2007) have found that the earnings announcement premium is strongly related to the concentration of trading activity around earnings announcements. More precisely this earnings announcement premium is large, robust, and is more significant when trading volume surges around the announcement date. Stocks that experience high trading volume around earnings announcements are often subject to high buying activity by individual investors, which can push prices higher around the announcement date.
The positive correlation between stock returns and trading volume has been noted in the literature, meaning that stocks typically advance when volume is high and decline when volume is low. A possible explanation for the increase in volume around announcement dates is the “attention-grabbing” hypothesis, which suggests that investors have limited attention and tend to buy stocks that catch their attention. Consistent with the attention-grabbing hypothesis, studies by Lee (1992), Hirshleifer et al. (2004), and Dey and Radhakrishna (2006) have shown that individual investors heavily trade on announcement dates, regardless of whether the news is good or bad. This buying activity by individual investors can lead to an excessive increase in stock prices around earnings announcements.
Figure 1 illustrates the average volume of the sample in relation to the distance of the announcement date. The figure confirms the observation that there is a surge in trading activity around earnings announcements.
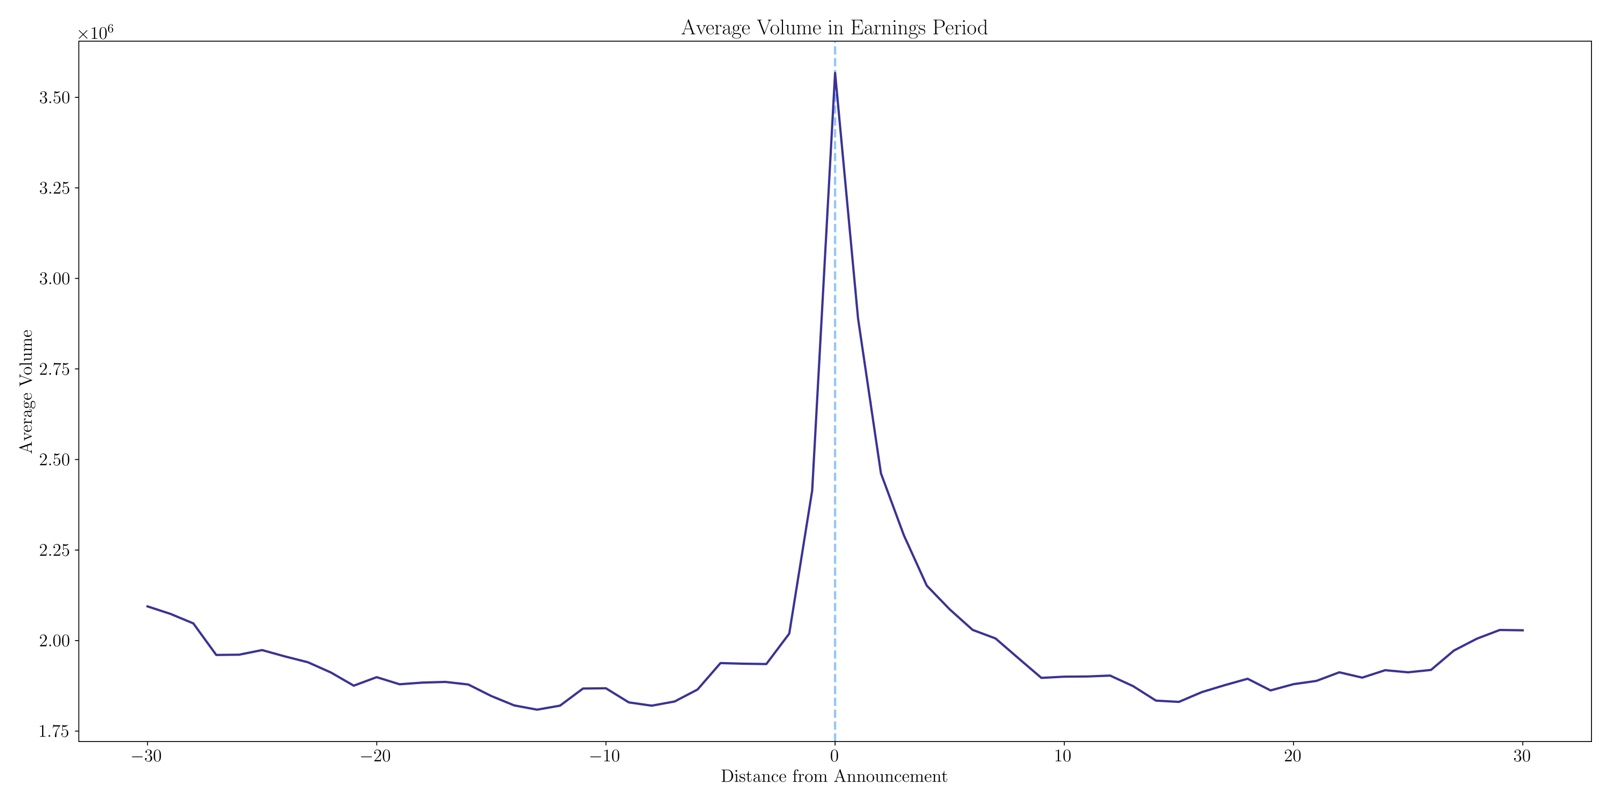
Figure 1: Average volume in earnings period
Source: CBOE, Bocconi Students Investment Club
Straddle
A long straddle is a trading strategy involving the purchase of both a call and a put option with the same expiration date and strike price. This strategy could be effective when an individual anticipates a significant move in either direction but is unsure about whether the price will go up or down, such as before earnings announcements, earnings calls, and CPI prints. A trader will profit from this strategy if the price of the underlying security rises or falls by an amount exceeding the total cost of the debit paid. The profit is theoretically unlimited because of the unlimited profit potential of a call option, while the maximum loss is limited to the price paid for both legs. Specifically, at expiration the payoff will be the difference between the stock’s price and the strike price, minus the premium paid for both options. There are two breakeven points in this strategy; the upper breakeven point is equal to the strike price of the call option plus the net premium paid while the lower breakeven point is equal to the strike price of the put option less the premium paid.
A straddle is usually nearly delta neutral, as when you buy ATM calls and puts their deltas are around ± 0.5, cancelling each other out. However, this can quickly change as an increase (decrease) in the underlying price will make the straddle’s delta positive (negative). This is the effect of gamma which increases (decreases) the straddles delta in response to a change in the underlying price. Because both a call and a put have positive exposure to gamma, a straddle has a positive gamma. Furthermore, the strategy is also positively exposed to Vega meaning that an increase in implied volatility should increase the value of both the call and the put, making the straddle value increase. With the same logic, as both calls and puts have a negative theta, the straddle’s theta is also negative, meaning the extrinsic value of options decays as time passes. The net P&L for an option position from gamma and theta is the difference between realized and implied volatility; for our purposes, since we are long straddle, we want realized volatility to be higher than implied volatility.
To remove the directional exposure of the underlying and focus only on uncertainty, we will be using delta neutral straddles. This means that when puts and calls are purchased for the creation of the straddle based on strike and maturity, the weights will be adjusted to make the straddle delta equal to 0. For any pair of call and put options let  and
and  be the deltas of the call and put options, and
  the weight on the call options. This implies that the straddle’s delta is:

By making the straddle delta equal to zero we find that the weighting of the call option is determined by:

For the scope of our article, we therefore initially adjust the weight of the call option in the straddle to make the delta of the straddle neutral, without rebalancing it afterwards.
Volatility and Jump Risk Premium
As documented by previous literature (Coval and Shumway (2001); Cremers et al. (2015)), long straddles strategies in the past decade have delivered negative returns; an estimation of the performance of such strategies can also be observed from CBOE’s Realized Volatility Index (Ticker: GAMMA). The index indeed expresses the performance of a delta-hedged portfolio of the five shortest-dated at-the-money Standard & Poor’s 500 Index (S&P 500) straddles established daily and held to maturity; consequently, when implied volatility underprices (overprices) realized volatility the index trends up (down).

Figure 2: Gamma index performance 2012-2023
Source: CBOE, Bocconi Students Investment Club
It is interesting to notice, however, that the downward trend of the index has slowed down since 2017, obtaining an almost neutral performance during the last 5 years. That suggests that the returns delivered by options selling, after being positive for several years, have likely been compressed to zero. Figure 2 shows the Gamma index in the last 11 years, while figure 3 shows Gamma index from 2018 to 2023.

Figure 3: Gamma index performance 2018-2023
Source: CBOE, Bocconi Students Investment Club
Further analyses can be conducted: Cremers et al. (2015) and Chen et al. (2023) decompose straddles returns into Volatility Risk Premium and Jump Risk Premium. In absence of such premia, Coval and Shumway (2001) show that the expected return on a delta-neutral straddle should be equal to the risk free-rate. The intuition behind this decomposition is that the volatility of an asset is expected to increase on certain key dates; therefore, the implied volatility of an option whose expiry is after that date is the sum of the normal diffusive volatility and the volatility due to the anticipated jump on the key date. To insulate from jump risk and create a volatility risk asset, the authors construct a market-neutral and gamma-neutral yet vega-positive portfolio. Similarly, to study the effects of jump risk, they create a market-neutral and vega-neutral but gamma-positive portfolio.
As shown by Figure 4, both the empirical results of Cremers et al. (2015) and Chen et al. (2023) confirm that the returns of straddles are negative and that jump risk returns are significantly more negative than volatility risk returns. Interestingly, volatility returns are slightly positive in Chen’s study and negative in Cremer’s paper: given the different timeframe, a possible explanation could be a trend change in recent years. This thesis is supported by a further subdivision performed by Cremers of the factors’ returns in different periods: the last window (2007-2011) delivers the highest volatility returns. It is not unlikely therefore that this upward trend has been confirmed after 2011, explaining Chen’s results. Finally, volatility and jump returns are weakly correlated (0.10), lending support to the validity of this decomposition method.

Figure 4: Results from Cremers et al (2015) and Chen et al. (2023) of Volatility and Jump risk premium
Source: Bocconi Students Investment Club
In conclusion, Figure 5 shows the return patterns around earnings announcements obtained by Chen et al. (2023). The authors’ decomposition shows that jump returns are the main component of the straddle positive returns before earnings in a period that goes from 3 days before the earning announcement day [-3] to the subsequent day [+1]. Because delta neutral straddles have positive exposure to market and jump risks, they are not gamma or vega neutral and as Cremers et al. (2015) show, volatility and jump risk premium carry negative and significant risk-premia. Therefore, it is unlikely that straddles returns around earnings announcements as found by Gao, Xing and Zhang (2018) represent compensation for these negatively priced risk factors. This suggests that if the returns are not justified for the compensation for systematic risk, then there would be an underestimation of uncertainly around earnings announcements causing a mispricing of options.
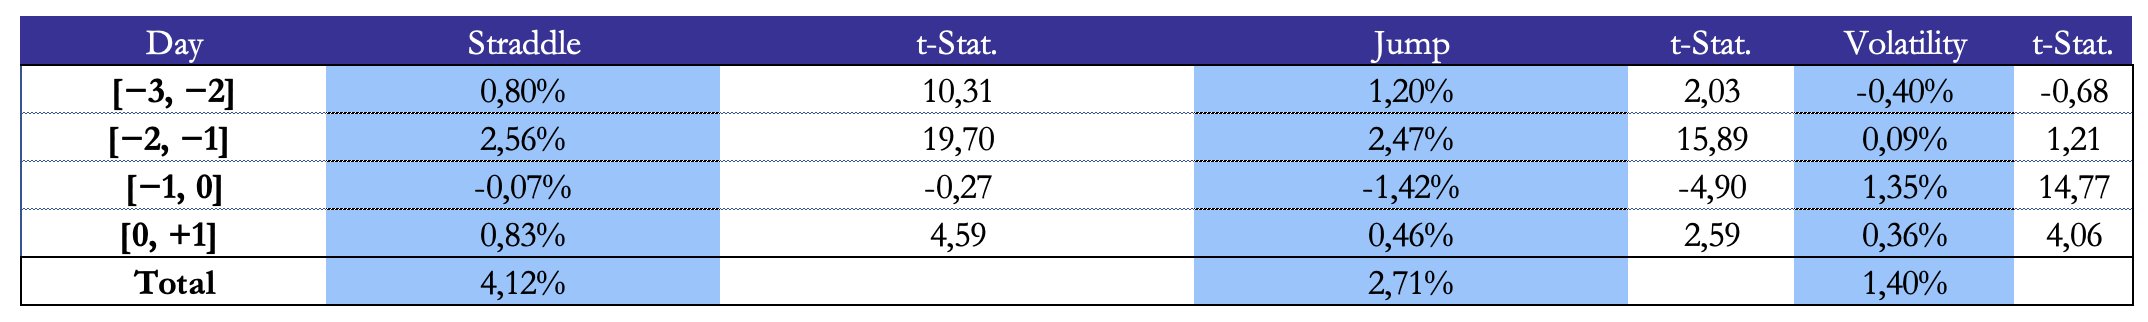 Figure 5: Results from Chen et al. (2023) of straddle performance around earnings announcements
Source: Bocconi Students Investment Club
It is not the scope of this article to further explore the decomposition of straddle returns; given their importance, we have illustrated the most recent literature findings regarding the risks underlying straddles.
Our Empirical Contribution
Our sample period is from Dec. 2011 to Dec. 2021. We obtain information about the underlying stocks, such as returns and earnings announcement dates from Center for Reseach in Security (CRSP) and Institutional Brokers’ Estimate System (IBES). Our options data are from OptionMetrics, which provides end-of-day bid and ask quotes, open interest, volume, implied volatility, and option Greeks for all listed options. We define date 0 as the event day, during which earnings are announced. The trading day before the announcement date is -1, and the trading day after the announcement day is 1. Since options data are vast and might have some liquidity issues we only focus on short-term at-the-money options. To include trading costs in our results, we buy the ask price and sell the bid price, facing the bid-ask spread cost. To analyze returns without transaction costs we take the average of the bid and ask. The strategy will follow a buy and hold principle, where we open the straddle at day  and close it at day
  . As previously stated we construct a delta-hedge straddle to remove the directional exposure. We weight among straddles of a certain stock on a certain announcement period, using volume-weight. Amongst firms we weight with equal weight. Finally, to create the straddles, we pair call and put options with matching strike prices and maturity.
Following Gao, Xing, and Zhang (2018) when forming the straddle we apply some filters to the options data: (1) the option prices are at least $0.125; (2) the underlying stock prices are at least $5; (3) options have strictly positive open interest; (4) options have 10 to 60 days to maturity; (5) options have an absolute delta between 0.375 and 0.625; (6) the moneyness of the option (as defined as the strike price over the previous days stock price) must be between 0.9 and 1.1; (7) to form straddles, only paired calls and puts with the same expiry date and strike price are included; and (8) to ensure that straddles can be formed around earnings announcements, options must have price information at the beginning and end of the holding period.
To start off our empirical analysis, we want to analyze our findings about the uncertainty ahead of earnings. A natural measure of uncertainty in stock prices is realized volatility. Here we compute range-based volatility, which is found by finding the difference between daily high and low trading prices, divided by the closing price. The higher the range-based volatility, the higher the uncertainty. This first proxy measures how price reacts to new information in real time, therefore no anticipation of events is reflected in range-based volatility. Another proxy for uncertainty is implied volatility, a measure of the anticipation of future volatility. IV is a price measure, reflecting information from options prices, therefore also containing volatility and/or jump risk premium.
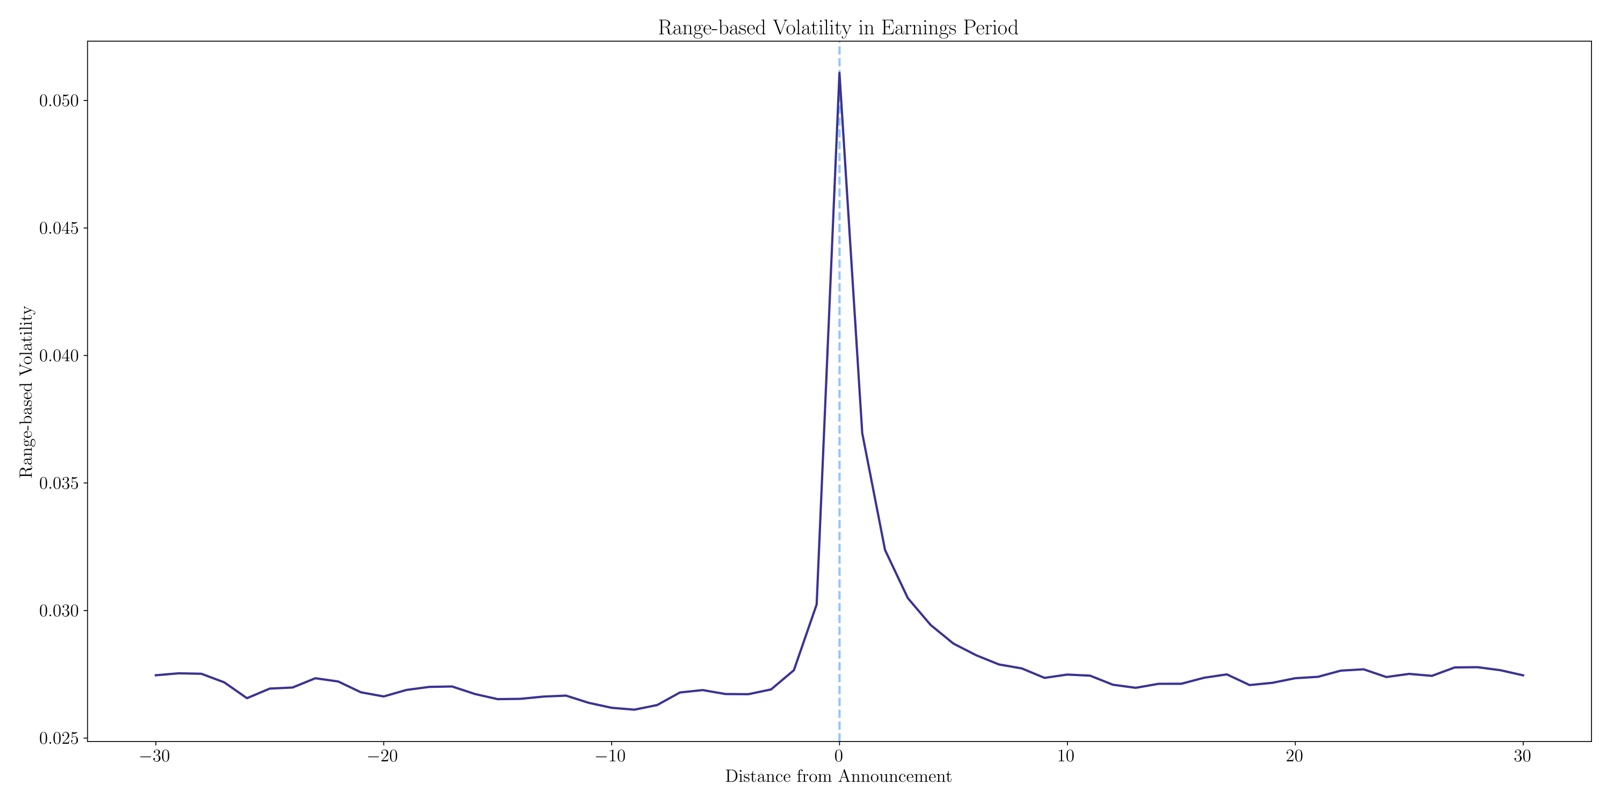
Figure 6: Range-based Volatility in earnings period
Source: Bocconi Students Investment Club
To show our findings we have taken the average of range-based volatility of our sample data from 30 days before an earnings announcement to 30 days after an earnings announcement. Figure 6 displays the mean range-based volatilities as the difference between the highest and lowest trading prices during the day, scaled by the closing price of our data sample.
Our previous article, covering the findings from Gao, Xing, Zhang (2018) from a data-sample starting in 1996 to 2013, finds that ATM straddles formed 3 days before earnings announcements and closed one day after the announcement yield a significant positive return of 3.34%. This positive performance suggests that investors underestimate the uncertainty around earnings announcements. Another interesting finding of our first article is that straddles formed on companies with a lower market cap, higher volatility, less trading volume, and higher transaction costs perform better compared to the rest of the sample.
To test whether the performance is still positive, we have adopted a buy-and-hold trading strategy where we open a straddle in T-3 (where T is the earnings announcement date) and close the position at T+1. We therefore extended the timeframe of our analysis focusing on a data sample of 10 years starting in 2011 and finishing in 2021. But before analyzing our returns we want to understand why the anomaly existed in the first place. When presented with this anomaly there are two questions an investor should ask. First, what is causing this anomaly and second, why haven’t arbitrageurs eliminated this yet. There are some obvious limitations to arbitrage; as we have found, transaction costs drastically decrease the straddles performance, and since frequent trading is required, traders may be averse to incur such high trading costs as options (especially ones of lower market caps companies) have a very large spread. Furthermore, there is high idiosyncratic volatility around earnings announcements, which could prevent risk averse institutional investors from trading before them. However, there is some robust evidence that traders are in fact trading to eliminate the premium. As researched by Lamont and Frazzini (2007) arbitrageurs are aware of the anomaly, are trading on it, but have not completely eliminated it.
Over the analysed period, we find that without considering transaction costs, a straddle earns on average 1.17% in [T-3,T+1]. These returns are still positive but smaller in magnitude when compared to Gao, Xing, Zhang (2018). This suggests that arbitrageurs have found this anomaly and are continually working towards eliminating it, resulting in a decrease in the strategy’s performance when compared to previous data. Returns become negative when taking into account transaction costs, with an average return of -9.07%.
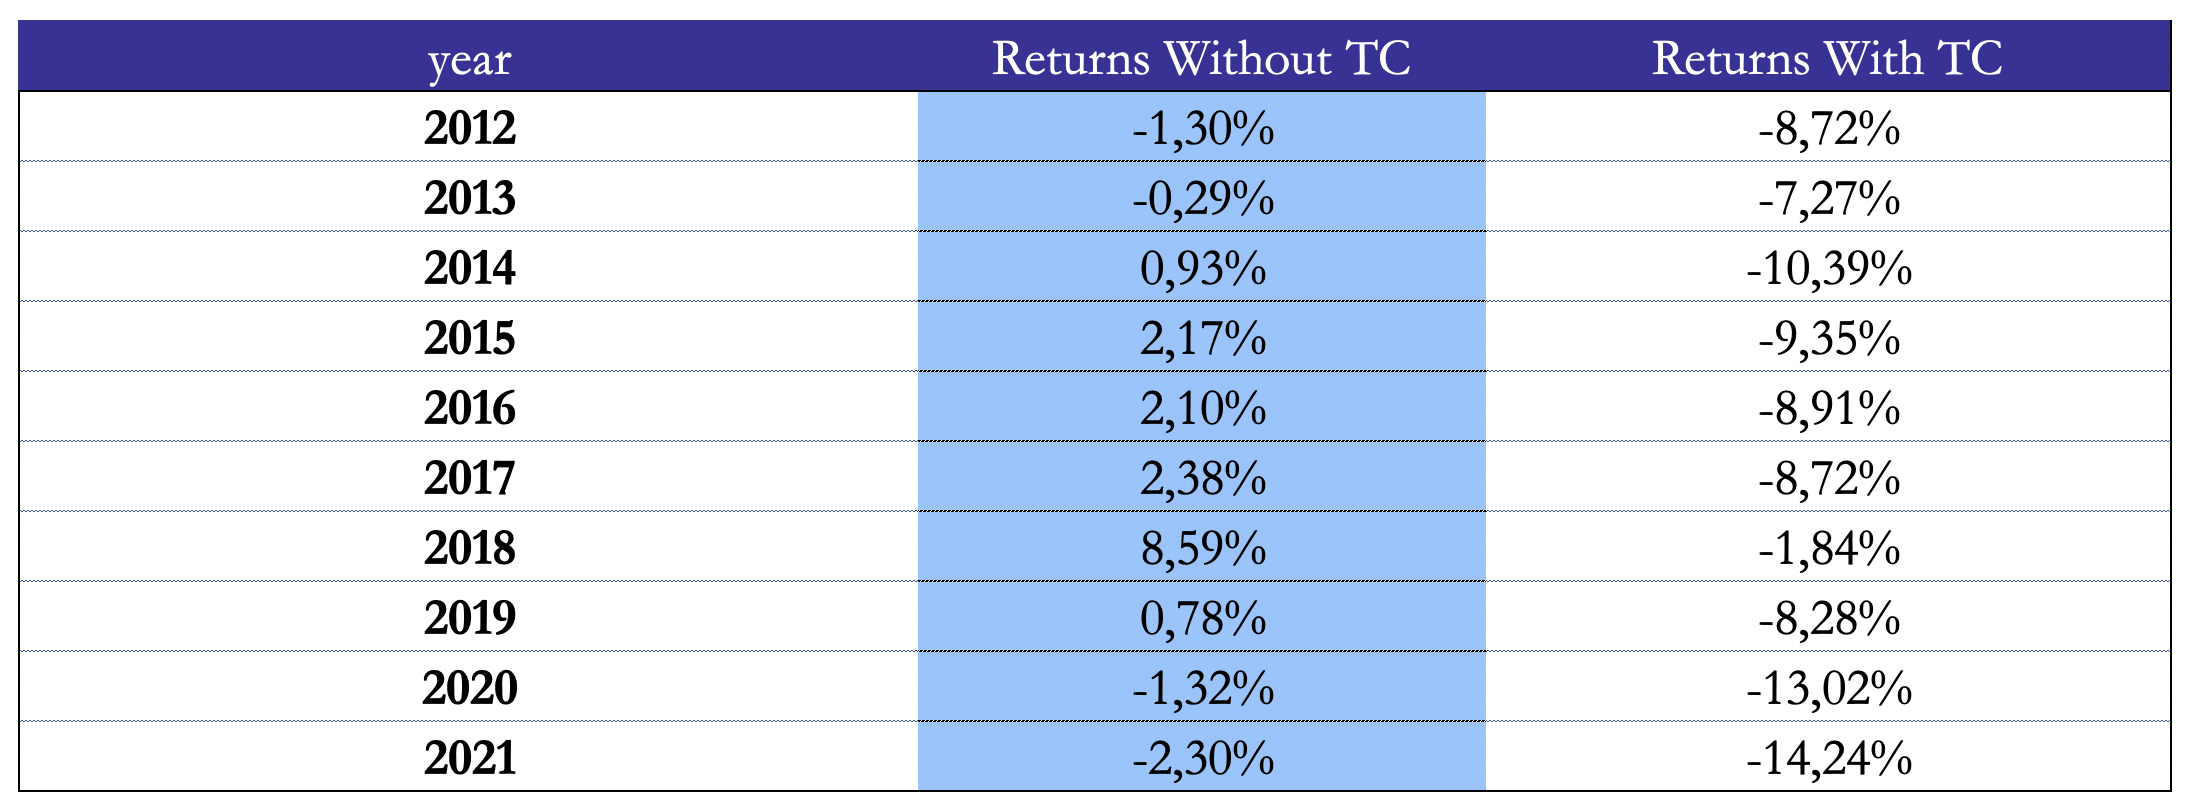
Figure 7: Average volume-weighted return of a straddle with and without transactions costs
Source: Bocconi Students Investment Club
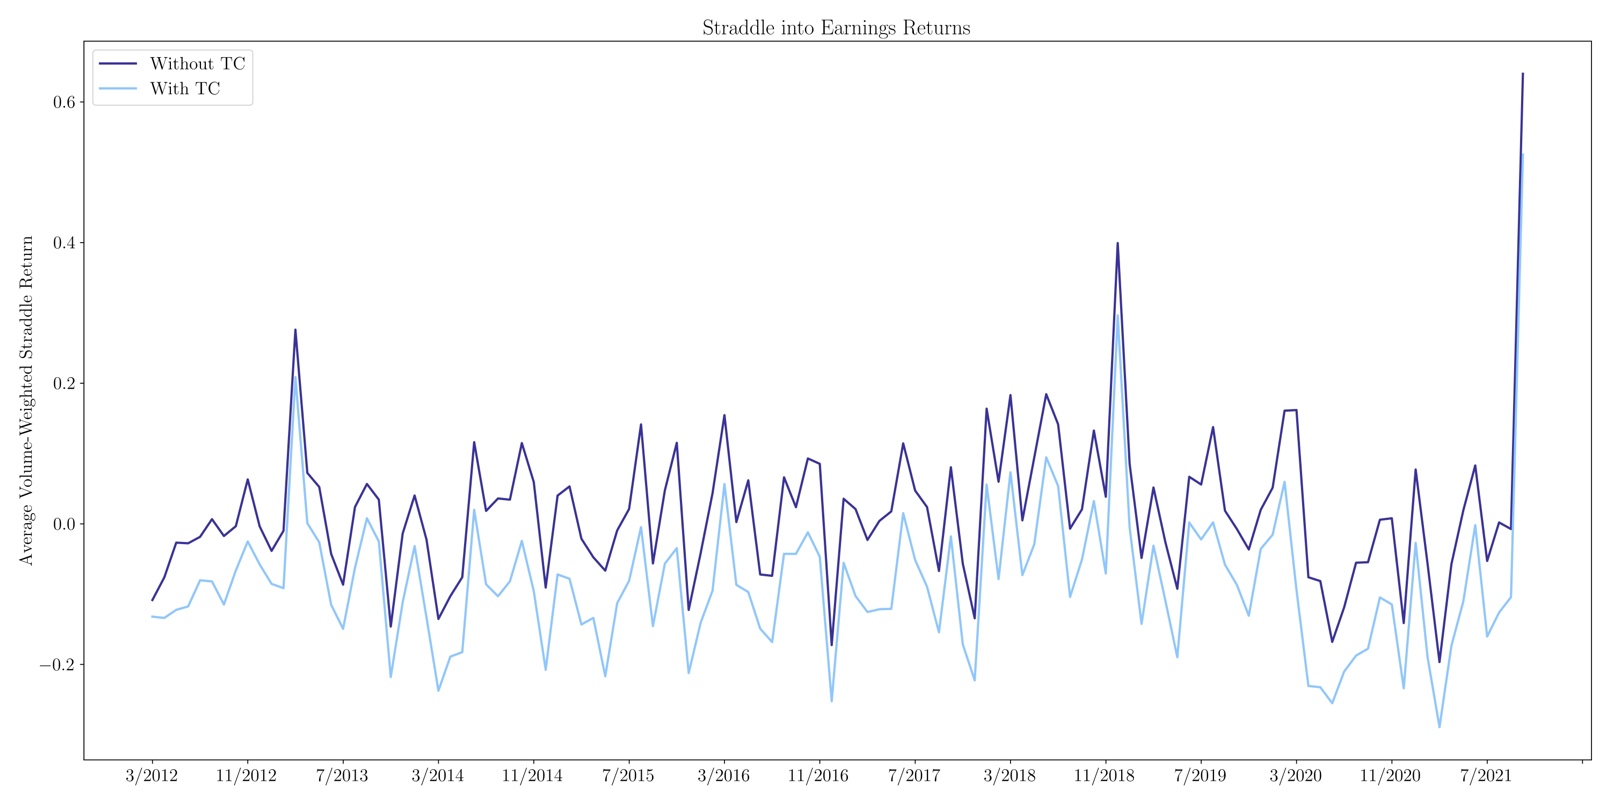
Figure 8: Average volume-weighted return of a straddle with and without transactions costs
Source: Bocconi Students Investment Club
Figure 8 shows the monthly returns with and without transaction costs, with the latter hugely impacting the profitability of the strategy. We partially mitigate the problem by weighting the returns for the volume: since higher liquidity comes with higher volume levels, we can expect a negative correlation between volumes and bid-ask spreads; consequently, higher exposure to more traded straddles allows us to contain transaction costs, compared to an equally weighted strategy. However, Gao et al. (2018) have identified a negative correlation between straddle returns and liquidity, which, if confirmed, would seriously threaten the profitability of our strategy.
Limitations and Possible Improvements
To further develop our analysis, a cross-sectional study should be implemented to examine whether the straddle returns are robust across different firm and option characteristics. Different factors could be taken into consideration, such as the noisiness of signals, transaction costs and past earnings surprises. Additionally, a Fama McBeth regression should be used to directly examine whether individual straddle returns can be predicted by past information. For example, Guo et al. (2018) include basic characteristics of the options, such as days to maturity and moneyness, noisiness estimations and transactions costs measures. It is also advisable to optimize our discretionary choices (i.e. filters on straddles and holding period), which in the article have been set to allow a better comparison with previous papers. Finally, a deeper study on how returns vary in response to changes in Greeks exposure could help in identifying more profitable straddles: for instance, a gamma maximization strategy could be implemented by imposing stricter filters on moneyness and time to maturity. It would be interesting also to observe how jump and volatility risk premia have changed over the years.
ERRATA CORRIGE: the article was updated on April 15, 2023 due to a mistake in the calculation of returns presented in Figure 7 and Figure 8.
Sources
- Chen et al., (2023). “Anticipating jumps: Decomposition of straddle price”. Journal of Banking and Finance.
- Coval et al., (2001). “Expected option returns”. J. Finance 56 (3), 983–1009.
- Cremers, Halling, Weinbau, (2015). “Aggregate Jump and Volatility Risk in the Cross-Section of Stock Returns”. The Journal of Finance 70 (2), 577–614.
- Gao, Xing, Zhang, (2018). “Anticipating Uncertainty: Straddles around Earnings Announcements”. Journal of Financial and Quantitative Analysis. Vol. 53, No. 6, Dec. 2018, pp. 2587–2617.


1 Comment
Quinten · 20 November 2023 at 21:06
The CBOE’s Realized Volatility Index has been going up very well the past few months. Could this indicate straddles to do better now?