Introduction about Fintech
In the years following the financial crisis of 2008, regulators have focused their attention on making the financial system a much safe a place as possible, in particular adopting new regulations for traditional financial institutions. Meanwhile, in places like Sillicon Valley, London, and in parts of China a global revolution has been gaining traction, with fintech strat-ups set to change the way costumers interact with financial institutions and provide banking services. With an estimated $310bn in total investments as of 2022, the Fintech industry is increasingly challenging brick-and-mortar banks by having better tools for assessing risk, providing inexpensive products, and in general suffering from less intense regulation.
Challenging legacy institutions
Using improvements in Machine learning, Ai technology, and cloud computing, Fintechs are able to offer complex financial services for a much lower price. The most advanced examples are AliPay and WeChat Pay in China, which were born as auxiliary payment services for respectively Alibaba and Wechat. Founded in 2011, Alipay has more than 1bn users and handled USD16tn in payments in 2019, more than 25 times the volume of PayPal. The biggest difference to traditional banks, is that both services charge as little as 0.1% per transaction, which at times can be 10x less expensive than the commission of a traditional payment method. This low commissions are a standard in each fintech niche market, indeed the primary value proposition of many players in the industry is to de facto shift the costs of services from the consumers to other third parties. For example asking higher commissions to the businesses using the platforms in exchange for the resulting higher traffic and ease of access to the product by consumers attracted by lower transaction costs.
Another significant trend in the fintech space that is allowing the lower prices is the recent build-up towards an all-in-one businesses model, with platforms like Revolut now offering banking, insurance, trading, mobile payments, and even travel and leisure options. Thus, obvious synergies appear between loans, trading, wealth management, and insurance activities. By having a large poll of users- Revolut has 15mn, while a bank like Société Général has 30mn- fintechs are using data provided by payments to determine a client’s credithwortiness. Traditional banks assesses creditworthiness based on credit history and current wealth, and secure loans against collaterals such as houses, luxury items and bank accounts. However data can substitute for collateral, by which fintech platforms know more about wether borrowers will repay than the borrowers themselves. Once more the value proposition revolves around easier access to the service and lower burden on the customer, enabled by technology.
What are the main segments?
Mobile payments: As one of the main branches of Fintech, Mobile payment companies are becoming real disruptors in the banking industry, as costumers depart from traditional payment operators and banks and their high transaction fees, bad costumer services and slow processing time. This segment includes companies like Revolut and Venmo as popular alternatives for millenials, but also the new wave of Buy-now-pay-later players like Klarna or the Italian Scalapay. This is a very active industry at the moment, undergoing a profound paradigm shift which we will expand on in the next part of this article focused on fintech in the payment space.
Trading & Wealth services: With their integrated and easy-to-use interface, trading apps are getting increasingly popular between retail investors, due to the promise of “trading democratization”. These new companies offer a large variety of trading financial instruments and allow for zero-commissions transactions. Founded in 2013, Robinhood is a trading platform that offers commission free trading of U.S. equities, options, cryptocurrencies and supports short selling. As of 2022, the company was valuated at $11.9bn and has around 22.5mn active users. As the company has 0% comision fees it generates revenue from 3 main components: interest on uninvested cash, margin lending, and payment for order flow (which has proven controversial as some argue it implicitly takes a cut as the high frequency traders buy the order flow and anticipate the market). These cash flow streams helped the company generate a revenue of USD1.8bn in 2021, an 100% increase from the USD959m in 2020, also due in part by the popularity gained during Covid-19 pandemic. It is also important to include in this category al the robo-advisory platform that provide customized wealth and asset management solutions to a group of investors who could not access these services before.
Peer-to-peer lending: Another traditional activity covered by legacy banks is the offering of loans, turning short term liabilities into long term assets such as mortgages. One drawback of this business model is the risk involved, as costumers that have deposits expect their money back in full even if the bank perform poorly. Peer-to-peer lenders connect lenders with borrowers and base their revenue streams on commissions, thus eliminating the above mentioned risk. Borrowers usually take unsecured personal loans for major purchases but it is also common for small companies to access debt from these platforms, while lenders are usually investors, investment funds, or sometimes even the platform itself. The biggest player in the United States is Lending Club Corporation, a fintech start-up founded in 2006 that is using data analytics to build algorithms for setting-up pricings, interest rates and risk assessments. The company has connected more than USD60bn in loans in the past years and has a market capitalization of USD1.6bn as of 2022.
Fintech Valuation Guidelines: DCF method
In terms of valuation, Fintech companies are treated by the market more as tech companies rather than financial companies. The following picture compares the trends of three indices since 2015. The white line, yellow line and red line respectively represent the Fintech index, IT service index and bank index. We can fairly tell that the IT service index and Fintech index are more correlated. Thus, it is safe to assume that the common problems we will come across when evaluating tech companies are also applicable in Fintech companies’ valuation.
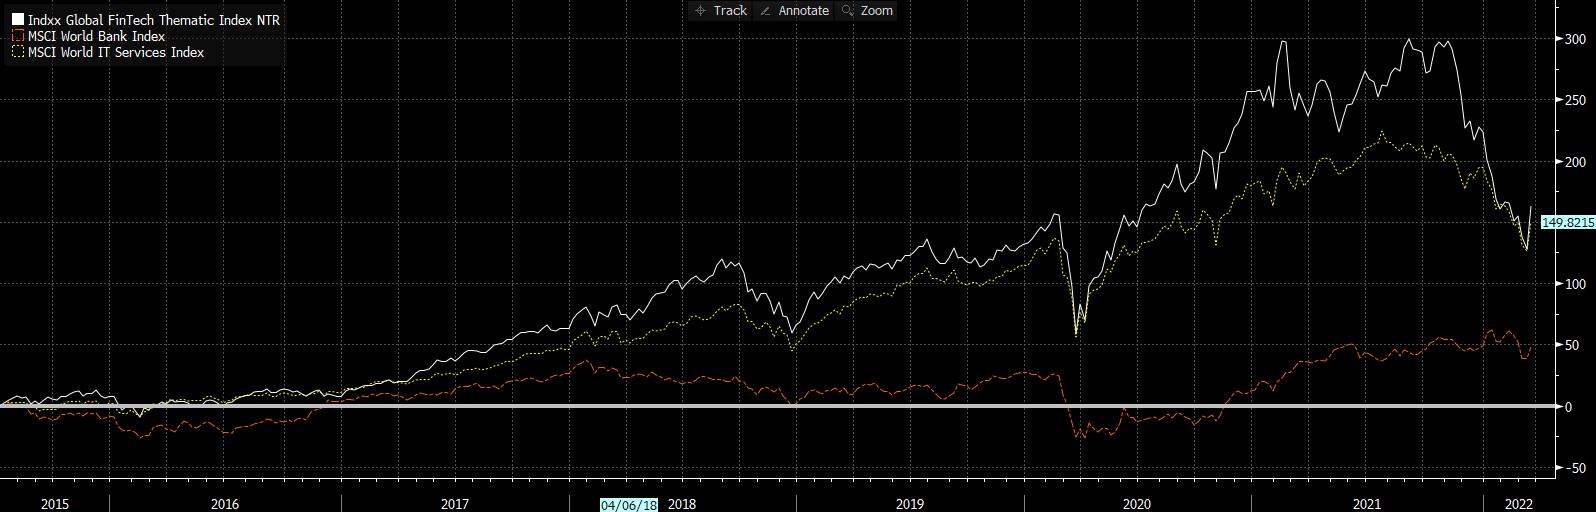
Source: Bloomberg
The most place to start to value a company is building up a DCF model. However, there are three characteristics of Fintech companies that are likely to pose challenges to credible modelling: their short operating and trading history (or often they are straight up private), their hazy profitability status and outlook, and the erratic industry regulations.
Let’s walk through the problems one by one. With the short operating and trading history, the most obvious problem comes with the estimation of the stock beta. The common practice is to regress stock returns against market returns, but in this case, we may not have enough samples to arrive at a robust estimation. Alternatively, we could adopt a bottom-up approach if there are adequate comparable firms that have been listed for two or more years. If not, matching the financial characteristics of the firms — the volatility in earnings, their size, cash flow characteristics, and financial leverage — with the corresponding plausible beta values could be our last resort.
Not only the equity risk, but also the debt risk will probably get in the way. As many are still not public, most fintech companies are not rated, while the estimation of the cost of debt is generally based on ratings. To circumvent the problem, we could try estimating a synthetic rating based on interest coverage ratio If the company has a positive operating income. However, there are still a non-negligible number of Fintech companies with a negative EBIT. Then basing the credit rating on expected future interest coverage ratio could be a lifeline.
The most severe problem comes with the fact that the terminal value of Fintech companies usually takes up too large a proportion of the overall valuation, sometimes even as large as 80 to 90 percent. This will seriously undermine the reliability of the valuation, but the result is justified if we consider the fact that many Fintech companies are at their budding stage, sacrificing their earnings to grab market share from traditional financial companies. They will continuously lose money or make lean money in the foreseeable future. What attracts investors are the promising prospects of the companies when they reach mature stage. If we are betting on the distant future, uncertainty is inevitable. High terminal value percentage typically reflects companies’ magnificent future as well as enormous uncertainty.
The best solution to the problem of uncertainty is always diversification. The importance of diversification cannot be overemphasized especially when investing in Fintech stocks that derive the bulk of their value from uncertain future growth. As Damodaran stressed, “The antidote to estimation error is often a more diversified portfolio both across firms and across sectors.”
Let’s move on to discuss the second characteristic of Fintech companies. With the hazy profitability status and outlook, we may well be bothered with the estimation of free cash flows. Most Fintech companies are in the phase of rapid expansion, thus requiring a large amount of upfront capital expenditure. The problems lie in the fact that the major parts of the “capex” of Fintech companies are R&D expenses and marketing expenses. Under the prudence principle of accounting, R&D and marketing investments are generally expensed as incurred. However, we could argue that these expenses will benefit the company in the long run and should be capitalized, so that we would derive more reasonable earnings. To do so, we have to estimate an average service life of the expenses, amass antecedent expenses to form an asset account and amortize the expenses over the service years. One might argue that the estimation of service life incurs another challenge, as it is very hard to know how long the expenses will remain functional. However, the principle is that a rough estimation is still better than no estimation.
One may also argue that the reclassification of expenses to assets will not change the free cash flow anyhow, so it is a redundant procedure. It is true that the current year’s free cash flow will still remain untouched, but we are likely to attain more accurate future cash flow estimations with the grasp of the company’s true profitability. Besides, for high-growth loss-making Fintech companies, the estimation of reinvestment needs is usually obtained through the following formula:
Expected reinvestment = Expected change in revenue/(Sales/Capital)
One of the premises to use this formula is to have an accurate capital estimation, which is defined by the following equation:
Capital invested = BV of equity + Capitalized expenses + BV of debt – Cash
For the record, “BV” represents “Book Value”. In general, capital represents the resources that the company deploys to generate revenue, and especially for Fintech companies, capitalized expenses usually play a vital role in it. Thus, properly capitalizing R&D and marketing expenses is not redundant at all but crucial for Fintech valuation.
Another problem is how large the operating margin will be as the company reaches the mature growth stage. This problem is relatively easier as Fintech companies’ core business models are closer to financial companies’, while technology essentially plays the role of reducing redundant cost and improving the business efficiency. Thus, targeting the mature operating margin of fintech companies at a relatively higher level than the underlying financial business model is a rational assumption.
There are also two caveats that we should notice when estimating free cash flows. Firstly, If the operating margin of the company is on the rise for a short period, it’s hard to judge whether the improvement is due to higher business efficiency or due to the reduction of vital but discretionary capex. If it is the latter case, the boost of the short-term financial results is at the cost of the company’s long-term prospects and will probably mislead the investors into excessive optimism. Our suggestion is to always wait for more evidence before modifying your model in the optimistic direction.
Secondly, there is a minor detail we might overlook when we are evaluating a current loss-making company——net operating loss (NOL) carrying forward. Normally, it will not be a severe problem to neglect the NOLs as the impact is relatively trivial for mature companies that commit a loss caused by rare misfortune. However, for Fintech companies with negative earnings and high growth in revenues, the NOLs may be amassed to a colossal amount before they realize continuous profitability. The tax-deduction benefit of NOLs may constitute a non-negligible part of companies’ final valuation.
In terms of erratic industry regulations, we should always bear in mind that financial industry is a highly regulated industry and financial innovations can be quite sensitive. A group of Fintech companies are actually operating on the margins of the law, putting investors at great risks. Robinhood is a prime example of this. Specifically, Robinhood’s stock fell 6.9% on 30th Aug 2021 after Securities and Exchange Commission Chairman Gary Gensler told Barron’s that banning the controversial practice of payment for order flow (PFOF) is “on the table”. PFOF is one of Robinhood’s largest revenue sources and the prohibition of it will severely impair Robinhood’s growth prospect. This case sends a perfect reminder that regulatory risks can never be neglected when valuing Fintech companies. The coping strategy is to assign probabilities to different scenarios representing various possible regulatory shocks and calculate the expected valuation. In many cases the probabilities may be determined arbitrarily but again, coarse estimation is still better than no estimation.
Fintech Valuation Guidelines: Multiple method
Since DCF valuation is highly reliant on parameters estimation and assumption, some investors may turn to multiples for help. However, we argue that, instead of solving the problems, multiples actually hide and ignore the problems. As Damodaran indicated, “(Multiple users) choose to sweep the uncertainties under the rug and act as if they do not exist.”
To specify, we take P/E ratio for example. In fact, if we recognize that the “P” in the P/E ratio can be derived from the DCF model, we will immediately realize that every parameter in the DCF model will ultimately impact the P/E ratio. This argument can be partially supported by the following picture, which depicts the P/E band of the Fintech Index during the last five years:
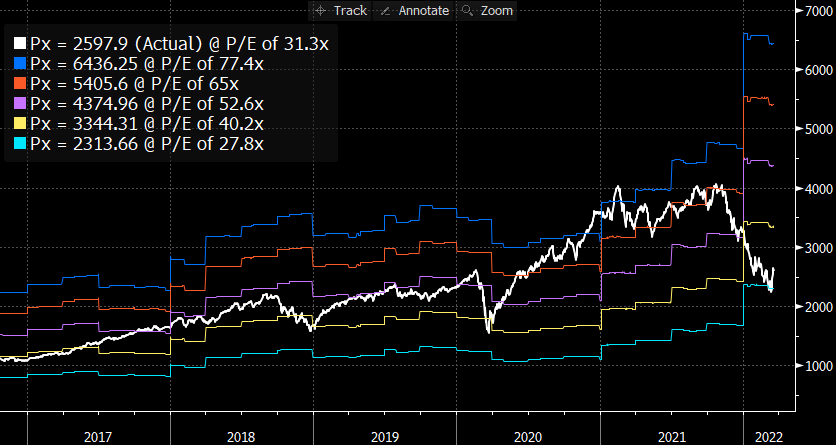
Source: Bloomberg
We can distinctly observe that during 2020 to 2022, the P/E ratio of the index is quite volatile——it has reached as high as 77.4x and as low as 27.8x. Combining with the fact that the risk free rate dropped to historical low during 2020 to 2021 but is expected to rise sharply in 2022, we can safely arrive at the conclusion that risk free rate, one of the parameter of DCF model, will also impact the P/E ratio significantly. We can also think from another angle and focus our attention on the denominator——earnings. We have mentioned earlier that the operating margin of Fintech companies may be underestimated because of upfront capital expenditure. So, the “real” operating margin of companies may vary a lot. By basing the valuation of a specific company on the P/E ratios of comparable companies, we implicitly assume that the earnings of the two parties are consistently measured and adjusted. However, in reality, this is usually not the case.
However, if the comparable companies are abundant, the use of multiples could be justified as all the factors that give rise to the various P/E ratios are averaged out. The average P/E ratio will stabilize to a certain level. Nevertheless, in the case of Fintech company valuation, it is usually difficult to find a large number of comparable companies. The compromise is to take the average of the P/E ratio of the traditional financial industry with the most similar business model and the P/E ratio of the tech industry, and then we can have enough samples to yield relatively robust result. But at the end of the day, in terms of accuracy, the multiples approach is not better than the DCF approach. So, our recommendation is to use multiples as a test of reasonability of our DCF model assumptions. In other words, if two approaches yield very different results, there is a good chance we overlooked some information and we may want to search for more data before making any investment decisions.
In a word, the uncertainty in valuation is in the nature of high-growth and thriving Fintech companies. And this is exactly the source of the charm of the Fintech industry. As we are not chosen as prophets, the countermeasure is always to dig deep into the underlying logic of the business model and diversify our portfolio as much.


1 Comment
Aaron Saldanha · 28 March 2022 at 19:38
good read, thanks for posting- looking forward to more