Introduction
Global economies faced a lot of growth pressure in the last two years arising from rising interest rates, increased inflation, geo-political tensions, and a slowdown in the Chinese property market. Some of these issues are likely to remain a key theme throughout the year. The monetary cycle seems to have peaked with market participants pricing in cuts in 2024, although to a lesser extent than previously forecasted. A market economic slowdown is expected in the following months, however a global or even US recession is very unlikely as growth, employment and disposable income are robust.
In this article we will explore the possible drivers of copper prices by assessing the supply/demand imbalance, explore the impact of the Chinese property market and the electrifications and datacentre demand trends we are witnessing. We will conclude with a trade idea that should benefit from factors that will be mentioned in this paper.
Copper – fundamentals
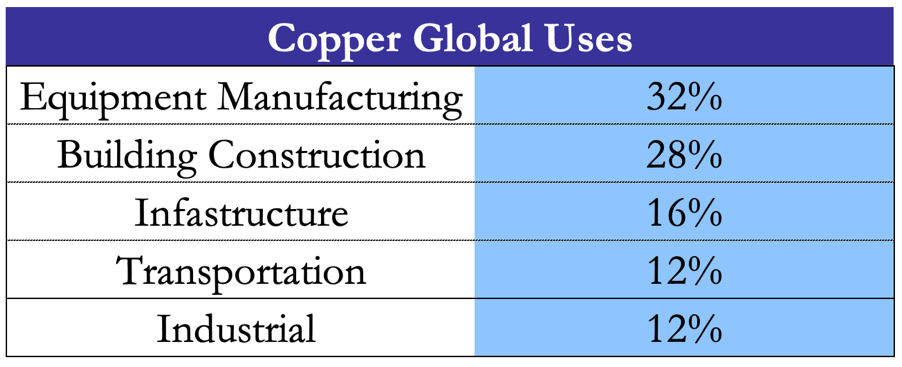
Historically, copper was the first metal to be worked by people. The discovery that it could be hardened with a little tin to form the alloy bronze gave the name to the Bronze Age. Copper (Cu) is a chemical element that is a malleable, soft, and ductile with very high electrical and thermal conductivity. Right now, copper finds application in various sectors including building construction, power generation, transmission, electronic manufacturing, and the production of industrial machinery and transportation vehicles. Most copper is used in electrical equipment such as wiring and motors. This is because it conducts both heat and electricity very well and can be drawn into wires. It also has uses in construction (for example roofing and plumbing), and industrial machinery (such as heat exchangers).
Government of Canda, BSIC
Copper plays a vital role in automobiles, being a key ingredient in motors, wiring, radiators, connectors, brakes, and bearings. On average, a car contains 1.5 kilometres of copper wire, with the total copper amount varying from 20 kilograms in smaller vehicles to 45 kilograms in luxury and hybrid models. As demand for cars is very cyclical, the demand of copper used to manufacture vehicles varies a lot in respect to GDP, thus overall copper spot prices should benefit from increases in global GDP.
Other copper use cases will be described thought-out the report.
Copper – Supply and Demand dynamics
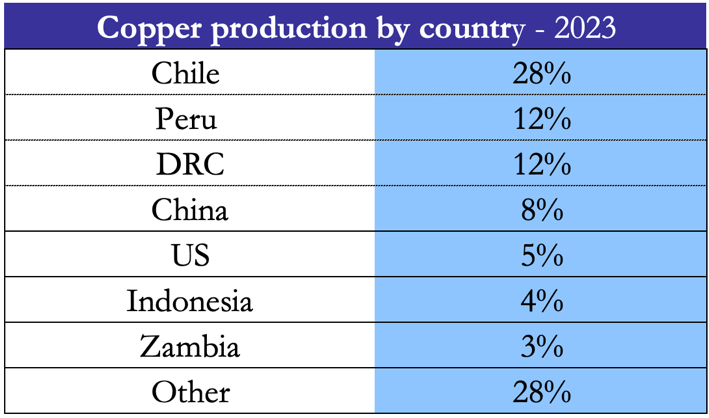
Over the past 25 years, there has been a significant surge in both the production and consumption of copper worldwide due to the entry of major developing nations into the global market. Over the last two decades, the Andean region of South America has risen to prominence as the most prolific copper-producing area globally. Currently, Chile is the world leader in mined copper production, with 28% of the global total of mined production.
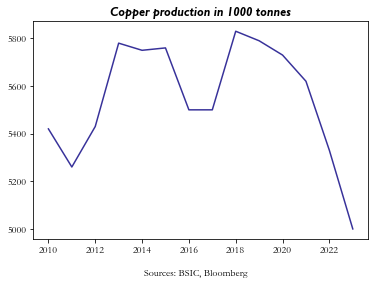
In 2023, Chile’s copper mine production was estimated at 5.33 million metric tons of content, representing about 24 percent of the global copper production that year. After two years of economic upheaval across the globe resulting from the COVID-19 pandemic, Chile’s copper output dropped by about ten percent in comparison to 2019. These sharp declines in copper production are both due to mines disruptions including the closure of First’s Quantum Panama mine, and failure of setting up new mines due to environmental concerns. Other factors currently affecting copper shortage are a declining ore grade; limited new finds; geopolitics in major copper-producing regions. In fact, more than 50% of the copper produced in 2020 was from nations categorized as “unstable” or “extremely unstable”.
Furthermore, Peru contributes 12% to the worldwide supply. Since the removal of former President Pedro Castillo in December 2022 following an impeachment trial, the country has experienced ongoing protests that negatively effect mining activity. In January 2023, Glencore, a major mining company, declared the suspension of activities at its Antapaccay copper mine in Peru due to protesters setting fire to its facilities. This further adds long term downside pressure on supply which should be supportive of copper prices.
Other short term supply disruptions that are causing this structural deficit include the drought in Zambia and China smelting activities. Power shortages in Zambia are severely impactic copper production in that area. These power shortages have forced a one-fifth cut in copper production at the Chambishi facilities of Nonferrous Metal Mining Corp. In China, as both spot treatment and and refining charges have collapsed, the margin compression generated on spot smelting revenues continues to be evidenced by the signaling from China’s smelting sector, in fact smelters have proposed a potential 5-10% output cut over the remainder of the year.
Sources: BSIC, Bloomberg
Overall, the supply picture is not looking good. There are a many headwinds to copper production as it becomes increasingly expensive to set up mines due to envirmenetal concerns and lack of government approval, thus leading to less discoveries which negatively impact supply. Let’s keep in mind that all of this is during a period where nations are pushing towards electrification and green energy usage, and copper is one of the main commodities used in order to transition (used in EVs, electric grids ecc…). This creates a “copper paradox”, where the government are reluctant to approve new mining facilities but acknowledge the fact that copper is indespensable in the transition.
On the demand side, Copper is also an essential commodity that should benefit from the energy transition; copper is fundamental to renewable energy infrastructure, energy storage systems, and EVs, thus a quicker transition significantly raises demand for copper. As nations are prioritizing more than ever a sustainable green transition, copper is likely one of the main beneficiaries of this. Electrification is expected to increase annual copper demand from about 25 Mt now to 36.6 Mt by 2031, with supply then forecast to be around 30.1 Mt, creating a 6.5 Mt shortfall at the start of the next decade. Green uses of copper had a 4% share in copper consumption in 2020 and this is expected to more than quadruple to 17% by 2030. A net-zero emissions pathway would create the need for 54% more copper on top of that in 2030.
A revival in demand for Chinese manufactures has been a main driver behind copper’s outperformance of stocks since the start of the year. The Chinese purchasing manager’s index rose in March for the first time since September, indicating that factory activity is expanding again, and thus the need for copper. This will provoke pressure on the already rising copper prices. Morgan Stanley forecasts indicate a 0.7% reduction in supply for the year 2024, which will certainly exert positive price pressure on the commodity, as mentioned before. Although China is a major driver of demand, the overall health and robustness of economies worldwide will also contribute to an increase. The Industry of Supply Management reported the first increase in its index tracking US factor activity in March too, this month being the first since September 2022, meaning global demand is likely to climb too.
According to Goldman Sachs, China copper inventories topped out at 450Kt and expect inventories to trend towards stocks levels of Q2. This is coupled with a robust China demand and ongoing supply side shocks. Apparent demand for copper rose 12% YoY in Q1, while end demand rose 9% YoY in January-February alone. Whilst property completions have been a demand drag, this has been more than offset by strong YoY growth in renewables (solar +80%, wind +69%) and grid investment (+4%) related demand.
Another fundamental driver of copper demand recently has been AI related products as datacentre power demand will become a structural driver of copper prices in the next decade. It is currently estimated that 1MW of datacentre power capacity requires 20 to 40 tonnes of copper. The International Energy Agency (IEA) said that data centres consumed 460TWh in 2022, a figure that could rise to more than 1,000TWh by 2026 in a worst-case scenario. The base case for the IEA is that datacentre power demand is to grow at 15% CAGR untill 2026, which would require 2.6Mt of cumulative new copper demand by 2030. Under the IEA’s upside scenario of 23% CAGR, copper demand is likely to rise by approximately 5Mt by 2030. The key variable that will influence secular demand growth for copper is the rate of datacentre power capacity, therefore estimates can vary considerably. This demand impulse is coupled with an already forecasted copper deficit of 4Mt by 2030 leading to a wider supply/demand imbalance. In 2023, there were 3.1GW datacentre power additions in the USA, of which approximately 73% was in AI dedicated datacentres. The street is expecting 15GW of datacentre power capacity growth in 2024-25E, of which 86% is in AI datacentres. Interestingly, AI dedicated datacentres will carry higher copper intensities versus traditional GPUs and Cloud Datacentre, due to three times the power requirements versus a traditional GPUs and Cloud Datacentre. Overall, depending on the CAGR, the datacentre power demand increase can lead to 2-3.5% increase in global copper demand by 2030.
Commodities are also being used by investors to hedge against inflation, which has not stopped concerning central banks worldwide, a factor that could also contribute to price increases.
Iron Ore – Main Differences
Another metal which has not managed to capture copper’s spotlight and is having a much more difficult year is iron ore. China’s overbuilt and faulty real estate sector has greatly depressed sentiment and plunged demand. Other steel dependent sectors which are not flourishing right now in the world’s second largest economy include car making and home appliance companies. Iron ore has already plunged 24% this year alone, and demand does not look like it will pick up in the near future, as scrap becomes increasingly available, and new demand forecasts are flat. The fact that no clear end to China’s real estate crisis is in sight, as major developers receive liquidation petitions, is a main contributor to the projected muted demand. The Royal bank of Australia predicts that iron ore demand from China will be 58 million tonnes by 2050. This figure is 80% down from the 296 million tonne levels of 2019. High levels of government debt, and a declining population are other factors which will help reduce iron ore demand from China, the world’s largest importer, in the near future. Forecasts by the RBA also see improbable that other nations will fill China’s gap, as India for example has a development plan which is far less construction heavy.
Prices are likely continue falling as massive projects such as the one Owned by Rio Tinto are projected to increase supply by double digits this year giving a double edge sword of low demand and high supply to the commodity’s price. Chinese mining companies have also put forth a sharp increase in supply with March 2024 ore production having a YoY increase of 14.5%. This increase in supply with questionable demand is especially concerning as spring has historically been the peak demand period for steel in China (iron ore is necessary for the production of steel). These two commodities which have had correlated returns for the last two decades are now seeing a major diversion in their path due to idiosyncratic and macroeconomic reasons.
This we think gives rise to an investment opportunity.
Trade idea
Copper can be relatively forward looking compared to many physical commodities (such as oil) which more closely price near-term physical fundamentals. Copper’s quasi-equity-like characteristics reflect a combination of relatively low demand and supply elasticities, and high levels of investor positioning volatility compared to physical balances. Therefore, dramatic shifts in demand and supply can alter copper trading activities for a sustained period of time, as we think will happen now. The trade can also be supported by a second leg where we short iron ore. Iron ore has suffered from almost contrary symptoms compared to those of copper, with high supply and low projected demand.
To take advantage of these dynamics we propose a long position in LME COPPER futures contract delivering in June currently priced at 9854.16 (USD/MT). The second leg would involve going short on an SGX TSI Iron Ore CFR China (62%) contract, traded on the Singapore exchange, priced at 105.05 (USD/MT). The investment proposition could also be valid for futures contracts delivering in 6 months in our view, since the drivers behind the widening of prices we predict, we think are going persist into the medium term.
The main risks to our trade idea are that supply chain issues are gradually resolved for copper, by new openings of mines, or improved efficiency of current ones. These possible fluctuations in supply dynamics however are likely to be lengthy processes due to reglementary and environmental implications. Improving mine efficiency is another possible risk, however, is not very probable unless there is a breakthrough in technology. A slowdown in copper demand looks improbable, due to the multitude of sectors which are currently demanding it, and projecting to increase demanding in the future. More probable risks that could negatively affect our trade are the overall health of world economies. In the case that GDP growth slows, copper prices would suffer.
Another potential risk to our thesis is that Iron ore demand rises quickly. This is why we base our view on a maximum 6 month horizon. To avoid being affected by possible fluctuations in mine operation costs and costs of labour, which can greatly mitigate the profits of mining stocks, we stayed away from proposing an investment in extracting companies, who would also benefit from a possible commodity appreciation/depreciation.
References
[1] Sainsbury, Peter, “Copper prices: The top 10 most important drivers”, 2022
[2] International Copper Study Group: World mine production of copper, 2013–2022
[3] Lee Ying Shan: ‘There Isn’t Enough Copper in the World, Shortage Could Last Until 2030’, 2023
[4] Yusuf Khan: ‘Copper Shortage Threatens Green Transition’, 2023


0 Comments