The Ride of Unicorn IPO’s
As big tech firms such as Uber, Lyft, Pinterest and Airbnb go public, a decade of innovations is being harvested. As this rush of technology offerings set out to bring new wealth to Silicon Valley, the mystery of increasing investor appetite for companies with negative earnings becomes more profound. This trend becomes almost equally important for a history buff as a finance enthusiast, as subtle, yet serious, similarities between the dot com bubble and the tech-IPO rush pop up. Last week, the division analyzed recent global market conditions, as well as the potential drivers and expectations driving an IPO process. The cause of alarm that has been driving worrisome headlines, however, is the question of how to value such “high-growth”, cash burning companies. This week’s article aims to take a closer look at how to answer this question.
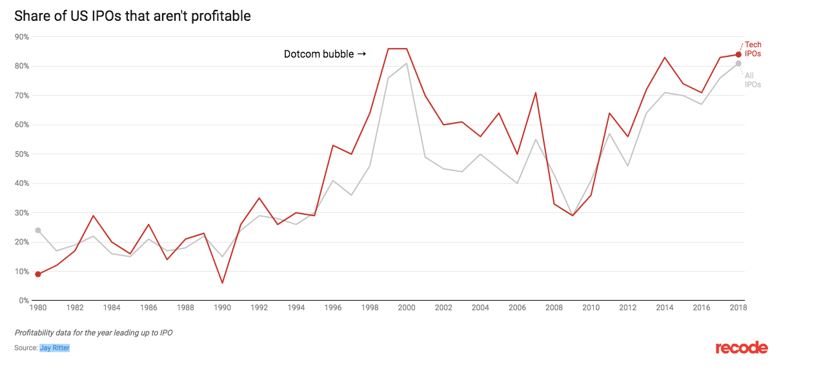
Source: Jay Ritter, Recode
In the wake of this current tech boom, valuation of tech unicorns becomes increasingly important so as to effectively predict or at least understand where this trend is headed. Discounted-cash-flow valuation, though it may sound vastly old school, works where other methods fail, since the core principles of economics and finance apply even in uncharted territories, such as start-ups. The truth is that alternatives, such as price-to-earnings or value-to-sales multiples, are of little use when earnings are negative and when there are not proper benchmarks for sales multiples. More importantly, these shorthand methods fail to account for the unique characteristics of each company in a fast-changing environment, and they provide little insight into what drives valuation. Furthermore, little to no historical data, negative earnings and high growth, as well as the absence of comparable companies make the valuation of these unicorns rather daunting.
The following points are to be considered while implementing a discounted cash flow for such companies (Source: Ashwath Damodaran). With the example of the hottest IPO of Lyft, the points are elaborated as follows:
- Most up-to-date information:
For firms with negative earnings and high growth in revenues, the numbers tend to change drastically between time periods. Consequently, it makes more sense to look at the most recent information that one can obtain, at least on revenues and earnings, for firms that are growing at very high rates. Using the revenues and earnings from the trailing twelve months, for instance, will provide a much better estimate of value than using earnings from the last financial year. If the updated information is not readily available, which is often the case, estimates obtained by scaling all of the inputs to reflect the growth in revenues that has occurred between the last financial year and the trailing twelve months can be used.
- Expected Revenue Growth:
The second key input in these valuations requires drawing on a number of sources to estimate.
- Past growth rate in revenues within the firm itself: Since the firm increases in scale as it grows, it will become more and more difficult to maintain very high growth rates. For a company such as Lyft or Uber, this growth lies in the number of riders it registers or the number of users it retains. Further, the high growth rates over the first few years are expected to taper to lower rates as time passes.
- Growth rate in the overall market that the firm serves: It is far easier for firms to maintain high growth rates in markets that are themselves growing at high rates than it is for them to do so in stable markets.
- Barriers to entry and competitive advantages possessed by the firm: For a firm to be able to sustain high growth rates, it must have some sustainable competitive advantage. This may come from legal protection (as is the case with a patent), a superior product or service, brand name and from being the first mover into a market. If the competitive advantage looks sustainable, high growth is much more likely to last for a long period. If it is not, it will taper off much faster. In the case of Lyft, this competitive advantage could possibly be in the arena of self-driving cars that the company is massively investing in.
- Sustainable Operating Margin:
In many ways the true test of these valuations is being able to visualize what a young, high-growth firm will look like when growth stabilizes. In the absence of comparable firms, the difficulty of this task is magnified. Again, a few guidelines help:
- Looking at the underlying business that this firm is in, consider its true competitors: For instance, while Lyft is considered to be a tech firm, it is ultimately a rideshare company. At least from the perspective of margins, in the rideshare market, which company succeeds to attain the best margins first will be a critical point to consider.
- Deconstruct the firm’s current income statement to get a truer measure of its operating margin: Many young start-up firms that report negative earnings do so, not because their operating expenses from generating current revenues are large, but because accounting convention requires them to report research, development and other investment expenses as operating expenses. In the case of Lyft, since research and development expenses are separated from other operating expenses in income statements, estimating margins and profitability prior to these expenses is a useful exercise in figuring out how profitable a company’s products truly are.
- Reinvestment Needs:
Growth in operating income ultimately is a function of how much a firm reinvests and how well it reinvests (measured by the return on capital). This formulation cannot be used to estimate reinvestment needs for start-up firms that are losing money, especially in the years of transition. In steady state, however, the reinvestment needs can be computed using the expected growth rate and the expected return on capital: Expected Reinvestment Rate (stable) = Expected Growth (stable) / ROC (stable)
There are three alternatives to using this formulation:
- Assuming that the firm’s existing reinvestments (in the form of net capital expenditures and non-cash working capital) will grow at the same rate as revenues, it can be deducted that the existing reinvestments represent a reasonable base value. Building off existing reinvestments can be dangerous in young firms, since reinvestments tend to be volatile and change substantially from year to year. This effect can also be problematic when firms grow through acquisitions, since a large acquisition in one year may be followed by a few years with no acquisitions. Furthermore, to deal with the assumption of growth occurring in the same year as reinvestment, a lag can be introduced between these two periods. For instance, a 100% growth in reinvestment this year will lead to a 100% growth in revenue two years later.
- The firm’s reinvestment rate can be assumed to approach that of the industry. For instance, reinvestments can be measured as a percentage of revenues. For high growth firms, this is likely to be a high number. As the firm’s growth declines, it should become lower and approach typical numbers for the industry. For this approach to work, however, capital expenditure has to be defined consistently across the industry (and include acquisitions and other external reinvestment) and the industry has to include mature firms.
- There is a variation of the fundamental growth formula that can be put to use to estimate reinvestments in future years. While the return on capital and reinvestment rate will be negative for firms with negative earnings, we can compute the typical payoff in revenues that we get for a given dollar reinvestment in the form of a sales to capital ratio:
Sales to Capital Ratio = Revenues/ Capital Invested
A sales to capital ratio of 2 would indicate that a dollar invested in new capital (which can take the form of internal capital expenditures, acquisitions or working capital) creates two dollars in revenues. The dollar reinvestment needed each year can then be estimated based upon the expected dollar revenue change each year and the sales to capital ratio.
$ reinvestment in year n = Change in $ Revenues in year n / (Sales/Capital)
The higher the sales to capital ratio, the lower the reinvestment needs for any given revenue growth and the higher the value of the firm. To estimate this ratio, we can look at the company’s own limited history, and look at its marginal sales to capital ratio (change in revenues/change in capital) in prior years. Alternatively, we can look at the sector and the average sales to capital ratio for the sector. The advantage of using this approach as opposed to the other two is that growth and reinvestment are tied together. Increasing one will increase the other. Thus, we take into account the correlation in valuation, where growth rates are increased and reinvestment needs are decreased simultaneously.
- Risk Parameters and Discount Rates:
Owing to lack of historical data, the regression beta estimates for firms that have a limited history tend to have substantial error associated with them. If there are comparable firms that have been listed for two or more years, the current risk parameters for the firm can be estimated by looking at the averages for these firms. If such firms do not exist, risk parameters can be estimated using the financial characteristics of the firm – the volatility in earnings, their size, cash flow characteristics and financial leverage. These risk parameters should not be left unchanged over the estimation period. As the firm matures and moves towards its sustainable margin and stable growth, the risk parameters should also approach those of an average firm. In addition to estimating the cost of equity for these firms, how leverage will change over time also has to be estimated. Again, targeting an industry-average or an optimal debt ratio for this firm (as it will look in steady state) should yield reasonable estimates for the cost of capital over time.
- Firm Valuation and Equity Valuation:
With the inputs on earnings, reinvestment rates and risk parameters over time, this valuation becomes much more conventional. In many cases, the cash flows in the early years will be negative, in keeping with the negative earnings, but turn positive in later years as margins improve. The bulk of the value will generally be in the terminal value. Consequently, the assumptions about what the firm will look like in stable growth are significant.
- Valuation of Equity Per Share:
The conventional way to estimate value per share is to divide the equity value by the number of shares outstanding. For high-growth, start-up firms, especially in the United States, there is one significant consideration. These firms often reward their employees, not with cash bonuses (they cannot afford them) but with options on the stock, as in the case of Lyft. Over time, these option grants can amount to a significant portion of the outstanding equity in the firm. To get to the value per share, we need to net out the estimated value of these options from the equity value. Since firms in the U.S. are required to report the number of options that they have granted, the average strike price on these options and the average maturity, simple option pricing models can be used to value these options.
Value of Firm – Value of Debt = Value of Equity
Value of Options granted to Employees = Value of Equity in Common Stock / Number of Shares outstanding = Value per Share
This approach contrasts with a much more widely used “treasury stock approach”, where the exercise value of the options is added to the value of the equity, and the total value is divided by the fully diluted number of shares. That approach will understate the value of the options, because they do not consider the time value of the options. If the options outstanding are deep in the money, this approach should give very similar results.
In general, the inputs that have the greatest impact on value are the estimates of sustainable margins and revenue growth. To a lesser degree, assumptions on time taken to reach a sustainable margin and reinvestment needs in stable growth have an impact on value, as well. In practical terms, the bulk of the value of these firms is derived from the terminal value. While this can be tricky, it mirrors how an investor makes returns in these firms. The payoff to these investors takes the form of price appreciation rather than dividends or stock buybacks. Another way of explaining the dependence on terminal value and the importance of the sustainable growth assumption is in terms of assets in place and future growth. The value of any firm can be written as the sum of the two:
Value of Firm = Value of Assets in Place + Value of Growth Potential
For start-up firms with negative earnings, almost all of the value can be attributed to the second component. Not surprisingly, the firm value is determined by assumptions about the latter.
How are unprofitable, cash-burning companies earning such faith in the markets?
Investors are increasingly willing to buy in now in order to subsidize and grow a company that could make large amounts of money later. They seem to believe that the companies’ future profits will trump the current losses.
Remembering the Amazon prototype, the retail giant has been notorious for taking in little profit relative to revenue in order to grow its business and invest in new initiatives for future profitability — a strategy that has worked wonders and that many companies are trying to replicate, often forgetting the diverse revenue stream the giant produces. It is also important to note that just because a company doesn’t report a profit doesn’t mean it couldn’t be profitable. For instance, in the case of Lyft, if the company had not spent any money on sales and marketing or R&D, it would have turned profitable in 2018. The flip side is that without those expenses, Lyft’s customer base would not grow, and it could not venture into new trends such as driverless cars that have massive potential for future profitability.


0 Comments