Over the last few decades, the overnight and intraday returns of the American market exhibit strange behavior, considering that the highest share of returns accrue in the after-hours trading and not during the day, as most would have expected. Indeed, a good visualization of the phenomenon is shown by the following graph, in which we can observe the sheer difference between the two categories over time. Given this overnight puzzle, many economists have tried to clarify the paradoxical behaviour of the stock market. In a staff report of Federal Reserve Bank of New York, Boyarchenko et al. provide a thesis that we found particularly insightful. In the second part of the article, we will have a look at the more controversial interpretation of Bruce Knuteson.
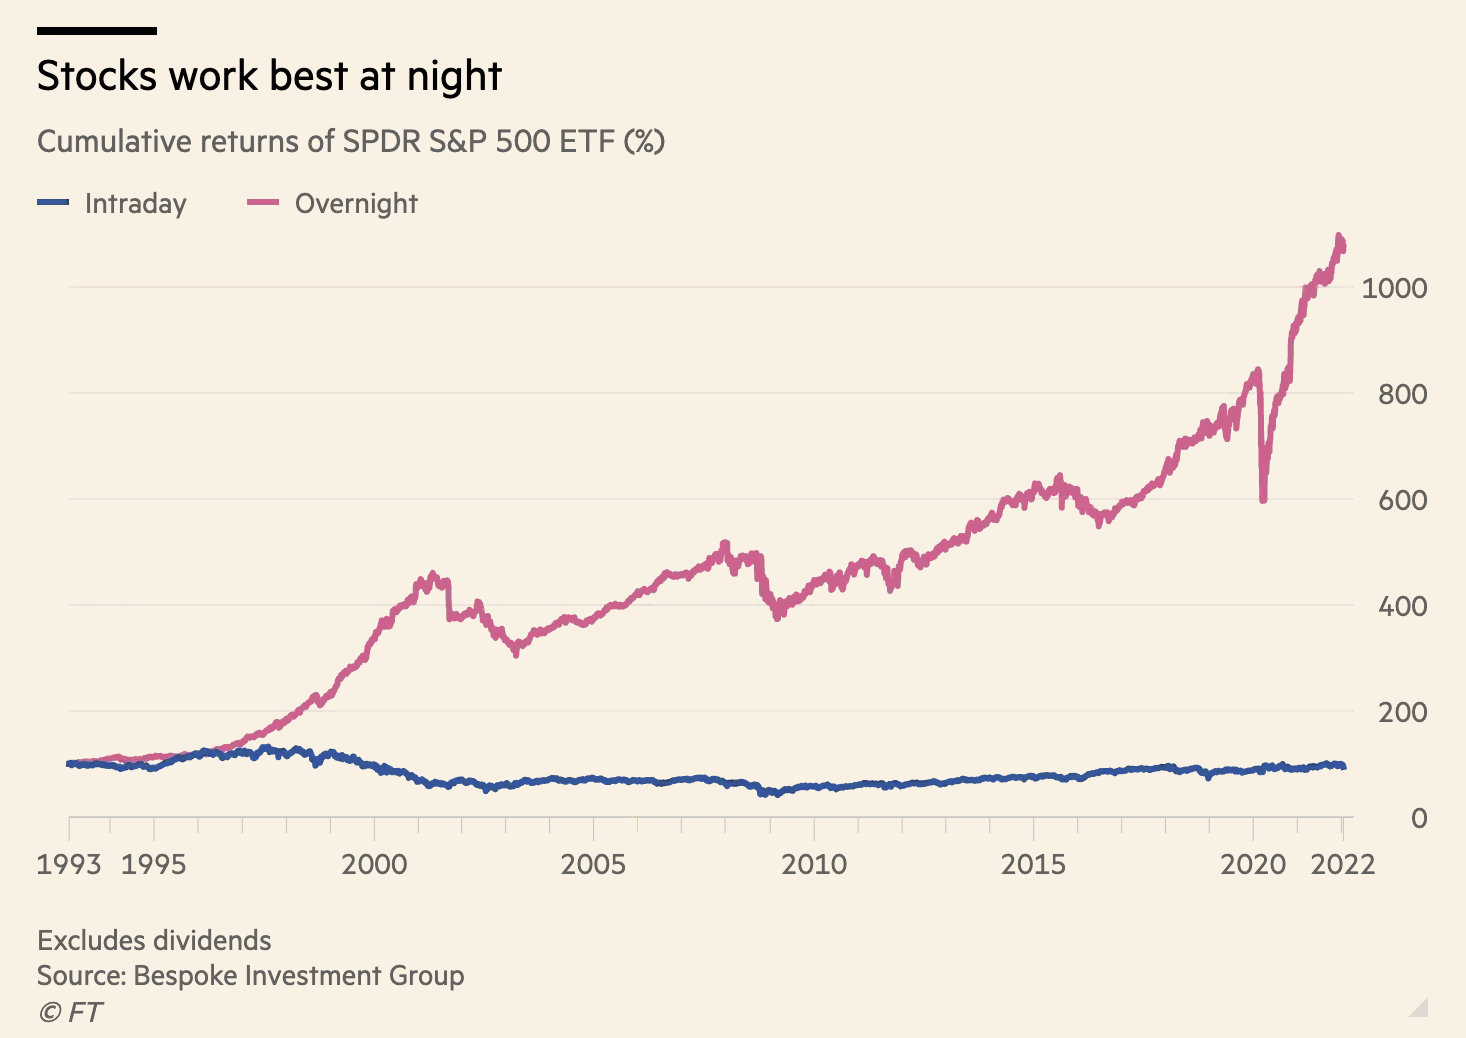
Source: FT
The Overnight Drift
Through a more in-depth empirical analysis, it is possible to verify that these overnight returns do not accrue linearly across pre-market hours. In fact, they follow a U-shaped pattern during three distinct periods: 6:00 pm to 2:00 am, 2:00 am to 3:00 am, and finally 3:00 am to 8:30 am (see the figure below). These time spans represent the opening of the Asian markets, the European markets, and the US macro announcements. This particularity can be explained by introducing the concepts of inventory risk for market makers, which we consider risk-averse agents. In the event of a big sell-off during intraday operations, for example, market makers face market close bearing an increased risk, given the fact they have to keep a long position on potentially risky securities. Therefore, considering the 24 hours nature of the stock market thanks to futures contracts, when a new agent enters the market looking for immediate liquidity, the market makers demand by the latter the payment of a risk premium for having faced this inventory risk. This price inversion also holds in the event of a market rally during the day but with opposite signs. It should mean that the phenomenon offsets itself, alternating bullish and bearish trading sessions.

Source: Thomson Reuters
Yet, what is particularly astounding is that, on average, there is in fact a substantial asymmetry between positive returns after selloffs and after rallies, with the former being considerably larger (8.95% during Asian hours and 14.5% during European hours vs. -8.84% during Asian hours and -0.4% during European Hours).
The main cause of this imbalance in returns is to be found in the market makers’ expected profits.
If we consider  to be the price of the security at the open of our first day,
  the price to which it drops intraday, and finally
  the rebound price after Asian or European markets open, we can derive that returns overnight are given by:

It follows that for a given market maker (MM), the conditional expected returns are given by:

If we break down the above formula, trying to understand which element causes this asymmetry in positive returns, we first discover that order imbalance, which we define as:

is shown to return an overnight price reversal, which is however much stronger during market selloffs than in the instance of market rallies.
Moreover, aggregate risk-bearing capacity by market makers on the futures market is much smaller in the case of negative price pressure intraday: indeed, unlike the regular stock market, market makers are not forced to provide liquidity for futures contracts. This means that in the case of a bearish market during the day, many market makers are likely to leave the market, while those who stay have far more risk-averse behaviors, which translates to less willingness to bear inventory risk and thus higher demanded premium. On the other hand, in the case of a bullish market during the day, the opposite situation (meaning new market makers joining the futures market overnight) is far less likely to happen, given the known price reversals caused by order imbalances. Therefore, the overall outcome is higher-order imbalances and smaller risk-bearing capacity during market selloffs, resulting in an overall average positive overnight return.
Oddly enough, return variance (meaning the risk of the security holding) does not contribute further to this asymmetry. If we analyze data from End of the Day VIX, we find a symmetrical distribution on positive versus negative days.
Is it possible to design a trading strategy that accounts for this overnight return and is profitable? At first glance, trivial ideas like opening a long position between 2:00 am and 3:00 am or between 1:30 am and 3:30 am seem to yield positive returns to traders (3.94% and 6.37%). Yet, if we consider transaction costs, the aforementioned approaches fail to remain efficient. It happens because, in general, market makers position their limit order books to incentivize trades that bring their inventory closer to their targets, making a contrarian trade where a client would earn the bid-ask spread less profitable.
The only strategy which manages to maintain a positive return, even after considering all the costs, is the one called “buy the dip”. It refers to the opening of long positions in a broader time span (1:30 am – 3:30 am) only in the event of intraday market selloffs, which can practically be approximated to 50% of trading days, validating even further the thesis of inventory risk.
Bruce Knuteson’s theory

In a series of five somewhat conspiratorially titled papers published from 2018-2022, an ex-D.E. Shaw quant and Assistant Professor of Physics at MIT named Bruce Knuteson began to call attention to the striking empirical facts laid out above (some subset of which had been known for several years.) He contends that no variation of the benign explanations we have examined thus far can explain the gargantuan difference between the distribution of overnight and intraday returns and furthermore, that this return pattern which can be seen in almost all global indices is the result of a particular trading strategy (intentional or as a by-product of many strategies which coincide to produce such an effect) employed by some large systematic money manager(s).
The Strategy, as he calls it, is as follows. Early in the day spreads are wide and depths are thin; while later in the day spreads are narrow, and depths are thick; the price impact of early trades is therefore typically larger than the price impact of equally sized trades later in the day. A repeated sequence of intraday round trips – e.g., buying in the morning and selling in the afternoon – can therefore be expected to result in net price impact in the direction of the morning trade. The mark to market gains on the existing portfolio resulting from the round trip can exceed the cost incurred by crossing the spread twice each day for a sufficiently large portfolio (as the cost of moving the market X% is constant but the profits are proportional to the size of your existing holdings.) In other words, expanding your portfolio in the morning and shrinking it proportionally in the evening leaves an impact on prices (as is documented in market microstructure literature) in your favour, due to the difference in liquidity. This doesn’t have to happen as obviously and discretely as described here, for the same reasoning to apply.
Knuteson estimates the size of the portfolio which is sufficiently large to make this profitable to be roughly $1 billion based on the well-documented square root price impact function. Although, if other market participants are already following the Strategy and holding similar portfolios, all users of the strategy can benefit from the mark to market gains while sharing the round-trip trading costs.

Source: [2]
The large bid-ask spread near market open and the day-to-day uncertainty in trading prevents other market participants from fully arbitraging away the effect of daily round-trip trading by, for example, selling at market open and buying at market close. The threat of such activity does limit the daily price nudge to less than or on the order of the spread near market open (this limit enters the calculation of “sufficiently large” noted above.) However, an average daily nudge of 4 bps takes seven years to push prices by a factor of two and compounded over 25 years is the factor of 11 increase in the S&P 500 index from 1993 to present, as has been the case.
As ludicrous as it sounds, it is the best available explanation for an absurdly large and consistent global effect, and it has received no head-on, in-depth criticism or interest from regulators. It seems this is at least partly due to Knuteson’s brash writing style, but the astonishing empirical facts pertaining to overnight returns warrant more attention than they’ve received, in our opinion. Let’s go through his responses to some common alternative explanations.
- Overnight returns are a risk premium– while overnight is indeed a longer period than trading hours, roughly two-thirds of a typical 24-hour-day’s price variance realises intraday and one-third realises overnight in United States equity markets, thus naively we’d expect intraday expected return to be twice as high as overnight. Furthermore, this explanation does nothing to explain negative intraday returns.
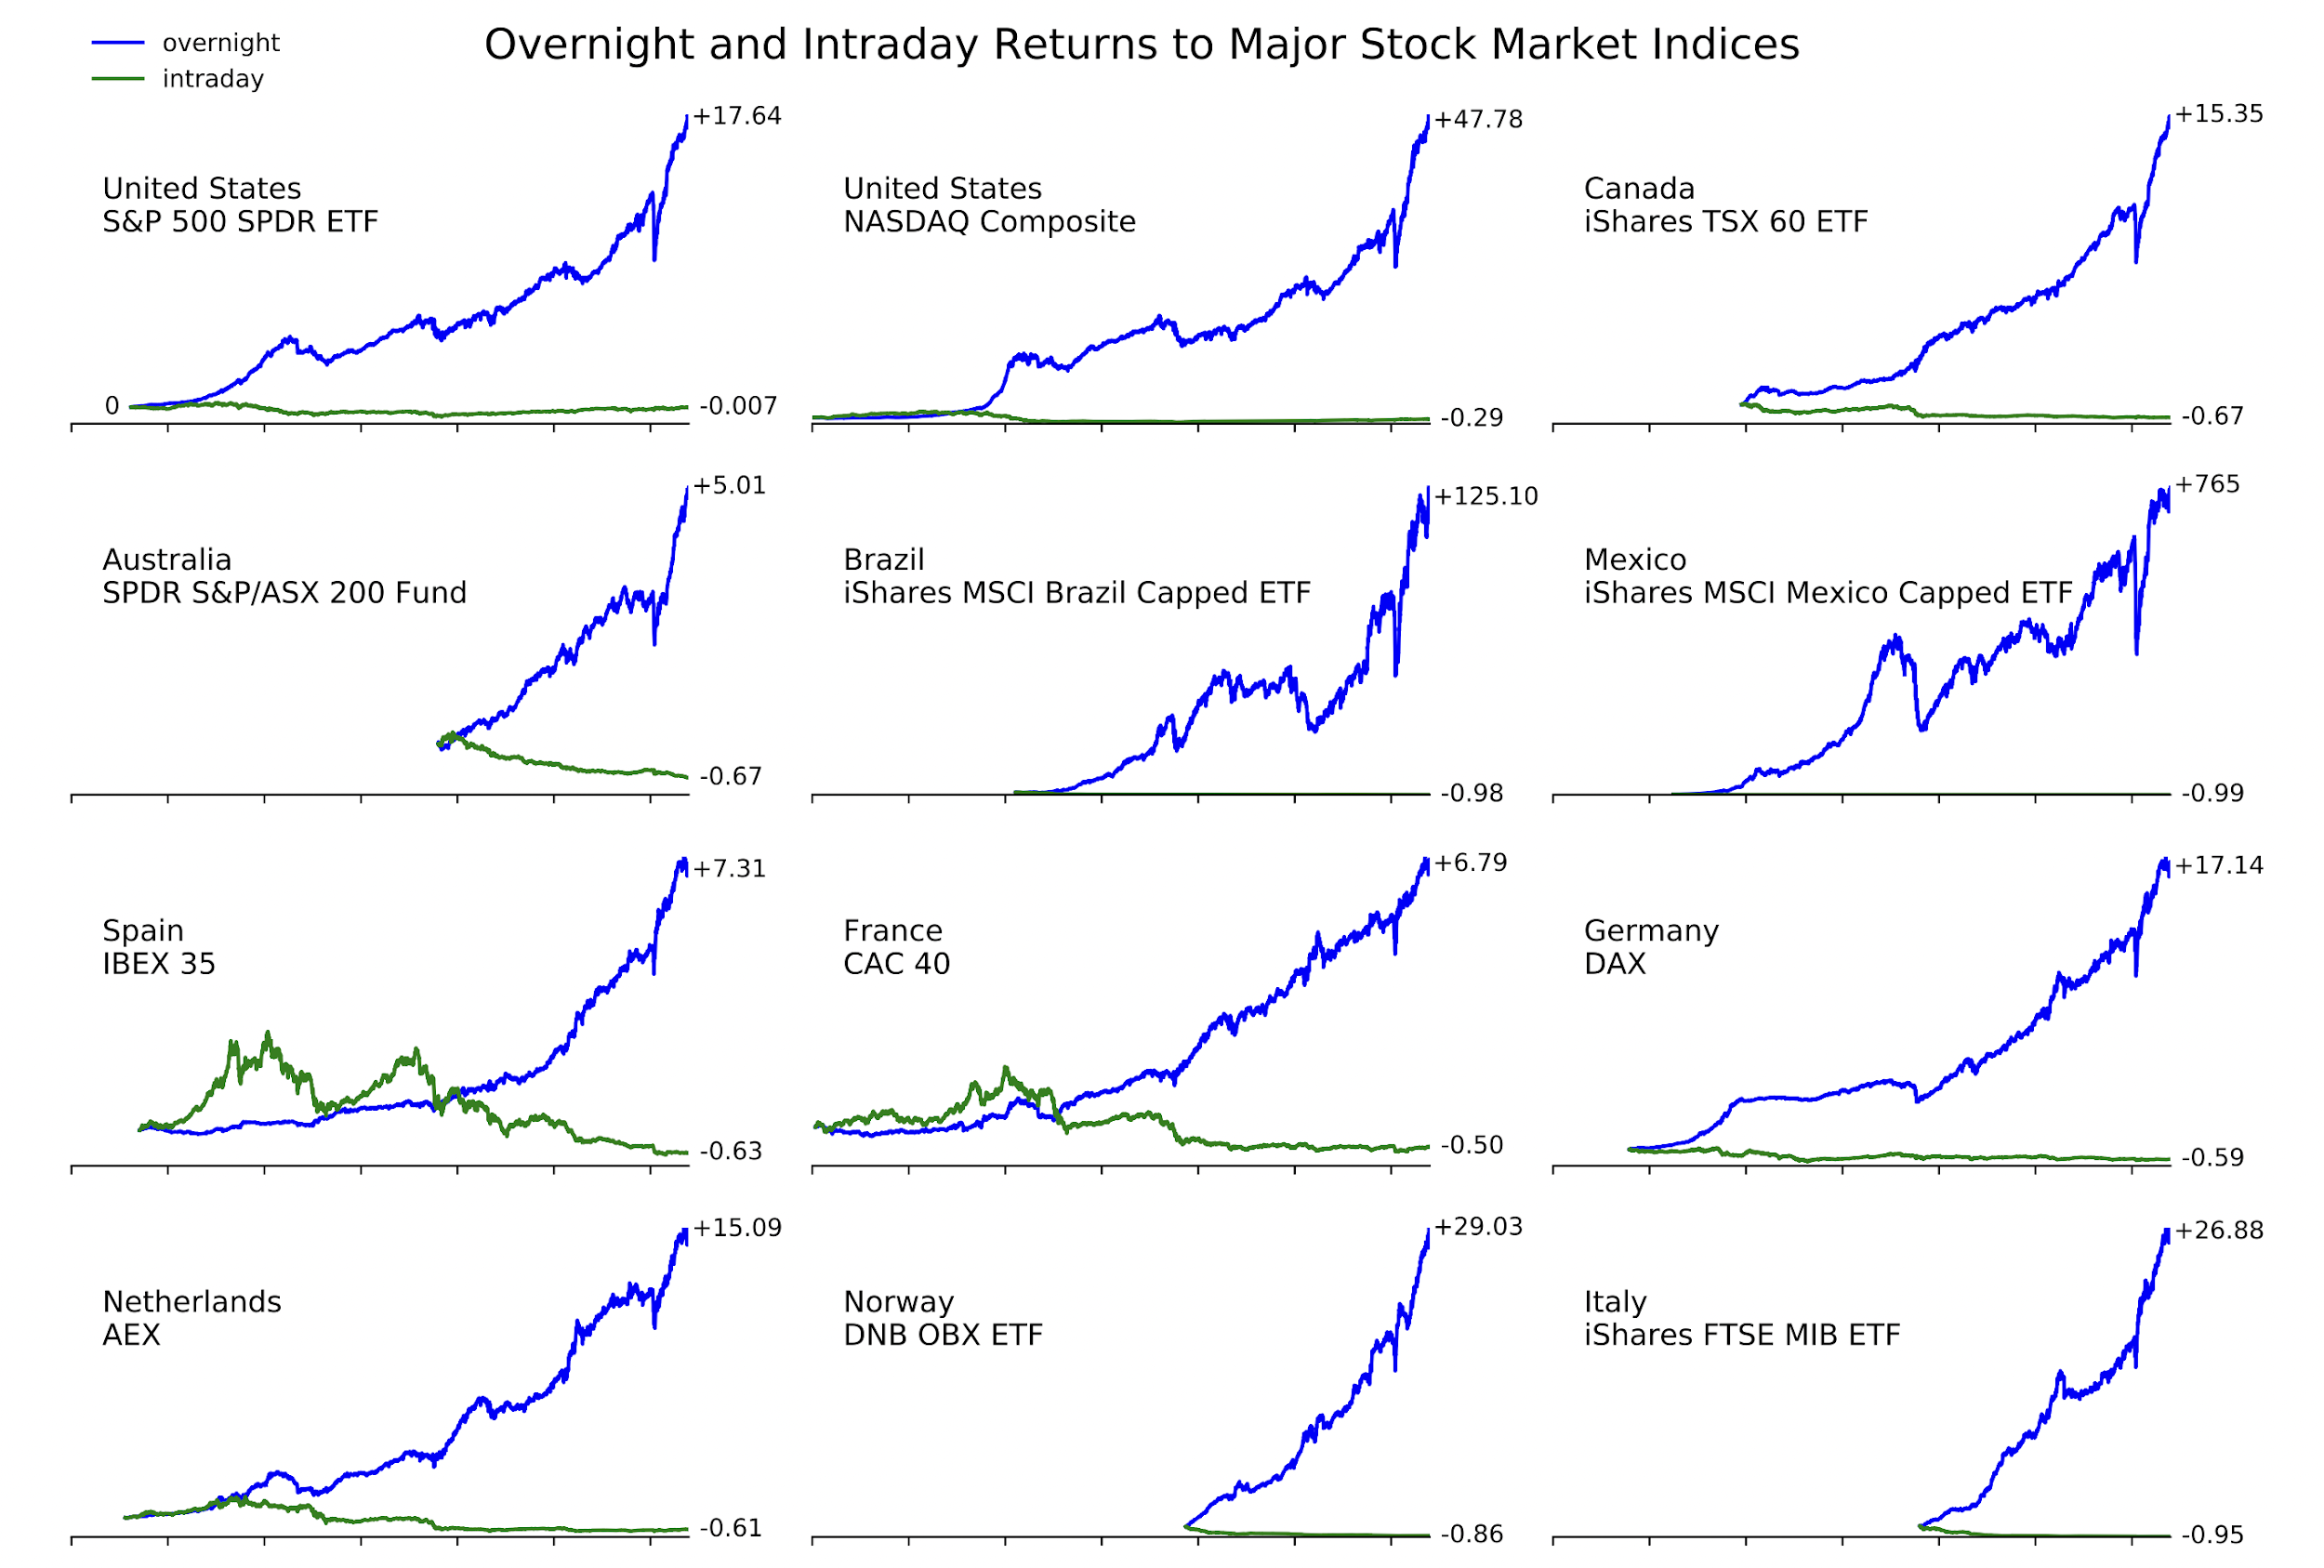
- Company news is released overnight – removing the days corresponding to company earnings announcements does not change the overnight/intraday split shown in the S&P 500 index plot and the release of company news overnight does not explain the consistently negative intraday returns shown in the 18 plots outside the US and China, which range from -50% in France to -99.89% in India (cumulatively).
- The effect is due to hedging flows from derivatives markets – the size of the effect doesn’t seem to vary over time or cross-sectionally in general, even though the size of derivatives markets does.
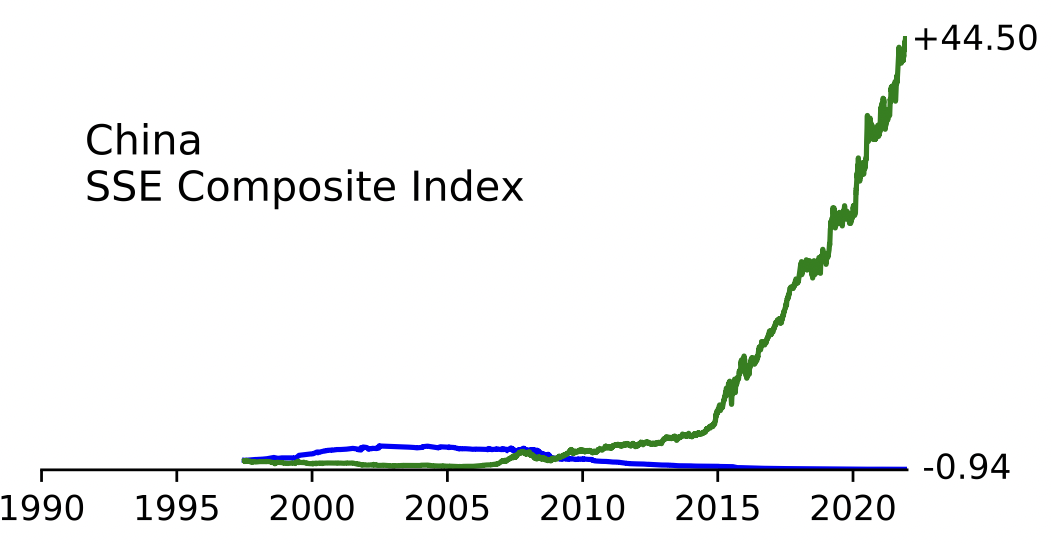
There is one interesting exception to this effect, and that exception is China. China is unique in having a “T+1” trading rule that prohibits purchasing a share of a company and then selling it the same day. However, it legalised short selling in 2010 and it’s totally fine to short a share of a company and then buy it back later the same day, making the “expand your short positions in the morning and contract them in the afternoon” half of the Strategy legal and as expected, the pattern of overnight and intraday returns in China in the last plot in Figure 3 is consistent with firms executing this half of the strategy.
A similar pattern can be seen in many single Chinese Stocks, for example: Shanxi Xinghua-cun Fen Wine Factory, where the cumulative overnight return is −99.98%, the cumulative intraday return is +92,819,731% “the numbers make total sense, if you are absolutely smashed.”
Conclusion
While the overnight puzzle has still not found its final solution, these explanations shed some light on the strange behaviour of stock indices around the globe. We encourage you to dig deeper into the roots of this phenomenon and decide for yourself which theory has more explanatory power.
[1] The Overnight Drift – N. Boyarchenko, L. Larsen, P. Whelan
[2] Information, Impact, Ignorance, Illegality, Investing, and Inequality – B. Knuteson
[3] How to Increase Global Wealth Inequality for Fun and Profit – B. Knuteson
[4] Celebrating Three Decades of Worldwide Stock Market Manipulation – B. Knuteson
[5] Strikingly Suspicious Overnight and Intraday Returns – B. Knuteson
[6] They Still Haven’t Told You – B. Knuteson


0 Comments