Introduction
The private equity industry has always had a special place in the financial world. Its competitive and dynamic nature has captivated the most talented businessmen, but what really allowed it to grow steadily over the past 40 years was the outstanding performance it granted to the investors willing to navigate the illiquid market. We are now at the peak volume of both capital raised and deployed, leading to increasingly higher acquisition multiples and perhaps a decrease in returns. Hereafter we analyse the main forces that are currently transforming the industry and we attempt to predict how it will look like in a few years.
Fundraising
The post-crisis era has witnessed what many define as a coming of age process for the private markets. They have proven capable of offering unparalleled risk-return combinations, thus attracting more and more capital from institutional investors of the likes of pension funds, insurance companies and family offices. In 2018, the industry as a whole has reached $5.8tn, of which $3.4tn in various forms of private equity, $770bn in Private debt and the remaining $1.6tn in so-called real assets. For comparison, the total global market cap of the public equity markets is slightly above the $70tn mark.

The inflow of capital was especially strong in the last few years with industry AUM growing at a CAGR of 7.8% from 2013 to 2018. The main driver are low interest rates, that, on the one hand, provide cheap debt to this ultra-leveraged industry and, on the other, put pressure on institutional investors to move from the unprofitable public debt markets to the more remunerative private markets, allowing them at the same time to diversify into another asset class. The hunger for alternative investments flooded this market with capital in recent years, with 2016 and 2017 marking record numbers of fundraising never seen since the crisis. This huge inflow can be read in different ways: it can be a sign of confidence that the industry has still a lot of room to grow and there is investors’ appetite to sustain it, or it can be seen as an excessive inflow that will raise the bid competition to a point at which entry multiples are too high and they eat up returns. Probably with the looming fear of recession the latter interpretation started gaining traction because in 2018 the fundraising slowed down YoY by 11%. It is still at record high levels with a total $780bn raised globally, but the trade war took a toll on the investments in China and fundraising in China dropped YoY by 27%, driving down the global level.
Focusing on PE we can identify some interesting dynamics. While the overall fundraising declined by 21%, the share of so-called Megafunds (over $1bn) grew substantially, with a particular increase in the number of funds between $5bn and $10bn in size. This can be motivated by the fact that the dispersion of return in PE is larger than in public equity markets and the strongest and most reputable firms attract more and more capital.

Source: Preqin
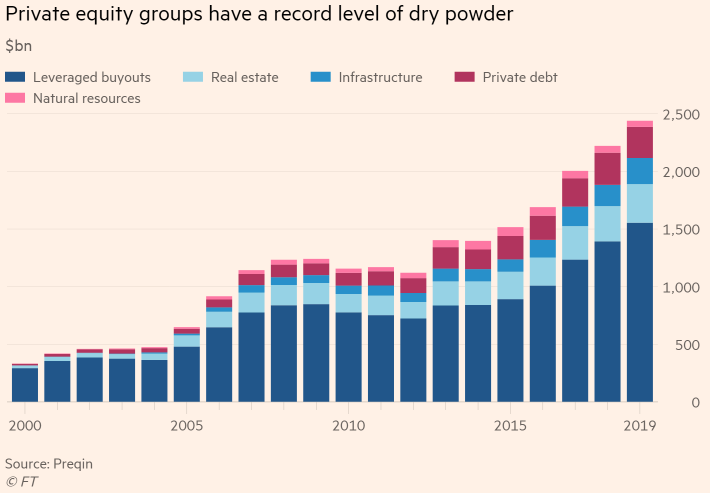
The metric by which it’s measured the accumulation of unused capital in the private markets is the Dry Powder. As money flew into the industry, the problem of allocating it and churning out the returns expected by the investors became harder. Furthermore, with a rise in competition, the result is that a good portion of the capital just stays there waiting. This amounts to more than a third of the entire AUM, reaching the record number of $2.44bn in the first months of 2019.
Status of the Private Equity industry
The increasing pressure to deploy capital and the already sky-high valuations in the public equity market had a double effect on the aggregate trends for deals. On the one hand, the overall volume peaked in 2018 at $1.4tn, a level reached only in 2007 right before the crisis, on the other the number of deals plateaued in 2015 and stayed the same (or even declined) since. This is a sign that the industry is probably approaching its current organic limit and the volume’s increase is due merely to the higher valuations. More in detail, the median EV/EBITDA has reached 11.1x, again we have to go back to before the crisis to find a comparable valuation multiple. However, there are significant differences in the level of debt over EBITDA, that never surpassed the 5.6x threshold after the crisis, but was well above at 6.6x in 2007. Together with the substantially cheaper cost of debt, these features make the current PE industry definitively more stable and resilient than back then.

Another interesting dynamic is how the holding period changed over time. Following the crisis, the average life of the funds increased significantly and especially between 2013 and 2017 half of the funds had maturity over 6 years, compared to only 25% in 2010. In 2016 26% of funds was even beyond 8 years in holding period, something unprecedented. What probably explains this dynamic is the business cycle and the market cycle that follows, indeed during those years it was clear that the market would have continued growing and many PE funds were reluctant to sell trying to capture as much multiple growth as possible. But as the economic growth slowed down in the past two years with the trade tensions mounting and the market uncertainty, the PE funds started selling more and more, hoping to exploit the high exit multiples while they are still there and causing the average holding period to drop again.

The final dynamic we are going to explore is the evolution of exit strategies. The sale to strategic buyers has always been the primary exit at about 65%, as corporates looking for synergies are the most aggressive bidders. The interesting aspect is the gain in popularity of the sponsor-to-sponsor exit, that accounted for a bit more than 20% and has grown to almost 30% in 2018, at the expense of the exit through IPO. The reason is twofold: Private markets are maturing and are able to capture multiple stages of growth of a company, sometimes even its entire life, therefore there is no need for IPOs that are expensive and force disclosure of sensitive data; the other reason is the increasing market volatility of the past years that made many PE funds to rethink their plans and opt for a more solid, self-negotiated deal.
Performance
The PE industry prides itself of its outstanding outperformance of the equity markets over the past 30 years. But this is built on the fact that comparing the returns with public markets is not as straightforward as it seems. The fundamental issue is the lack of good quality and easily accessible data, which is understandable considering the confidential nature of the industry. However, there are also several theoretical issues on the two main methods used to report returns, the IRR and the MOIC (Multiple On the Invested Capital). The former offers an intuitive proxy for returns, but might be misleading because it assumes that every cashflow obtained during the investment life can be reinvested at the same rate, which is not the case in real life. The latter is the ratio between the capital distributed to LPs (the investors) and the capital invested, which offers a simplistic view of returns, as it causes problems in confronting annualized aggregate returns. A better approach is what is called PME (Public Market Equivalent) and consists in investing (or discounting) the initial capital of the fund at the total return of the public market reference index and comparing the resulting value to the value of the cash inflows (all net of fees) of the fund invested (discounted) using the same public market return, you compute a ratio that signals outperformance if above 1 and underperformance if below 1. This metric is harder to compute because the cashflow data are needed and only a few specific datasets have been created, due to the very nature of the industry and the myriad of NDAs signed by funds. A paper by Harris, Jenkinson and Kaplan (2016) has analysed the historical PMEs in the US market for both Buyout and VC strategies.

Source: Burgiss
The years represent the dates of the inception of the funds, therefore a fund set up in 2010 will close on average in 2015. The result is striking in many ways. First of all, it shows that the overperformance has faded away over time (in the case of VC it disappeared by the end of the ‘90s). Furthermore, it is interesting to notice that it outperformed the market during the crisis (again, the years indicate the funds’ inception, so add about 5 years), proving to be a better choice in times of turmoil despite the illiquidity might increase the perceived risk.
Other studies and reports show that in the last few years PE just barely outperformed the market on average, but the key element to take into consideration is the extreme dispersion of returns that is typical of the industry. Therefore, there is a further element to put into the equation for the attractiveness of PE and that is picking (or at least trying) the winners and truly outperform the market with returns sometimes as high as 30-40%.

But taking aside the outliers, the question of whether the industry on average will outperform the markets in the futures remains. However, the aforementioned paper by Harris, Jenkinson and Kaplan might offer some answers. Indeed, they tried to regress the industry PME using the capital inflows of the year of funds’ inception as an independent variable. What they found is that there is a statistically significant negative dependence with R-squared 32%. This result is extremely relevant as it provides some empirical backing for the impact of increased competition due to the huge capital inflows and casts a shadow on the future returns of PE.
Conclusions
There are many worrisome signals: the looming economic slowdown, the extremely high multiples and the excessive capital inflows that accumulate as dry powder. However, private markets are more mature and less leveraged than before the crisis and even then, they outperformed the equity market. The longer-term and more value-driven approach adopted by modern private equity may be exactly the alternative that the institutional investors are desperately looking for. Indeed, this seems to be the case as according to Preqin research the vast majority of them believe that they will either maintain or increase the share of their portfolio dedicated to PE allocations in the next year.


0 Comments