Introduction
By now, everyone, even with only a slight interest in the financial world, has heard or read of the terms Quantitative Easing (QE) and Quantitative Tightening (QT). If on one side the first one, combined with fiscal stimulus, was more than necessary for the world economy to bounce back from the initial crisis inflicted by the pandemic, now that most of the developed economies are becoming overheated with unsustainable levels of inflation, it’s time for central bankers to raise interest rates and start tightening by reducing their balance sheet. In this article, we give an overview of the characteristics of the QT and its asymmetric features with respect to QE. Then we discuss the only precedent that we have and how it ended up leaving few true lessons and a lot of uncertainty about its effects on the economy. Finally, after having described what the market is pricing now, we take a stand and propose our trade idea.
The QT
Quantitative Tightening broadly refers to a type of monetary policy followed by central banks to “normalize” their balance sheet and tackle inflation. But what exactly does this mean? First of all, it is important to understand what happens to the balance sheet of a Central Bank conducting the opposite, that is, Quantitative Easing. QE is a commonly used monetary policy by Central Bankers in times of extreme stress in the financial markets and essentially should encourage lending and investment by increasing the money supply in the financial system. When a Central Bank conducts QE, it buys government bonds but can also opt for other securities like Mortgage-Backed Securities depending on the market situation, with newly created central bank reserves – therefore increasing the central Banks Balance Sheet. By buying government bonds in predictable steps, the Central Bank can, most of the time, successfully lower bond yields, increase investors’ confidence in the markets and spur economic activity. Even though Quantitative Easing is a valuable tool to heave an economy out of recession, especially when interest rates are already close to zero, there are some serious risks attached to it. The worst nightmare of a Central Bank conducting QE is stagflation, that is, when there is elevated inflation due to the increase in money supply but no economic growth. In this case, or when inflation is running too hot, Central Banks not only can but should start tapering (reducing asset purchases), hiking rates and tightening.
As already mentioned in the paragraph above, in QE, the Balance sheet of Central Banks increases; in Quantitative Tightening, exactly the opposite is the case. When QT is being conducted, Central Banks do not reinvest the principals they receive from its bond holdings and therefore drain liquidity from the financial markets resulting in a shrinking of their balance sheet. The main problem with Quantitative Tightening is that Central Banks do not precisely know the effect it has on the financial markets since it has not been utilized as often as other monetary policy tools. Furthermore, it is difficult to know in advance the minimum level of reserves balances the financial system needs to operate. Lastly, the monthly amount of QT a central bank can conduct is restricted to the principal repayments they receive each month, which leads to it being strongly related to the monetary policies followed in the past. In the most extreme cases Central Banks may decide to sell some of their security if the monthly rate of principal not reinvested is not enough for their goal, but this option will not probably be exercised since a broad sell off conducted by Central Banks can spread panic quickly in the market. The mechanics behind QT can be explained using the illustration below.
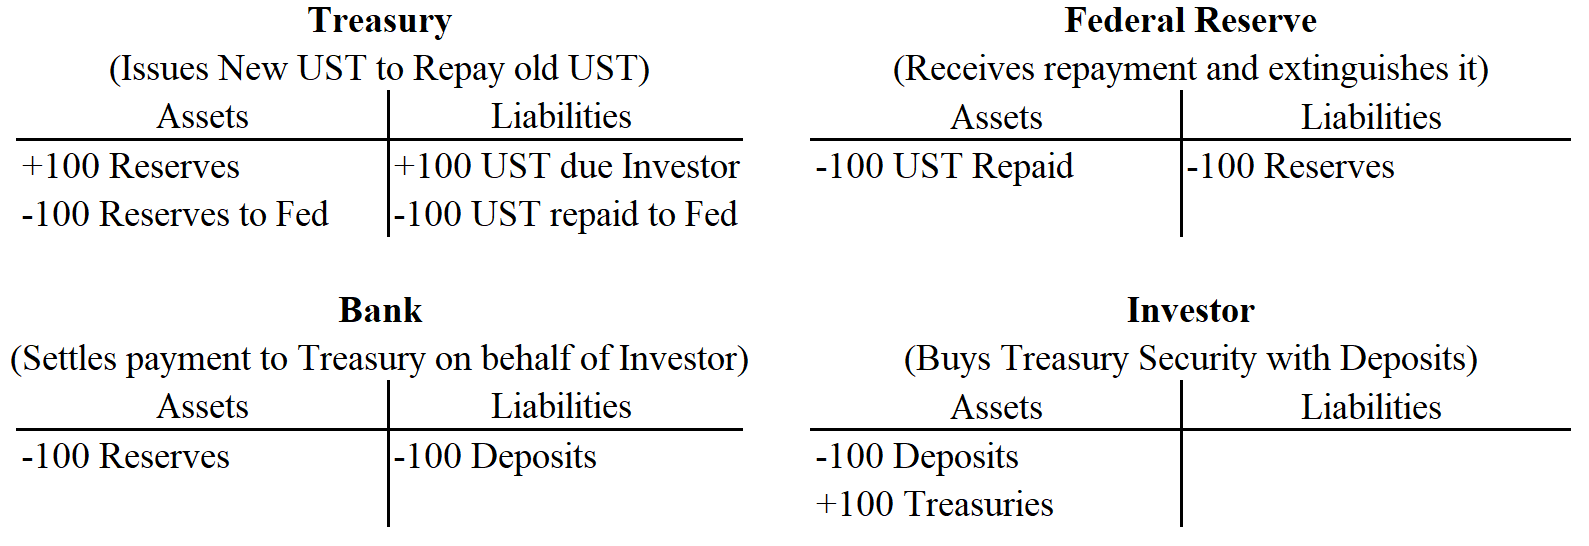
Source: fedguy.com
As one can see looking at the balance sheet of the Federal Reserve and the Treasury, the principal that the Treasury pays to the Fed in Reserves (second line) is extinguished – effectively shrinking its balance sheet. Since the Fed is not buying new debt securities the supply to the private market increases. When examining the balance sheet of the Treasury, Bank and the Investor one can see that the Bank ultimately acts as an intermediary to the investor and the Treasury by sending reserves to the Treasury and withdrawing deposits from the Investor’s account.
Current situation
At the moment, a majority of the world’s biggest economies are fighting with sustainably higher inflation than central banks expected, but in this article, we mainly focus on the market environment faced by the Federal Reserve. There are multiple reasons for this record-high inflation print, such as strong Demand along with Supply-Chain issues and the Great Resignation, which leaves companies fighting for talent by increasing wages – further pushing prices – adding to all that is the highly accommodative monetary policy followed by the Fed. At the beginning of the pandemic, the Federal Reserve started an aggressive purchasing of debt securities to stabilize markets. At the height of the pandemic, the Federal Reserve filled monthly Treasury buy orders of at least $ 80 billion and purchased $40 billions of residential and commercial mortgage-backed securities. Because of this extremely expansive monetary policy (QE), the Federal Reserve could not only boost investors’ confidence and stabilize the markets, but it also increased its balance sheet to before unseen size – from under $4 billion at the start of 2020 to substantially over $ 8 billion in January 2022. ![]()
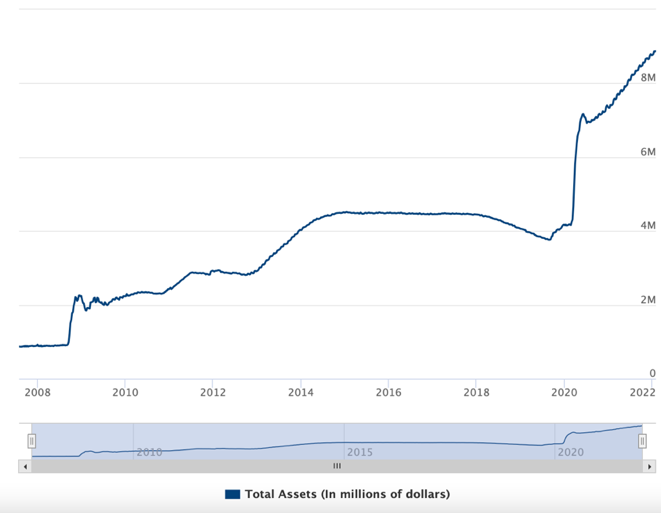
Source: federalreserve.gov
Since the U.S Economy is now facing inflation of 7.5% in the economies fastest annual rise for 40 years, the Fed needs to act now and shift towards a less accommodative monetary policy – which essentially means hiking rates and normalizing their immense balance sheet. The former was already being discussed at the most recent FOMC meeting, and Markets are pricing in at least four rate hikes in 2022, but regarding Quantitative Tightening, Jerome Powell remains exceptionally cautious with his statements – and he has all the reasons to do so.
A look back
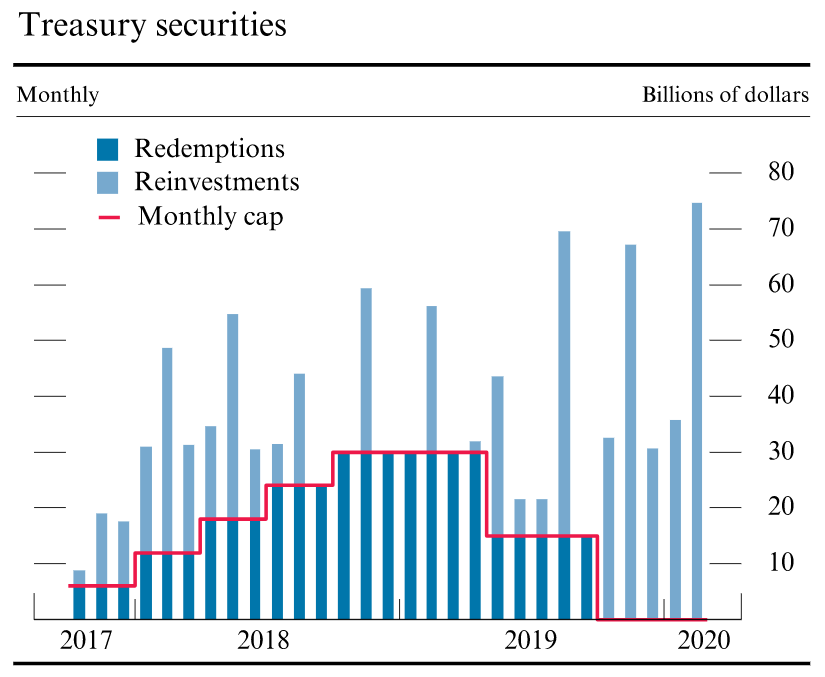
In November 2017, the Fed decided to start Quantitative Tightening after nearly ten years of Quantitative Easing, which saw its balance sheet increase to $4.4 trillion. The FOMC agreed on reducing the assets by a maximum of 50$ billion per month in a process that would take a couple of years. However, this plan was relatively short-lived, as in September 2019, Quantitative Tightening was halted because of a couple of factors. The stock market experienced strong volatility as the S&P 500 lost about 15% over the course of the year and Bond Yields rose significantly, threatening strong economic growth. 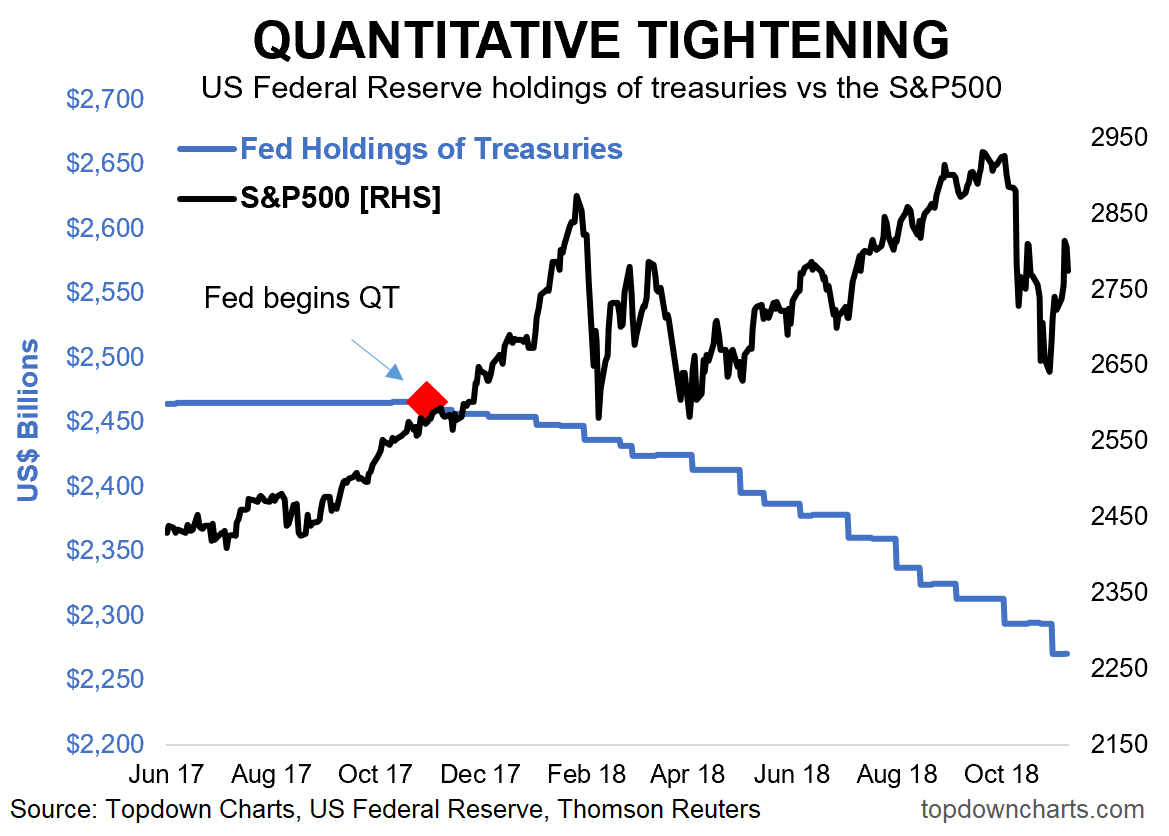
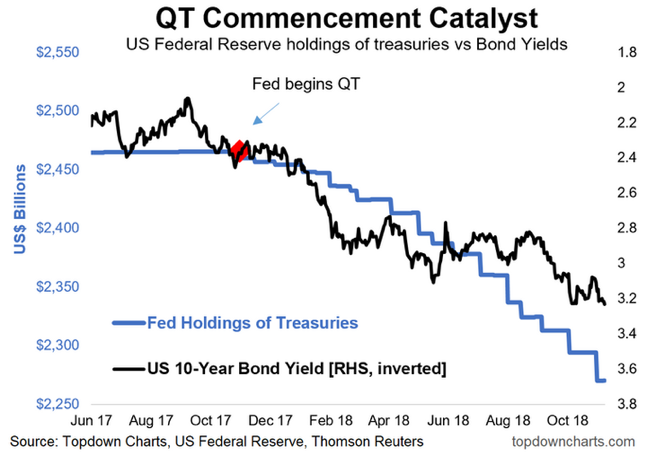
Source: topdowncharts.com Source: topdowncharts.com
The biggest concern, however, was the significant rate increase in the Repo market in 2019. The repo market is vital for the financial system due to its great liquidity, $2 – $4 trillion on average in repurchase agreements are traded each day, financial institutions which own many securities are able to use them as collateral to borrow cheaply and financial institutions with spare cash are able to earn a small return without taking on much risk. Adding to that is the great importance the repo market has to the Fed, since the CB uses it to conduct monetary policy regarding the short term interest rates. The Central Bank watches out that the rates in the repo market trade in line with the benchmark federal funds rate. Therefore, when overnight repo rates exploded in 2019 to as high as 10% intra-day and essentially pushed the effective federal funds rate to 2.30 %, above its target rate of 2.0 – 2.25 %; the Fed had to react – that was stopping QT, so in effect halting the decrease in bank reserves to assure that Banks would continue to act as lenders in the repo market. This serves as a great example to illustrate how the Fed was not able to accurately predict the minimum reserves balances needed for the financial system to function and many believe the Fed still will not be able to do so in case they decide to start QT in the future. ![]()
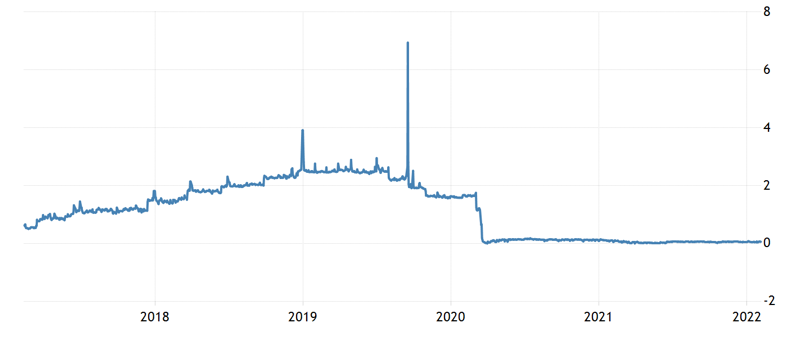
Source: tradingeconomics.com
Source: stlouisfed.org
Market Reaction
In our overview we will mainly consider the US situation where all eyes are focused right now, but the argumentation is valid also for UK, where the BoE has already began its tightening and the Euro Zone, where recent declarations confirmed that the ECB is set to follow the Fed path with a prompt response to inflationary pressure on the economy.
When dealing with monetary tightening the risk of a monetary policy mistake is very high looking at the recent movement of the US yield curve, where the spread between the 2 and 10 year maturities has compressed according to a dynamic called “bear flattening”. The 2-year government bond rate accelerated to 1.487 %, the 10-year rate rose to a lesser extent to 1.918%. Without forgetting that the curve has already undergone an inversion in the part between the ages of 20 and 30. The Fed now is called to a test especially at a communication level, which is particularly difficult for the fate of American growth and beyond.
Any Fed statement perceived as an overshoot of market expectations would give the most urgent message in addressing rising inflationary pressure. The result would likely be a sharp rise in yields, particularly at the front and middle of the curve. The longer end (10 years, 30 years) could remain relatively immune as Powell is likely not to mention the possible peak in the benchmark rate. In fact, despite the enormous size of QE—and the universal agreement that it rescued markets in spring 2020—the evidence that it has a sustained, large effect on long-term bond yields is thin. In theory the Fed’s bond holdings compress the term premium, the component of long-term bond yields that compensates investors for locking up money for a long time. But the term premium does not seem to track central banks’ balance-sheets. Instead, it closely tracks the dispersion in forecasts of inflation, suggesting that it reflects inflation risk. If QE does not have lasting relevance to long term bond yields, neither should QT. The ten-year Treasury yield was lower, not higher, by the end of the last round of QT started in 2017. This means, although the Fed held fewer bonds, their price had risen.
Now that all assumptions are made let’s see what investors are currently predicting for this tightening cycle.
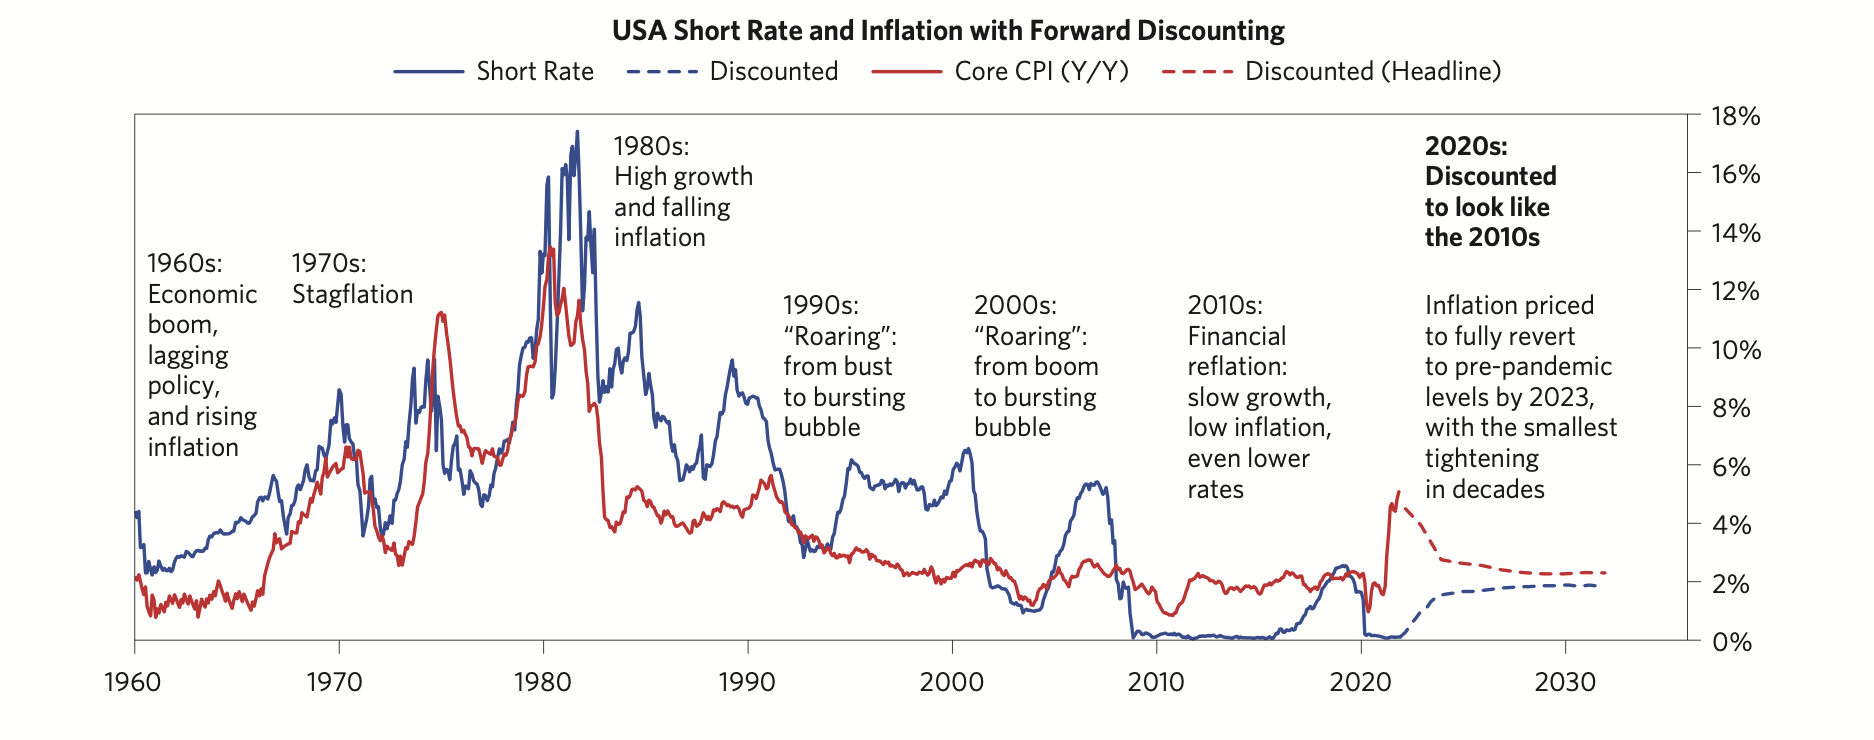
Source: Bridgewater Associates
As shown in the graph, markets are pricing inflation to fully revert by 2023; investors are discounting neither an “aggressive tightening” nor higher inflation in the coming years. A minimal tightening is priced to curb down demand and push down inflation back at its 2% target. US short rates will not reach 2% and together with a minimal tightening cycle they will be enough to revert inflation.
In few words the market is optimistic. Furthermore, by looking at the implied Fed Funds 3y forward minus 2y forward it shows that the Fed is now priced to even cut rates in 2024 after 7 hikes between 2022 and 2023. Investors are not scared by rates hikes accompanied by an aggressive QT and significant alpha opportunities may arise if huge market moves, which currently are not predicted, occur.
On the other side of the coin, since we are diving into the unknown and no concrete theory has been developed so far for the QT market reactions, QT can bizarrely be seen as good news and a source of stimulus. Think for example that the Bank of England in 2018 said it would start ripping off its balance sheet after rates hit 1.5%, but right now plans to stop reinvesting the proceeds of maturing bonds when rates reach just 0.5%. QT from curve-flattener and bad news can be also seen as a replacement tool for interest rates rises by central banks. This is an alternative theory in which most of the market is now hoping for. It can be translated into a new era where rates remain low (even lower than 1%) to stimulate the economy while on the other side central banks slowly diminish their shadow from the markets.
Our view is that QT will play out in a very fragile market characterised also by rates hikes preceding it. The only lesson imparted from the previous QT in 2019 was that reducing cash balances of banks directly impacts the recipients of that cash. That time the recipient was the repo market while now cash has poured into Treasuries and Agency MBS. The $100bn monthly QT proposed by the Fed is very aggressive and may lead to violent dislocation in the two markets cited above. On top of that the growth impulse is decelerating and we therefore will see the Fed tackling inflation in a slowing economy, rising expectations for a weak long term structural growth while at the same time short term rates will move higher to price Fed hiking cycle. Curves are already flattening, and we do not see reasons why they should stop in the medium term.
Trade Idea
Considering the arguments seen above we see the potential for a flattening trade. QT is now considered old news but the market optimism for a “soft tightening” leaves still alpha opportunities for yield curve flattening trades. The curve we propose is the OIS swaps one, since it helps us trading just on the purest risk-free rates without adding credit spreads to it. OIS stands for Overnight Index Swap and it is an interest rates swap over some given term where a given fixed rate is exchanged for a daily compounded overnight rate (Fed funds rate/SOFR, EONIA or SONIA). Due to the balance sheet size of the Fed and consequently its massive QT, our trade will regard Fed Funds rates and USD OIS swaps help to tell us where the market consensus for the Fed Funds rate is.
Source: Bloomberg
We propose to enter a 2y-10y trade on the USD OIS curve where we sell the 2y and buy the 10y which is more anchored to long term expectations and term premium rather than short term rates. The 2y-10y spread is currently at 36bps and the trade bets on a continuous shrinking of it in the medium term (6 months) since the idea is to gain from further pricing of the Fed aggressiveness and not on the full tightening period. As soon as the spread approaches 0 the trade can be closed.
Source: Bloomberg


0 Comments