After weeks of firm bull sentiment, major equity markets (especially European ones) have experienced a fast correction that, although small compared to the incredible year-to-date performance, has started to disturb the overall view of investors.
Such a movement has coincided with a rebound on the EUR/USD, which postponed the breakout of the “parity” barrier, and an even stronger upward change in the price of crude oil. Clearly, the former may be seen as positive to US stock market, where investors were worrying about exporters’ earnings being affected by the strong dollar, while the interpretation of the latter appears less straightforward. For instance, markets have recently interpreted low crude oil prices as a positive news for Western countries, a factor that could boost growth (and, given the impact on the inflation side, fostering easing policies targeted at price growth). However, it was not always the case some months ago (since, for example, it would have implied lower demand from China, thus a slowdown of the Asian giant).
That said, we decided to focus just on the correlations among those three “asset classes”: in particular, we decided to consider the WTI as a proxy for crude oil, the S&P 500 for the equity market (although European markets have been more volatile recently, we preferred to use the US benchmark to avoid being influenced by factors external to the analysis, such as Greece), and the EUR/USD exchange rate to take into account the impact on exporters (we chose this instead of the Dollar Index since we want to isolate the “competitive” relationship between the two major stock market aggregates).
Current Trends
The WTI (West Texas Intermediate) has suffered a 40% decline since May 2014, touching a low of $43. Since mid-March, it has partially recovered, ending up at around $60 as of Friday May 8th. The main drivers of the decline were both a slowing demand from emerging markets, especially China, and, particularly, an excess supply caused by the increased production of US shale oil companies. Furthermore, the November meeting of the OPEC did not decide for a production cut, depressing even more prices, thus accelerating the downturn.
The EUR has heavily depreciated against the USD since May 2014, touching a low of 1.05 USD per EUR, from being as strong as 1.40 USD per EUR. We identify two main drivers. On the European side, first the expectations of further rate cuts and monetary easing by the ECB and later the implementation of a massive, much bigger than initially expected, QE program. On the American side, both a stronger economy and expectations of rate hikes by the FED. Such a situation of monetary policy divergence has led to the steep appreciation of the USD. However, there has been a shift in the trend in the last month, with the EUR regaining strength against the stars-and-stripes currency, ending up at around 1.13 USD per EUR.
The S&P 500 is at 2,116 as of Friday May 8th. After a recent decrease due to worse-than-expected Q1 corporate earnings, it undertook a rebound this week due to an improvement in job data, up to 223,000 new jobs in April, and a consequent fall in unemployment rate to 5.4%. This has decreased yields on Treasury notes and bonds, with the 10-year down to 2.13%, because investors did not see in the data any proof for an early rate rise by the FED in June. Therefore, the stronger employment environment combined with lower rates for longer helped the S&P 500 in its weekly gain of around 0.4%.
WTI – S&P 500
We now want to analyse the historical correlation between the WTI and the S&P 500. As we can see from the following chart, there has been quite a strong positive correlation between the two benchmarks until June 2014. We computed three different rolling correlations (at 50, 100 and 200 days), using daily log returns for both the WTI and the S&P 500. Before the huge oil price slump began last year, an increase in the WTI was usually accompanied by a surge in the S&P 500. Many reasons can be found for this relationship. First, a higher oil price globally rises the headline inflation rate and stocks historically tended to perform better in periods of moderate inflation, whereas they underperform in periods of both deflation and high inflation. Second, demand for oil is higher in periods of economic expansion, thus driving prices up. At the same time, a stronger economy means higher consumption, investment and corporate earnings, thus increasing equities valuations. Third, periods of high volatility, like the one happened in 2011 Q3 due to US uncertainty about QE3 and weak economic data, or the one in 2013 Q4 due to the shutdown of US government offices, cause big fluctuations in the S&P 500 and in the WTI. Therefore, we can see that the 200dd correlation stayed above 0.3 from 2010 until May 2014, with a sustained peak of between 0.5 and 0.6 for two years.
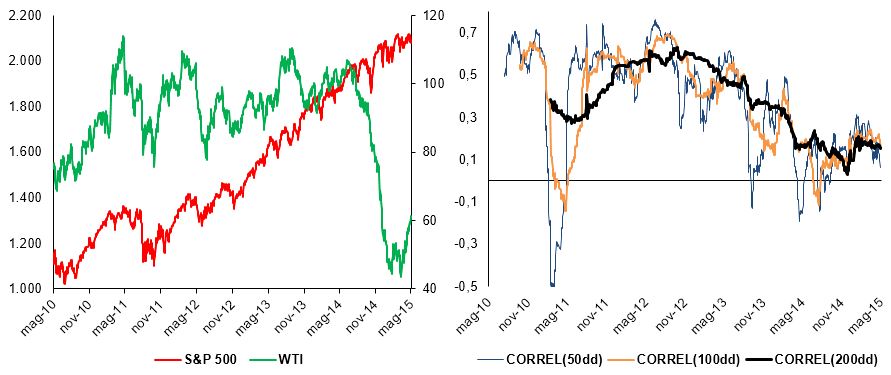
Chart group 1: S&P 500 and WTI, price and rolling correlations (source: BSIC, Bloomberg)
This “magic” relationship came to an abrupt end in June 2014, when the huge decrease in WTI price began, accompanied by a rally in the S&P 500. The 200dd correlation fell to a range of between 0.2 and 0.0. We can find an explanation looking at the supply side of the economy. On the one hand, the US are on set for a stronger economy, with improvements in the labour market, positive GDP signals and still low interest rates which help equities. On the other hand, the oil market has been and is affected by overcapacity. The US shale oil producers flooded the market with low-cost crude, driving down prices. At the same time, the OPEC did not act to counter the oversupply, in practice allowing the huge slump in oil prices.
The question is whether this divergence is getting wider or narrower. The recent rebound in the WTI suggests that the second option might be the right one.
WTI – EURUSD
The second character of our tale is the relationship between the WTI and the EURUSD exchange rate. Looking at the charts, created as explained above, we can spot a temporal trend similar to the WTI – S&P 500. In fact, until 2013 Q4, the 200dd correlation between the WTI and the EURUSD has been quite significant and positive, fluctuating in a range between 0.2 and 0.5 from 2010. That meant that the USD depreciated with respect to the EUR when the WTI increased, and, conversely, the WTI decreased when the USD appreciated. This finding reinforces the common belief in commodity trading that oil prices and the USD are quite strongly inversely correlated, mostly due to the fact that crude prices are quoted in USD and that the US are net oil importers. According to such a view, on the one hand, an appreciation of the American currency causes the same amount of currency to buy more oil, thus making oil cheaper. On the other hand, an oil price increase strongly affects the US balance of payments, putting the USD under pressure. However, recent studies have cast doubts over one of the most common beliefs in commodity trading. A 2014 ECB paper (“Oil price, exchange rates and asset prices” – M. Fratzscher, D. Schneider, I. Van Robays (07-2014)) pointed out that the relationship is not as simple as it appears. Firstly, a strong negative correlation between spot crude oil prices and the dollar exchange rate first showed up around 2000, “while there was no such systematic correlation over the previous three decades”; moreover, the correlation emerged along with an increase in oil price volatility.
After 2013 Q4, the 200dd correlation dropped below 0.2 and fluctuated until 2014 Q4 between 0 and 0.2, meaning that a rise in the WTI had little effect on the EURUSD exchange rate. We could find two main reasons for this weakening of the relationship. First, the American shale revolution has changed the market conditions to such a point that an inverse relation no longer exists. As US oil imports fell from 12M barrels a day in 2008 to 5M in 2014, the USD-spot crude correlation fell from 0.4/0.5 to almost 0. Second, the EURUSD exchange rate was deeply affected by monetary policy divergence between the FED and the ECB. The latter anticipated further monetary stimulus since 2014, while the former evaluated a possible rise in benchmark interest rates. This caused the EUR to depreciate from 1.4 USD to less than 1.1 USD in less than a year.
However, since the beginning of 2015, we spot an increase in the 200dd correlation, up from almost 0 to around 0.3 in less than 5 months. This could be explained by a slight rebound in the EUR and in the WTI. Revised-upward inflation expectations in the Euro area may then imply a revision of the ECB QE. On the other side, Ms. Yellen delaying the rate rise decreases the upward pressure on the USD. Therefore, the monetary divergence has weakened in the last months, and oil has come back a little.

Chart group 2: WTI and EURUSD,, price and rolling correlations (source: BSIC, Bloomberg)
We think that, with a higher WTI and a more stable monetary environment, the correlation may come back to the levels seen from 2010 to the end of 2013. However, given the low-base economic data for the US in 2015 Q1, Q2 growth could rise above expectations, thus leading the FOMC to decide for the long-awaited rate rise. In this case, we would see a further appreciation of the USD with respect to the EUR and the correlation between the WTI and the EURUSD could decrease again.
EURUSD – S&P 500
Our last friend is the link between the EUR/USD and the S&P 500. Looking at our usual charts, we discover the same trend. Between 2010 and 2013 Q4, the 200dd correlation was steadily positive and above 0.2, with peaks of around 0.7. This meant that a weaker USD with respect to the EUR was accompanied by a surge in the S&P 500. First, as we previously noted, a weaker USD relative to the EUR was accompanied by a surge in WTI, which, in turn, went hand-in-hand with a rise in the S&P 500. Second, weaker USD means higher international competitiveness for multinationals, which make up a big part of the S&P 500. In fact, foreign sales account for around 30-40% of overall S&P corps sales. Third, a weaker USD relative to the EUR does not necessarily imply that the USD is depreciating. In fact, the EUR appreciated in those periods. Therefore, the unchanged level of the USD sustained consumption, with many US consumers buying foreign products and increasing their real purchasing power.
The 200dd correlation has abruptly dropped since 2014 Q1. It fluctuated between a high of around 0.15 and a low of -0.2! This change in the relationship started when the EUR began its long depreciation against the USD. On the one hand, ECB expansionary policies drove down benchmark interest rates and the EUR value. On the other hand, the intention of the FED to raise interest rates and the recovering US economy put upward pressure on the USD. The S&P 500 continued its increase, supported by stronger economic data, despite the surge in the USD. Therefore, the correlation became negative: a stronger USD and a depreciating EUR were matched by a rising S&P 500. Probably, this was mainly due to the strong slide of the EUR and to monetary policies (actually, this makes sense in a globalised world, where investors choose among global opportunities and benefits).

Chart group 3: S&P 500 and EURUSD, price and rolling correlations (source: BSIC, Bloomberg)
The 200dd correlation came back into positive territory only in the last few months. We think that this might be because it is not certain for the S&P 500 to rise together with the USD in the near future. A first reason could be that sudden exchange-rate movements can be adverse in the short run. Second, the rising USD may not reflect the strong economy, but only the divergence in monetary policies. Therefore, we could see a falling S&P 500 with a gaining greenback.
Trade Idea
Eventually, we tried to analyse the correlation time series from a simple econometric perspective.
The first step of our analysis consisted in testing whether the time series were stationary or not. As a matter of fact, a stationary time series has an unconditional “long run” mean to which the series will tend and this “mean-reverting” feature could provide us with some prevision power. Therefore, we made a 99% confidence level Augmented Dickey-Fuller test – which has a null hypothesis of non-stationarity – on our time series.
Results were quite not satisfactory, as we found out that only the WTI-S&P 500 50dd correlation series is stationary – its ADF statistic is -3.4429, which is more negative than the critical value -3.43, thus we rejected the null hypothesis. Thus, we focused on the WTI-S&P500 50dd correlation and estimated its “long run” mean by taking the sample mean, which is 0,365.
Given the time series “mean-reversion” and given the fact that the 50dd correlation stands at 0.0636 as of May 6th, well below the “long run” mean, we believe that correlation between the S&P500 and the WTI oil price will rise in future months.
In order to profit from a view of rising correlation, we could buy a basket option on the two assets. A basket option is a type of financial derivative, classified among the so-called “exotic options”, where the underlying asset is a group of commodities, securities or currencies. Like other options, a basket option gives the holder the right, but not the obligation, to buy or sell an underlying asset at a specific price, on or before a certain date. The payoff of the basket option depends on a linear combination – usually a weighted average – of the underlying asset prices. Therefore, a higher correlation entails a higher probability of the option being in the money (indeed, higher correlation implies higher volatility).
[edmc id= 2781]Download as PDF[/edmc]


0 Comments