Introduction
In January 2018, M&A activity surpassed investors’ expectations. According to a report by law firm Baker McKenzie, global mergers and acquisitions are expected to hit an 18-year record, reaching $3.2 trillion in 2018. To the same extent, cross-border M&A is expected to reach new time highs. In the December 2017, President Trump signed the Tax Cuts and Jobs Act, a major overhaul of US fiscal rules which is expected to impact dealmakers’ strategies to expand. Along with taxes, the interest rate environment shapes the dynamics of how dealmakers plan and finance their acquisitions: today’s credit markets indeed allow firms to acquire target companies by employing significant amounts of debt financing.
Biotech & Pharma and TMT represent the two industries most affected by these trends and therefore will be assessed in detail.
In the US, the largest market for pharmaceuticals in the world, drug approvals hit a 21-year high the past year, with a growing share of new products being developed from younger biotech companies. President Trump’s recent proposition on capping pill prices, as well as massive patent expiries, are shifting firm’s R&D towards niche diseases, where few recently-established firms often excel. This trend reflected inevitably on the stock market, sending the iShares Nasdaq Biotechnology ETF up more than 7% in 3 months. Consultancy EY and law firm Baker McKenzie, in different reports this month, both foresee a steady rise in life sciences M&A in 2018, confirming the general market sentiment.
As far as the TMT industry is concerned, global players such as Apple, Netflix and Amazon keep pushing the limits of gigantism, followed by the potential mergers between Walt Disney and 21st Century Fox, and AT&T with Time Warner. “It’s clear that the message that Disney and Fox are sending is that scale matters,” Lowell McAdam, Verizon’s CEO said in an interview. Consumer preferences also play a huge role in this environment: for example, the substitution trend affecting television in favour of video streaming is killing competitiveness of TV network owners such as CBS and Viacom and, at the same time, it is generating additional audience for Netflix and Amazon. Furthermore, pay TV providers see their advertising revenues squeezed out and have been victims of rising costs of premium video content, due to the adverse effects caused by Netflix and Amazon massive investments in innovative proprietary content. On the other side of the spectrum, an even tougher environment challenges cable and wireless carriers. Since the beginning of Trump’s mandate, many cable companies have been buoyed, hoping for a widespread deregulation of the industry; moreover, most traditional wireless companies have seen their revenues decrease over the past year, while striving to broaden their product offering (e.g. the introduction of 5G technology). Meanwhile, tech behemoths like Google and Apple, with huge financial resources and technological expertise, are set to tackle the abovementioned sub-sectors and to seriously threaten traditional players.
Pharma M&A Overview
The pharmaceutical industry’s contributions to global health and economic development make it one of the most important commercial sectors in the world. In particular, the biopharma and biotech sectors have experienced a steady growth during the last decade, driven by the rise in global healthcare expenditures (which now account for 10.5% of the total GDP), the increasingly aging population and the prevalence of chronic and communicable diseases. Additionally, M&A activity has played a fundamental role in such an industry: indeed, acquisitions in these sectors are highly linked to the business strategy of pharma companies. For the former, M&A activity is crucial, as it ensures incumbents to grow or leverage on the acquired target’s R&D knowledge by diversifying or replenishing their pipeline of products in order to remain competitive on the market. Moreover, acquisitions constitute efforts by leading pharmaceutical companies to compensate for the lack of new discoveries.
Despite the steady growth that the industry has experienced overtime, the M&A deal volume and value in the biotech and pharma subsectors has been at its lowest levels over the last two years. As shown in the graph below, overall deal volume has declined since the beginning of 2016, with megadeals such as the acquisitions of Actelion Pharmaceuticals (Q1 2017) and C.R. Bard (Q2 2017) accounting for most of the spikes in value throughout 2017. The decrease in M&A activity occurred across all sub-sectors, hitting in particular (bio)pharma – which experienced a 56% decline in value from 2016 to 2017.
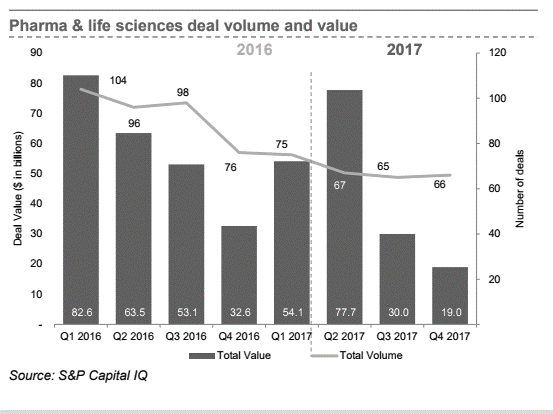
Source: S&P Capital IQ
While the factors leading to M&A activity in the sector have not changed, different incumbents’ dynamics (increasing number of buyers and fewer number of acquisition targets) lead to a reduction of M&A deal volume and value of 20% with respect to 2016. The major reason behind this trend was characterized by augmented geo-political tensions (e.g. the US Tax Reform, EU elections etc), unstable customer engagement and unpredictable regulatory compliance. In this respect, the latter two factors are the most relevant, as the pharma sector is characterized by extremely high production and development costs and firms’ marketing strategies of newly created products are the main source of revenue generation, potentially hindered by an unfavourable regulatory environment.
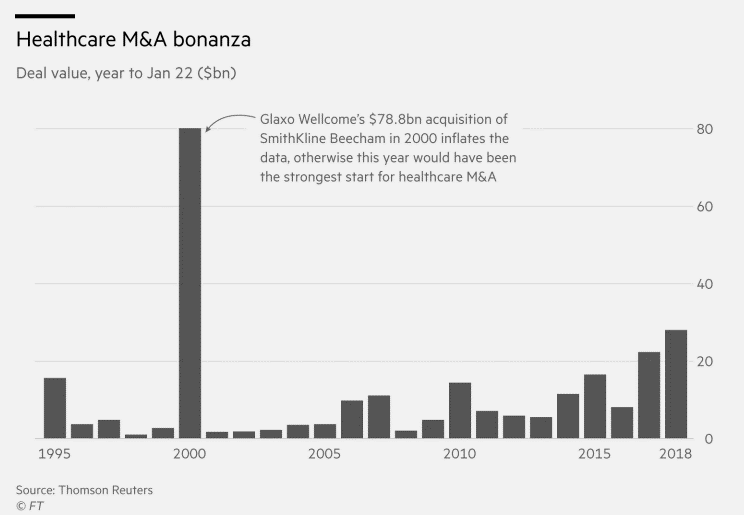
Source: Financial Times, Thomson Reuters
In light of these factors, M&A value in the healthcare sector recorded its strongest start to a year in more than a decade (excluding 2000), with almost $32bn of global deals announced since the start of January. Of these $32bn, the colossal drug makers Sanofi SA and Celgene Corporation performed almost a combined $26bn value of acquisitions. The two most relevant ones include Sanofi SA announcing, on January 22nd, the acquisition of the American Bioverativ Inc. for $105 per share in cash, representing an equity value of approximately $11.6 billion (on a fully diluted basis) and Celgene Corporation revealing on the same date the agreement to acquire the 90.3% stake it did not already own in the cell therapy provider Juno Therapeutics for $9bn in an all-cash offer priced at $87 per share.
Drivers of M&A Activity: 2017 vs 2018
In order to better understand the reasons for this sudden change in M&A activity, it is important to compare last year’s major drivers with 2018’s expected ones.
As far as 2017 is concerned, M&A activity was essentially characterized by more traditional drivers, such as: the need for inorganic growth to fill revenue shortfalls, mainly related to mature assets; the pursuit of economies of scale in the case of increasingly consolidated customers with higher bargaining power (main driver of the recent deal between the US drugstore chain CVS and the US healthcare insurer Aetna); the seek for protection against «unfamiliar» competitors (e.g. risk of disruption deriving from tech companies) and the access to complementary product lines or new geographic territories in core markets.
On the other hand, deals announced during the first months of 2018 seem to have been spurred by slightly different drivers. The trend is indeed shifting to a crowded pool of increasingly smaller and high-growth competitors which are willing to sell themselves to large pharma players rather than raising cash from private investors or public markets. These companies excel in the discovery and development of new drugs, but they struggle when it comes to building sales force to commercialize their products. As a matter of fact, most biotech companies are worth significantly more within a large and established player, because the latter have the sales and distribution capabilities that would be expensive to develop internally from scratch. Moreover, other drivers are likely to be identified in a more favourable economic environment given Trump’s decision to lower corporate tax rate to 21% and in the ability to more easily access offshore earnings. In fact, the mandatory repatriation at a reduced rate of 15.5% on cash earnings and 8% on non-cash earnings will likely result in companies bringing back billions of dollars, which are expected to be used, at least in part, for external growth strategies.
Acquisition Premia in the Pharma sector
A final relevant note should be made concerning the bid premium that has characterized the deals announced during the first months of 2018.
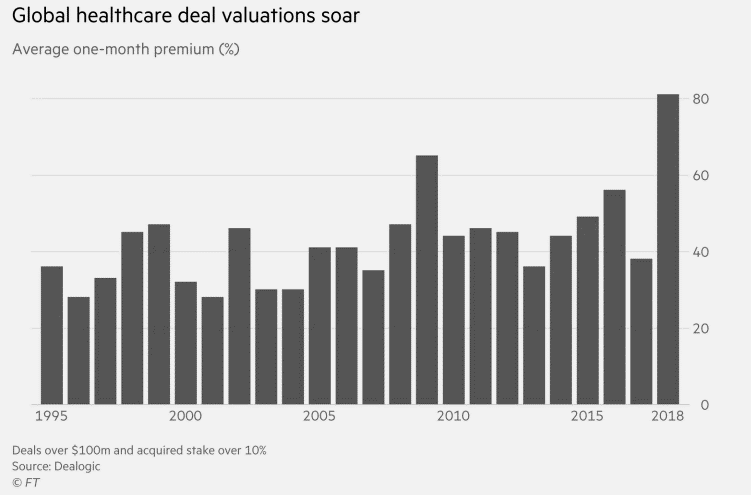
Source: Financial Times, Dealogic
According to Dealogic, buyers of healthcare companies have agreed to pay an average premium of 81%, number that is well above the 42% paid on average in 2017. Examples are the 63.78% bid premium paid by Sanofi SA on Bioverativ Inc. and the 78.46% premium paid by Celgene Corporation to acquire Juno Therapeutics.
Three major causes appear to justify such high levels of acquisition premium: i) strong pricing competition arising from the presence of fewer worthy targets, which means buyers are willing to pay higher premium levels; ii) the strategic and immediate need to grow inorganically (and thus higher willingness to pay higher prices) due to big pharma players’ “patent cliff” (i.e. the phenomenon of abrupt drops in sales following a patent protection expiry); iii) the tendency of distressed buyers to overpay when they desperately need to replenish their drug pipelines. These causes are evident from the rationale driving the abovementioned transactions: Celgene Corporation’s decision to acquire the cancer expert Juno Therapeutics was indeed also due to the imminent loss of patent protection on its top cancer medicine Revlimid, while Sanofi’s announced acquisitions aim at widening the French company’s product portfolio in order to offset the 2017 decline in sales coming from its top-selling insulin-based drug, Lantus, which lost market share following the introduction of cheaper biosimilar versions.
Technology M&A Overview
The market for corporate control in the Technology sub-industry remained active throughout 2017 despite increased geopolitical risk and greater market uncertainty. The implementation of unconventional monetary policy such as the QE inflated stock prices and made corporate valuations more “irrational” (i.e. less explainable based on fundamentals such as risk, growth, and cash flows), thereby theoretically hindering M&A activity (at least on public targets). Nevertheless, M&A activity remained strong throughout 2017 thanks to strong investments in Software.
While deal volume increased (+16% in 2017 vs 2016), deal value decreased (-46%),as investors were concerned about inflated valuations and preferred to take a more patient stance by shifting their attention to early stage, private companies, whose valuations are less affected by unconventional monetary policy as they are not directly affected by public markets’ short-term trends (i.e. the acquisition price offered to these companies is mainly based on fundamentals). The reduction in deal value can be explained by the lower number of megadeals completed in 2017 vs 2016: in 2017, 6 megadeals totalling $70.2bn were announced, in contrast to 11 megadeals worth $140.2bn in 2016. The largest transaction of the year was the $17.9bn acquisition of Toshiba semiconductor by Bain Capital (excluding the potential ~$130bn transaction involving Broadcom and Qualcomm, as it has not been agreed between the parties yet).
Despite the significant economic and political changes which affected 2017, the tech sector has a huge potential for growth and expansion fuelled by the growing interest in cyber security, artificial intelligence (AI), and digitization – all of which are attracting the attention from potential buyers across all industries, tech and non-tech.
When analysing corporate transactions, the percentage of non-tech companies acquiring tech companies increased over the last two years and now accounts for more than 25% of total deals. We would expect this trend to continue as all industries strive to become more digitized as time passes. On the other hand, the opposite trend also holds true, as the number of tech companies buying non-tech companies is also increasing: Amazon’s acquisition of Whole Foods Market represents a clear part of this trend.
The positive market sentiment throughout 2017 helped revitalizing the IPO market too. Moreover, venture capital funding approached record highs: US VC-backed tech companies raised $71.9bn, reflecting a +17% change with respect to 2016. The role of VC funding is that of fostering the growth of young companies, which in turn will contribute to the further improvement of the M&A and IPO markets.
As previously stated, 2017 experienced a valuation mismatch between buyers and sellers which prompted investments in smaller, early stage companies. In light of the recent market correction coupled with lower overall cash spent on M&A transactions (because of lower deal values), we believe that the sector will experience a downward valuation adjustment. Furthermore, the new US tax regulation will impact company valuations from an accounting standpoint too: the reduction in the corporate tax rate indeed affects future earning, deferred tax assets and liabilities, tax shields and the repatriation on offshore earnings and profits. Although the overall effect is normally uncertain in terms of value, it is worth mentioning the case of small / early stage tech firms: a decrease in corporate tax may have a negative effect on the valuation of these types of companies. In fact, high-growth companies are characterized by low or even negative earnings, high capex and tend to have large NOLs (Net Operating Losses, the accumulated amount of past losses); as a consequence, such companies exhibit high DTA amounts (Deferred Tax Asset, assumed equal to the NOL multiplied by the statutory tax rate). Therefore, a lower tax rate implies lower financial synergies realizable for the buyer, because a higher DTA amount lets the buyer offset more taxable income in the future and thus a lower premium / valuation is offered (The positive effect of augmented cash flows would on the other hand be felt in the medium or long term only, thus exercising a lower impact on the valuation because of discounting). Additionally, the effect on tax shields can be neglected due to the fact that most early stage companies are primarily equity financed.
Evolution of M&A dynamics
In line with the general decreasing value trend, deal values in each of the different tech subsectors decreased too. Consistently with 2016, Software continues to be the most active sub-sector in terms of M&A transactions. We expect this pattern to continue due to companies’ increased interest in digitization, AI, IoT, and cyber risk. Notable exception to the decrease in deal value is the Internet sub-sector, where values remained similar to 2016 levels.
In terms of deal count, the number of Software deals increased by 46% with respect to 2016. In contrast, Software deal value decreased by 27%.
Compared to 2016, Semiconductor deal value declined by 62%. However, it is worth mentioning that the 2016 deal value spike of $78.3bn was largely caused by two major deals, accounting for 68.5% of the total.
US domestic deals as a percentage of total investments declined from 73% in 2016 to 56% in 2017. This reduction may signal a geographical broadening of the tech market: while Silicon Valley remains the sector’s primary location, other countries are gaining importance as source of developing technologies. With respect to cross border deals, the UK and Canada are the two countries which received most of US investments.
The technology market for corporate control is also being shaped by the dynamics in buyers’ characteristics. A buyer in an M&A transaction may be either a strategic or financial buyer.
A strategic buyer may belong to the same industry of the target company or not. In this respect, the participation of strategic buyers outside the technology industry has increased from 17% in 2016 to 25% in 2017. This means that more and more corporates outside the tech sector are acquiring tech companies to embrace digitization. However, the deal value of acquisitions carried out by non-tech companies decreased by 24% in 2017 vs 2016. Patterns for tech buyers are similar to those of non-tech buyers.
As far as financial buyers are concerned, private equity firms are increasingly attracted by tech companies, as more of such firms are transitioning from traditional service delivery models to XaaS (Software/Infrastructure/Platform-as-a-Service), which generates recurring cash flows that permit the sponsor to comfortably pay down the debt used to finance the deal. Because of the sustainability of this transition, we expect continued strong participation of financial sponsors in the technology industry.
Valuation Standpoint
Trading Comps/Standalone multiples
Software and Internet EV/Sales and EV/EBITDA are both at their 5-year high (data as of 31/12/2017). Semiconductors, IT Services, and Hardware were all relatively flat for 2017 in terms of EV/Sales multiple. Overall, the Software sub-industry group is the most expensive one, most probably due to the excess demand for companies in the sector with respect to the others. Therefore, besides the sectors’ fundamental characteristics, there might be a positive spillover effect coming from the M&A market, whereby investors incorporate the probability of a takeover in the stocks’ standalone valuation. Over the last year, Internet companies experienced a substantial increase in their EV/EBITDA multiple (from 16.8x in Q4 2016 to 21.8x in Q4 2017), driven by the sub-sector’s high growth and margin expansion. Conversely, firms in the Semiconductor companies were victims of decreasing valuations because of the cooling-off of the consolidation mania started in 2016.
Transaction comps/Precedent transactions
Normally, we would expect non-financial buyers to offer a higher acquisition premium than financial buyers, due to the ability of the former to extract synergies from the acquisition. It is worth noticing, however, that antitrust regulations and the current state of credit markets may offset this convention: in fact, due to cheap debt financing, PE firms have been able to offer higher-than-average premiums (remaining consistent with their target IRR), thus reducing the premium gap with respect to strategic acquirers. Furthermore, as market valuations have increased and are less dependent on fundamentals, transaction multiples have become more closely aligned. Finally, the comparison between tech and non-tech buyers is of particular interest: tech buyers tend to offer an acquisition premium that is – on average – 30% higher than what is offered by non-tech buyers, due to a greater synergy generation potential.


0 Comments