What are 0DTEs?
Zero Days to Expiry (0DTE) options are options that expire on the same day they are purchased; this gives them an unusually high amount of leverage that is hard to find anywhere else. Due to theta, the extrinsic value of an option declines exponentially as it moves to the expiration date. Theta represents the risk of time; it is negative for buyers and positive for writers of options and is the highest when an option is at-the-money. Due to theta decay, 0DTEs demand a relatively small premium, as little time is left for them to expire in the money. That is why they offer extreme amounts of leverage that cannot be found in other financial instruments, for example, some out-of-the-money 0DTEs offer higher than 1000 leverage. This allows you to have an immense exposure to the underlying in a long position but have downside risk limited to the comparatively small premium paid.
Volatility is positively correlated with the option’s price, since a larger move in the underlying increases the chances that the option ends up in-the-money. We can infer the implied volatility (IV) from the price of the option using Black Scholes Model. A high implied volatility means that market participants are expecting large, realised volatility in the underlying, for example, IV tends to be much higher before earnings calls, and then fades away due to the absence of a catalyst causing uncertainty in the probability density function of the underlying. If the realised and implied volatilities were equal over the lifespan of the option, then it was fairly priced. The pay-out of the option is the difference between the two. If realised volatility was higher, the option was undervalued, and if IV was higher, then it was overvalued. Zero Days to Expiry options are a way for traders to bet on very short-term volatility. In fact, trading volumes suggest that 0DTEs have become the preferred way for traders to express their view on macroeconomic events. The volume of 0DTEs before the publication of the CPI figures in October 2022 was 2.3m. The daily average for the previous 3 quarters was only around 1m.
Additionally, selling 0DTE options can be an opportunity for market makers looking to take advantage of the option’s high theta decay. It also carries a large amount of risk as when the market rises one week but retracts back to its original value by the end of the month, the one-week overwriting strategy will have suffered a loss, while the one-month strategy will not have had a call expire in-the-money. As market returns are usually driven by only a few days in the year, a daily volatility exposure with 0DTEs poses extreme risks. However, overwriting far-dated options eliminates the equity risk premium that the investor is trying to earn. An example could be a market maker selling a 0DTE for a small premium and, because of the huge time decay of the option, it quickly expires worthless.
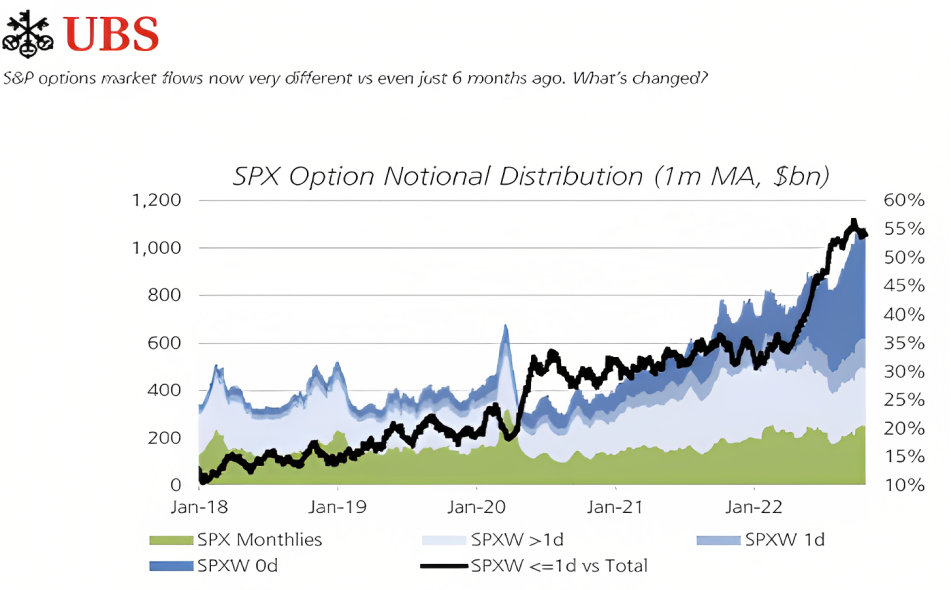
In a post-peak Meme Stock Mania world, 0DTEs are not being used solely for retail gambling, but are mainly traded by institutional traders. While some retailers participated in the recent surge in trading volume, they only accounted for a small portion of trading on S&P 500 0DTEs. As every option becomes a 0DTE on its last day, 0DTEs in fact have been available since options started trading. Options with one week to expiry were first listed in 2005 on the CBOE and are the main instrument through which 0DTEs are traded. At first, only three days of the week were available as expiries, but the CBOE filled in the rest of the week, with Tuesday and Thursday being added last year, as demand for the contracts grew. It is worth noting that 50% of SPY options traded expire in less than a day.
0DTEs Behaviour
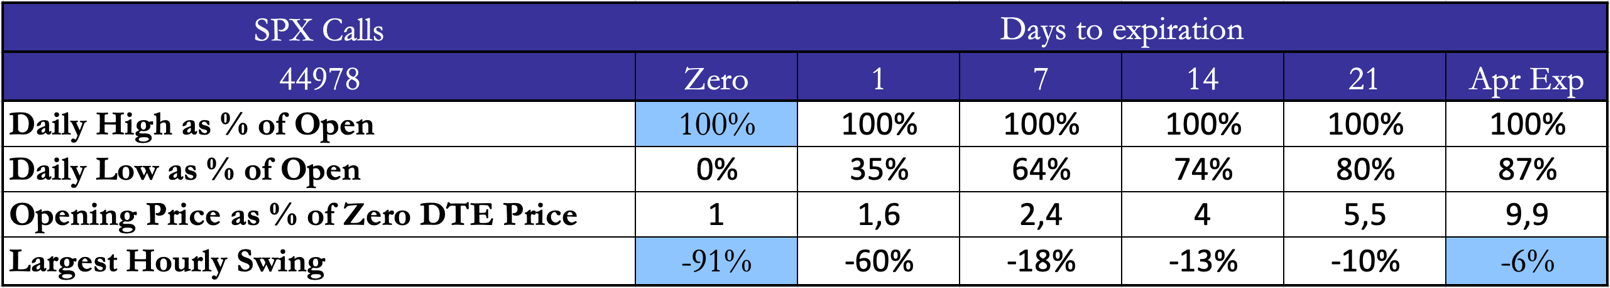
Since 0DTEs are used to exploit intraday volatility, we can explore their behaviour during market moves, such as the 1% decline in the SPX on the 21st of February.
Source: Bocconi Students Investment Club
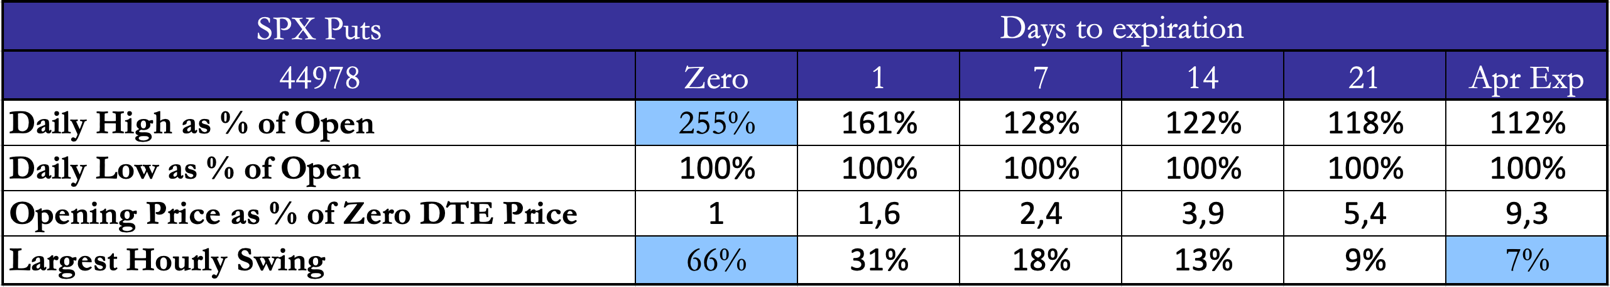
On the 21st each of the options opened at its highest point. Then as the day progressed and the market declined by 1%, the 0DTE calls got wiped out, but the longer expiries retained much of their value, with the April expiry losing only 13%. Another interesting thing to look at is the largest hourly swing, which for the 0DTEs was a whopping -91% and for the April expiry, it is -6%. The put gains make it worthwhile to buy 0DTEs, however, it depends on how you look at it.
Source: Bocconi Students Investment Club
We can see that the puts gained 255% or they made around 1.5x of what was paid for the option, however, it is important to remember that this would be assuming that you sell the put right at its highest price. More realistically, looking at the largest hourly swing of 66%, the people who got the direction right won significantly less than what they would have lost if they did not get it right. That is not to say that the returns are small, but they are not enough given that to achieve them you need an approximately 1 standard deviation move. In order to make it work you need to have a very strong conviction on the direction. Just to contrast it with the April puts, they gained 7% in the right direction. Meaning that even though they require more capital, they made more money in the largest hour swing than was lost.
Choosing the Right Strike
Choosing the right strike involves choosing the right delta. An at-the-money (ATM) call option has a delta of +0.5, which means that as the price of the underlying moves by $1, the price of the option will move by $0.5. The delta gets closer to 0 as the option moves further out-of-the-money (OTM) and closer to 1 as the option moves in-the-money (ITM).
 Source: Bocconi Students Investment Club
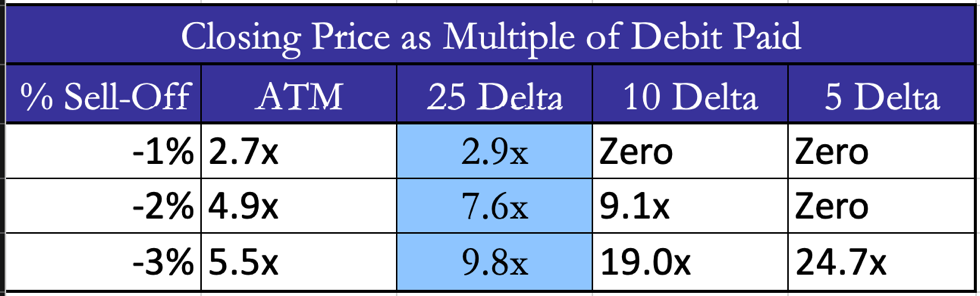
The table shows the closing price as a multiple of the debit paid for different SPY 0DTE puts. We can see that the 5 Delta is not optimal, even though it has an insane return of 24.7x for a -3% move, will not expire ITM for the other scenarios. And even though 1% and 2% are also rare, the put expires worthless in both cases. The 10 Delta put also does not seem very practical, since it expires worthless for a -1% move. The 25 Delta put seems more reasonable since if there is a -1% sell-off in the market it can be nearly 3x the initial debit paid.
Why might options drive volatility?
Options can be divided into two categories regarding what their effect on the volatility of the underlying would be: covered or uncovered. Covered options can be defined in such a way that the option writer, selling them, currently has a position in the underlying that is equal to the amount in the option. This is the case of a covered call would mean that for a call for 100 shares of a company, the writer would own at least 100 shares in the underlying beforehand. Uncovered or naked options are options issued by an option seller who currently does not possess the amount to back the option. Delta hedging is the practice of creating a neutral delta exposure for your portfolio, as options have a changing delta however, the exposure to the underlying must be changed. As the price of the underlying moves, the deltas of options change, meaning everyone trader who is short gamma will be forced to change their positioning in the underlying accordingly. This means that a market maker who for example is short a put would need to short an amount in the underlying so that their delta exposure would remain at zero.
This in turn then results in greater volatility in the underlying if the difference between all puts and calls issued is significant enough. Single stock implied volatility tends to trade more consistently according to realised volatility than index implied volatility. This is mainly due to higher option demand from hedgers and sellers of structured products and causes greater liquidity in index options markets compared to single-stock ones. The fact that 0DTEs are now mainly traded volume-wise for indices, therefore, is not surprising. It must however also be noted that 0DTEs will have to be traded every day simply due to their nature of being on the date of expiry vs long term index options are far more illiquid and traded far less frequently in large volumes by funds such as JPMorgan Hedged Equity Fund that aim to reduce their downside risks. 0DTEs have been seen to possess 8 times the gamma exposure of monthly options, which will manifest itself in large moves such as two standard deviations or higher. The increased volume of 0DTEs has caused concerns over the recent months about amplifying high intraday volatility to extreme amounts and potentially causing what some have dubbed Volmageddon 2.0.
Volmageddon 2.0: a possibility?
JPMorgan’s Marko Kolanovic created widespread concerns over Volmagedon 2.0 with his report detailing how 0DTEs would cause immense volatility in extreme scenarios. The perhaps most quoted thing out of the whole report was that 0DTEs would be able to amplify intraday volatility to such an extent that a 5 % drop would turn into a roughly 25% nosedive of the S&P 500. For comparison, the three largest recorded drops happening within a day in the history of the S&P 500, were the 16th March 2020 with −11.98%, the Black Monday on October 28th 1929 with −12.34%, and the Black Monday of 1987 on October 19, 1987, with −20.47%. It must also be noted that if this crash were to happen on a Monday naming it Volmagedon 2.0 would be preferable over Black Monday for originality – although being called 2.0 is not very original admittedly. The original Volmageddon happened on February 5, 2018, when the VIX jumped by 20 points.
However, the 5% drop in the S&P500 in that scenario would have to occur within the span of five minutes, which is short even in the context of options that expire on the same date. This would then initiate $30.5bn in trading related to 0DTEs, adding 20% points to get to a 25% drop, in contrast, a 1%/5% fall within the same timeframe would result in an additional 4%/8% point decline. JPMorgan also pointed out that retail traders that have been active in short dated options trading during the Gamestop fiasco only amount to around 5% of the 0DTE Volume, which is mainly dominated by institutional traders.
The caveat to this scenario is that due to circuit breakers in the S&P500, it is highly unlikely to happen as the circuit breakers would allow market participants to readjust accordingly afterwards, and provide time to reassess the market. The three levels of circuit breakers are at a 7% decline, a 13% decline, and a 20% decline, the first entails a trading halt for the cash equity market and all US-based equity index futures and options for ten minutes and an increased price limit to 13%. The Level 2 circuit breaker would get triggered at the 13% decline before 2.25pm and would result in a similar trading halt as the first one. The third one, at 20% would terminate trading for the remainder of the day in all the same instruments as the Level 1 and Level 2. Therefore, it is highly unlikely that a 25% drop could incur if the Level 3 circuit breaker were to be actrivated. Additionally, as the 0DTEs that are said to cause that volatility would be expired by the time the market resumes trading, they would no longer be able to further amplify volatility. Writers of 0DTE options would in this case be very unlikely to sell new ones once the S&P500 resumes trading again. A lot of 0DTE trading is estimated to be between two dynamic-hedgers that might have underlying replacements, a scenario thought to drive a heavy imbalance would be due to a large actor purchasing a massive and well timed amount of 0DTE calls or puts causing sudden hedging in the underlying. Perhaps this has happened more than once already with an event on October 13th, 2022, where someone went long around $25mm of 0DTE calls that contributed significantly to a 5% market rally.
On the other hand, it can be argued that short-dated options demand has caused other “Volmageddons” at least in single stocks so far as well, i.e. the Gamestop saga and other Meme stocks during the peak options mania in 2021. The difference is that those have mostly been upside moves and in single stocks which cause far less fear invoking headlines. In fairness to 0DTEs and the argument against a sudden drop, it is far harder to move the whole S&P500 compared to single meme stocks.
Is the VIX broken?
Recently there have been concerns regarding the unusually low levels of the CBOE Volatility Index (VIX). The unusually anchored behavior of the index amidst declining markets has raised concerns and speculations that the VIX might either be signaling an impending period of market turbulence or it’s just not functioning properly and is no longer an accurate indicator of market sentiment.
Volatility wise the past year was remarkable in some major instances. As the S&P 500 tanked more than 20%, the VIX remained relatively stable- trading in the range of 20-33 due to a more gradual selloff. Despite worries that the index is “broken” or “manipulated”, it behaved as it was supposed to. To understand why that is the case it is necessary to ascertain this index is calculated. The VIX measures 30-day forward volatility of the S&P 500. This means that it can be viewed as an implied strike of a one-month variance swap in volatility points. Realized volatility has not been very high, peaking at 36, and remaining under 30 for the larger part of the past year. Since the index is meant to reflect one-month forward volatility, if there is no evident contemporary market stress or at least 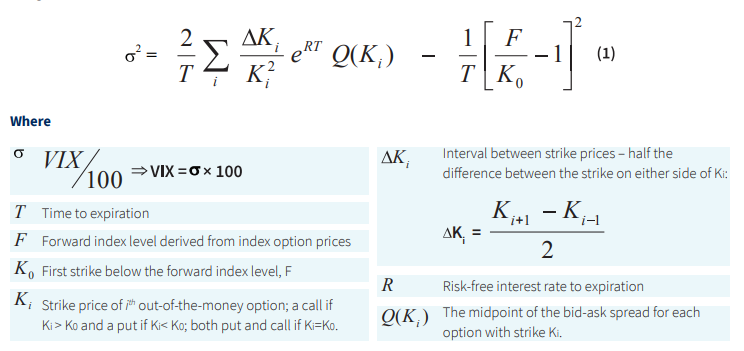 anticipation thereof, it’s only logical that it remains mostly stable.
Source: CBOE
The VIX calculation is derived from the midpoint of bid-ask quotes from a range of S&P 500 options. It only uses prices of 23-day to 37-day options, computing on a 30-day average weighting. Both at-the-money and out-of-the-money puts and calls are used, and weekly and monthly expirations are included. It should be noted that before 2014 the VIX used only used monthly options, but the increasing popularity of weekly options lead to their inclusion in the calculation method.
Source: UBS
Nevertheless, an increase in activity in option trading alone is not enough to drive the VIX up, as volume itself does not directly affect the index’s pricing, especially during normal market conditions. However, it could have a huge impact during moments of severe market stress, subsequently causing the probability density function of the S&P 500 to become more fat-tailed.
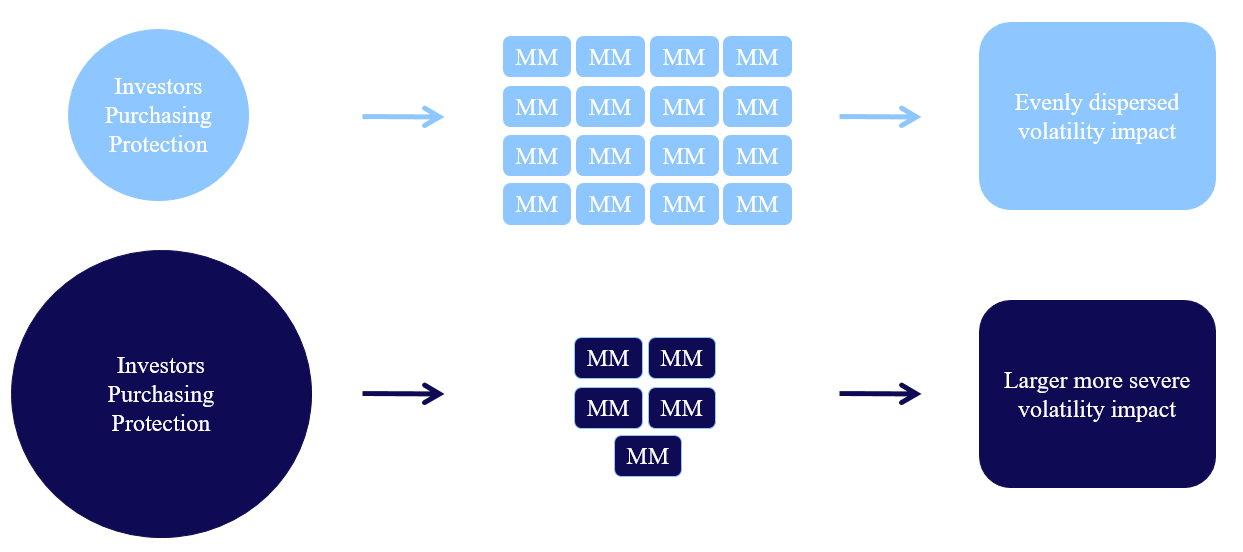
The concentration of option writers has an immense effect on liquidity during times of market distress. Technological advances have led to the centralization of market makers, and now they are fewer than ever before, with around five facilitating the bulk of U.S. derivative transactions. Usually, during periods of high volatility, spreads become larger as market makers seek protection. But the increasing flow of market activity, caused by the adoption of electronic trading has only furthered spread widening and order book thinning during periods of market distress. Now liquidity can evaporate faster than ever, and it’s not uncommon for bid-ask spreads to expand to the point where they become non-actionable or even disappear entirely.
Source: Bocconi Students Investment Club
So in order for the VIX to move higher, markets need to experience a shock that would have market participants pile into one side of the derivatives market, causing a huge order flow imbalance and forcing market makers to widen their spreads. A perfect example of this would be the flash crash of 2010, but we are yet to experience a similar true risk-off moment since 2020 since markets underwent a significant structural change.
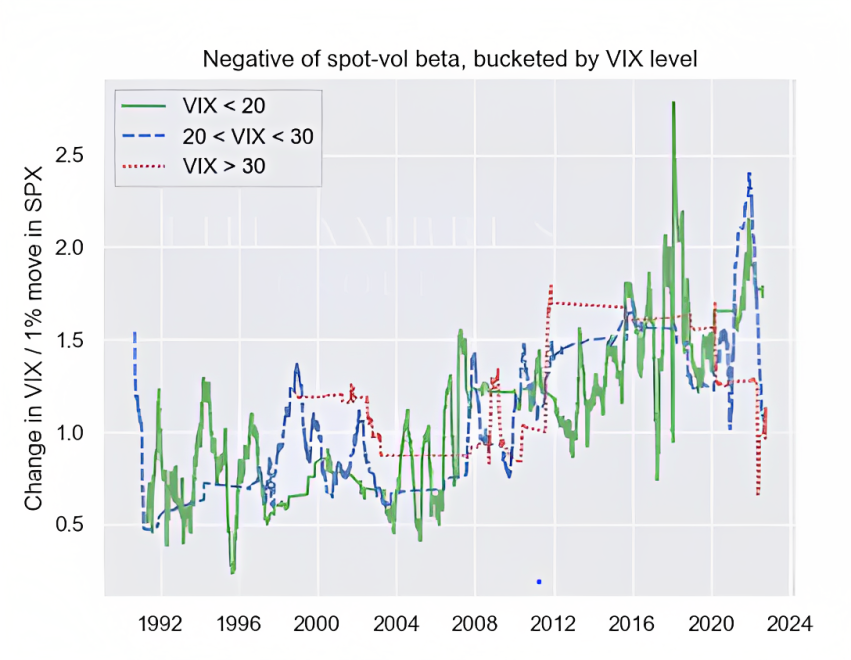
Spot-vol beta measures the expected change in implied volatility given a change in the price of the underlying. Nowadays most volatility traders have models forecasting spot-vol beta, but actual changes in volatility are non-linear and differ greatly depending on the current market environment. It’s estimated that during the crash of 1987 when the S&P sank 20% in a single day, the current VIX would have reached a level of 150. Suppose markets were to experience a similar move today. In that case, it’s possible that the index could reprice to even higher levels, due to the risks associated with increasing short-dated options and fewer market makers. Even though spot-vol beta has been low in 2022, it has been consistently increasing for the past three decades, and can easily escalate from low levels, as was shown towards the end of 2021, where a 5% decline in the S&P led to the surge of spot-vol betta to one of the highest levels ever recorded.
Source: Ambrus Capital
The chart shows a rolling 200-day spot-vol beta during different VIX regimes and normalised to volatility points. As this trend is becoming more evident throughout all VIX regimes, this year’s low relationship, should not be mistaken for a permanent change, and investors should be wary of the fact that the current market environment could produce both very rapid highs and lows in a matter of days. This overall increasing convexity of the VIX could create some exceptional opportunities for deep out-of-the-money derivatives. The changing spot-vol relationship makes the tail options relatively underpriced and could help generate disproportionate returns in the event of a market crash.
Sources:
- Ahmed, Saqib Iqbal. “Explainer: The Rise of 0DTE Stock Options and How They Could Be a Risk to Markets.” Reuters, 22 Feb. 2023. www.reuters.com, https://www.reuters.com/markets/us/rise-0dte-stock-options-how-they-could-be-risk-markets-2023-02-22/.
- Best and Worst 0DTE Options Strategies | Zero Days to Expiration Crash Course Ep. 1. www.youtube.com, https://www.youtube.com/watch?v=-udxHOVRa6A. Accessed 25 Mar. 2023.
- “Big Traders Flock to US Equity Options with Fleeting Lifespans.” Financial Times, 1 Dec. 2022.
- How to Trade 0 DTE Options (without Large Positions) | Zero Day to Expiration Course Ep. 2. www.youtube.com, https://www.youtube.com/watch?v=TWDhSd6p_7s. Accessed 25 Mar. 2023.
- “Investors Zero in on Short-Dated Options to Trade US Inflation Prints.” Risk.Net, 23 Mar. 2023, https://www.risk.net/node/7956289.
- Dale, Don. “Guest Post: The VIX Is Not Broken.” Alphacution Research Company, 26 Jan. 2023,
- alphacution.com/guest-post-the-vix-is-not-broken/.
- Wigglesworth, Robin. “The ‘Broken’ Vix.” | Financial Times, Financial Times, 30 Jan. 2023, https://www.ft.com/content/90224106-f6a2-4ca9-b053-77f51a493677.


0 Comments