An Introduction to the Dairy Industry
The dairy industry’s global value in 2022 was around $893 billion and is projected to grow $1243 billion by 2028 having witnessed strong growth in the past years with a strong likelihood for that momentum to continue. It is currently facing some challenges in the second half of 2023 with a significant drop in prices in dairy prices compared to last year, however, with stable volumes, having observed inflationary pressures otherwise throughout the economies globally especially in Europe. European dairy producers experienced issues with milk price volatility and increased relative raw material costs. With the delay in milk price adjustments the industry’s profit margins felt squeezes such as with FrieslandCampina which reported a drop in EBIT from
5% to 0.7% from first half of last year to this year. Going forward we will see the European dairy sector adjust to EU’s Farm to Fork strategy with likely production dropping and producers expanding into higher margin areas. Organic dairy is likely to play an important role in such areas as it has been observed to be far less responsive to drops in milk prices, 10.7% in organic compared to 27.9% in regular milk year on year.
Milk futures and options
Milk is divided into the following four classes: Class I being the milk that is used for beverages or milk products. Class II is the milk that goes towards ‘soft’ manufactured dairy products in the likes of cottage cheese, yogurt and sour cream. Hard cheeses are made from Class III milk on which we will focus more later, and Class IV is for butter as well as powder, NFDM, and whey. The USDA determines the pricing of the different classes using different formulas containing the values of cheddar cheese, dry whey, NFDM and butter and expresses those prices in dollars per hundredweight (CWT, 100 pounds). Class IV uses the butter price to determine a butterfat price and the Nonfat Dry Milk Price to get a Class IV Skim Milk Price in multiple steps and with different weightings to arrive at a Class IV Price. The Class II Price is determined by calculating a Class II Skim Milk Price using the Advanced Class IV Milk Price Factor with a differential and a Class II Butterfat Price. Class I is quantified using the averages of Advanced Class III and Class IV Skim Milk pricing factor together with an Advanced Butterfat Pricing Factor. And lastly Class III is the most complicated with the Other Solids Price, the Protein Value in Cheese, the Butterfat Value in Butter, and the Butterfat Value in Cheese affecting the final price.
CME Group currently offers futures, options and spot products for trading dairy with the most important being Class III Milk, Class IV Milk, Nonfat Dry Milk, Cash-settled Butter, Dry Weigh, and Cheese. Class III Milk contracts are cash settled, have contract listings up to 24 calendar months and are representative of milk used for cheddar cheese production. They are equivalent to 200 000 pounds (~90 metric tons) of Class III Milk, are priced cents per hundredweight with a minimum tick size of $0.01 per cwt or $20 per contract. The price limit is $0.75 per cwt -the expandable increasing it to $1.50- and no limits in the spot month with the last trading date being the preceding day on which the USDA announces the Class III price for that month. The American-style options contracts for Class III Milk are on one previously discussed Class III Milk future and hold the same position limit of 1500 contracts or in this case contract equivalents in the same month. Class IV Milk futures and options to hedge price risks of dried milk, butter and liquid milk that were introduced in 2000 with the same features as Class III Milk options and futures. Nonfat Dry Milk is traded in 44 000 lbs futures that have a tick size of around $11 per contract, daily price limits of $0.04 per pound and $0.08 per pound with the expandable, and a position limit of 1000 contracts in any contract per month; options on these futures also exist. The Cash-Settled Butter Futures trade in 20 000 lbs (~9 metric tons) with tick sizes of $5 per contract, daily price limits of $0.075 per contract with double with the extendable, and non-spot position limits of 1,000 contracts in any contract month and spot 500. Cheese futures and options reflect market expectations of cheddar cheese in the future and will be touched upon later again.
The Dairy Basis
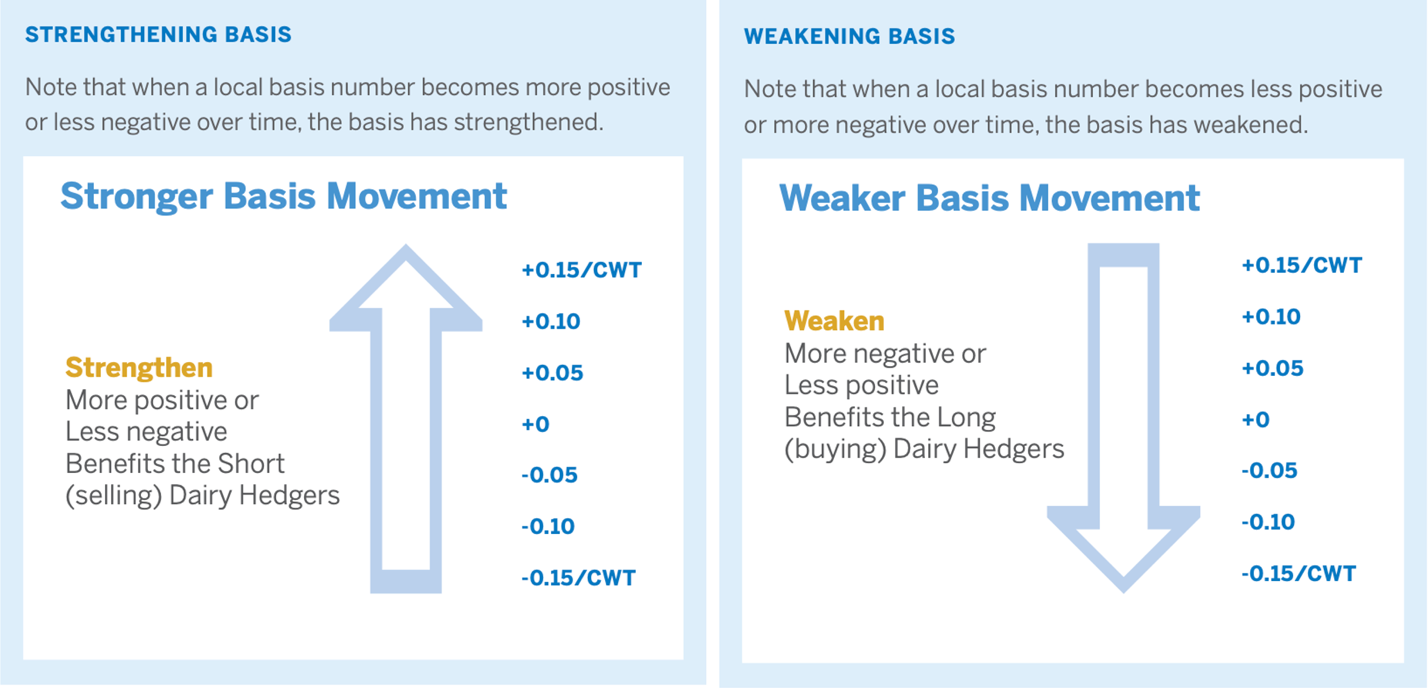
The basis has a major impact on the efficacy of the hedge strategy when using futures or options and helps a dairy hedger determine: if using futures or other products to manage their price risk exposure is viable, the times to initiate, modify or close their hedging positions and who to sell/buy from the cash product in the cash market. The dairy basis is different for every produce who receives a “milk check” every month of the difference of their milk that they shipped to standardized levels which are 3.5% for butterfat, 3.1% for protein, and 5.9% for other solids. As the producers are paid for the standardized levels, if the milk shipped exceeds these standards, the producers receive a premium and the other way they receive less. The producer’s monthly gross pay price is known as their mailbox price, and the relationship between the mailbox price and the Class III Milk price is their basis. However, since producers sell blends of milk being exposed to all four classes at the same time, their basis becomes hard to determine.
Source: CME GROUP
To compute the deferred basis, the forward cash market quote minus the futures price of closest contract month after the specific time period of the planned exchange in the physical dairy product is taken. The deferred basis can be compared to what hedgers expect the basis to be in the future and if the cash contract has a better basis then a hedger would want to choose to hedge using a cash forward contract instead of a futures contract, and for better expected basis a futures contract would be more suitable. This means that an opportunistic trader could in theory trade the dairy basis while keeping in mind that milk although being very liquid has a less liquid market than you have when trading a treasury basis for example.
The Cheese Industry
The cheese industry is a massive constituent of the dairy industry in both the US and Europe. In 2020, the United States produced 13.25 billion pounds of cheese, with Wisconsin leading at 3.36 billion pounds and California at 2.5 billion pounds. In 2023, August US cheese production amounted to 1150 million pounds, very similar to levels seen in 2021 and 2022.
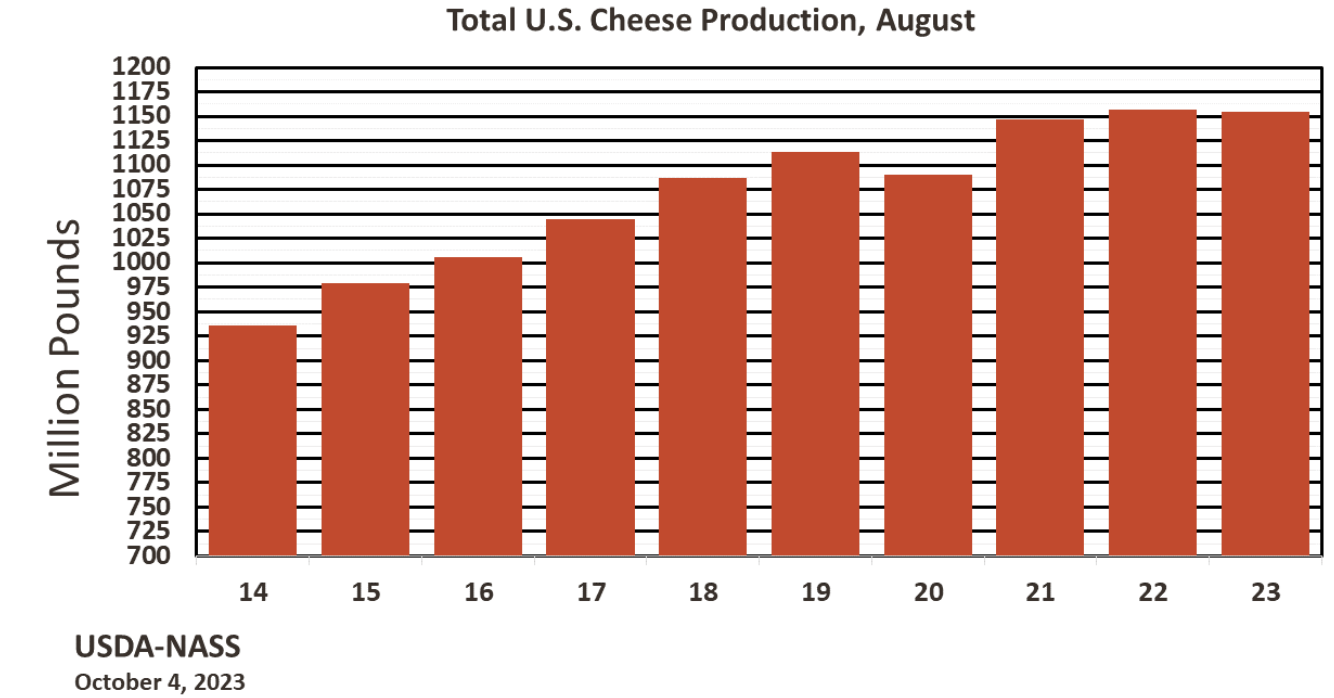
Source: United States Department of Agriculture National Agricultural Statistics Service
Cheddar Block versus Cheddar Barrel
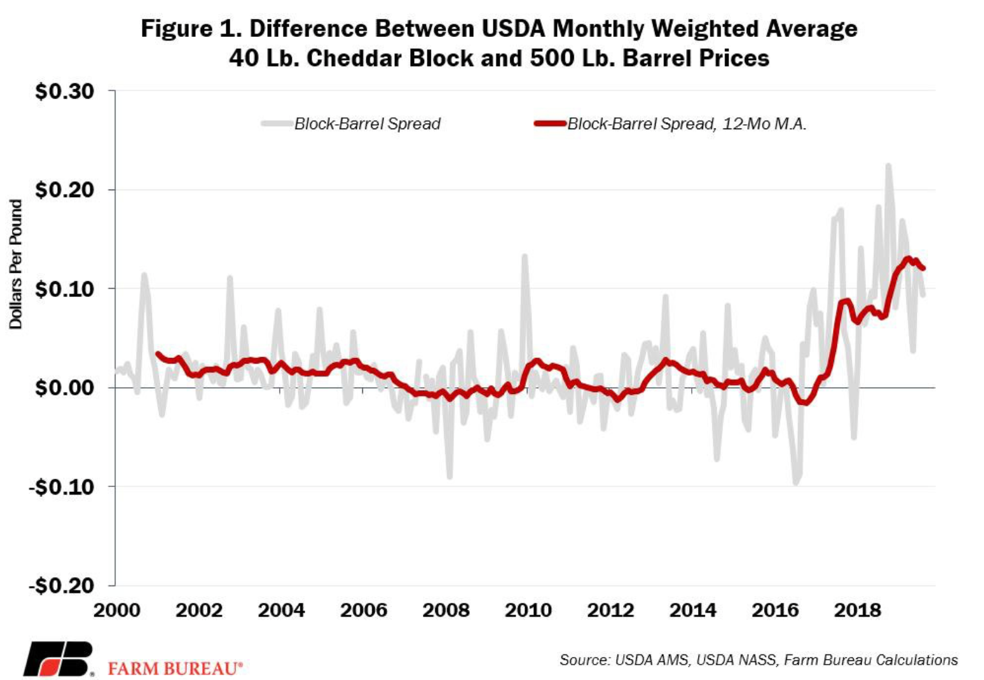
In the US cheddar cheese market, there is a distinction between 40-pound blocks or 500-pound barrels, this comes about because of the different end-products that are produced with blocks and barrels. Barrels on the one hand are used to make “processed” products such as nacho cheese sauce. Block cheddar on the other hand is used in “natural” products like shredded or chunked cheese for retail and food service. Therefore, the block and barrel variations are exposed to different demand dynamics and exhibit different prices. However, the spread only became significant starting in around 2016. Since then, cheddar blocks have been pricing at a premium to cheddar barrels with only few exceptions. Looking at 2016 to 2021, the average spread between block and barrel cheese stood at 12.4 cents. This is related, in part, to overproduction of barrels because of increased demand in whey, a byproduct of cheddar barrel production as well as increased demand for cheddar blocks.
Cheese Pricing
The price of cheddar cheese is primarily determined by factors such as the cost of milk, production and processing expenses where a main expense are energy costs and of course supply and demand dynamics as well as market conditions.
Since Milk III prices are rigidly computed by the formula outlined above, the Cheese component within the formula adds the market dynamic to Milk III prices. The cheese price that is used as an input for the calculation of Milk III prices is taken from surveys conducted and published by the USDA no later than 3 p.m. ET on Wednesday of each week in the “National Dairy Products Sales Report”.
As for price forecasts it is crucial to take into account the whole dairy industry which is currently experiencing erosion of dairy margins as well as lowered projections for the US milking herd in 2023 and 2024. With a lower expected supply of milk over the coming months and a steady domestic demand for American cheese the 2023 wholesale price forecasts for cheddar cheese were revised up to 1.819 USD per pound by the USDA in their Livestock, Dairy and Poultry Outlook published in September. When looking to 2024, forecasts are also increase for the price of Cheddar cheese to 1.845 USD. The 2023 price forecast implies an increase from the current level of the spot price on the 6th of October which was at 1.7025 for Blocks and 1.5775 USD for barrels. We believe that current increased domestic use of American-type cheese in the US will continue to be a driving factor for increased cheese prices over the coming months.
Cheese Futures and Options
The infamous New York Mercantile Exchange was opened in 1872 primarily to serve as a cash market for butter and cheese. Three years later it has been modified to the Butter, Cheese, and Egg Exchange. This goes to show that cheese financial products to mitigate risk in the cheese industry have been sought after already for a long time.
Until 2020, the dairy futures markets at the CME (Chicago Mercantile Exchange) featured six cash-settled contracts aimed at helping market participants in their risk management. One of these contracts is known as the CME Cash-Settled Cheese futures and options contracts (CSC) and settles based on the monthly weighted average price for American Cheddar cheese, as officially reported by the USDA. This price considers prices of both 40-pound blocks and 500-pound barrels of cheese. The monthly contracts are traded on the CME Globex and one contract unit consists of 20,000 pounds.
Starting in 2017, there was a change in the spread relationship between block and barrel cheese prices as noted above. And even though block cheddar cheese represents less than a quarter of all cheese production, its price is very significant as approximately 75% of all fresh cheese sales are priced relative to it. This is particularly crucial when it comes to one of America’s most sold foods: pizza. Americans consume approximately 30 pounds of cheese per person annually, and pizza ranks among the top choices for how they consume cheese.
Because of the increasing volatility in the price spread between block and barrel cheeses the effectiveness of the CSC contracts as a hedge for market participants with exposure to fresh cheese price risk declined. This led to the introduction of Block Cheese futures and options contracts (BLK) at the start of 2020. The contract unit for block cheese future is the same as for the CSC (20,000 pounds) and Block Cheese futures are also monthly contracts.
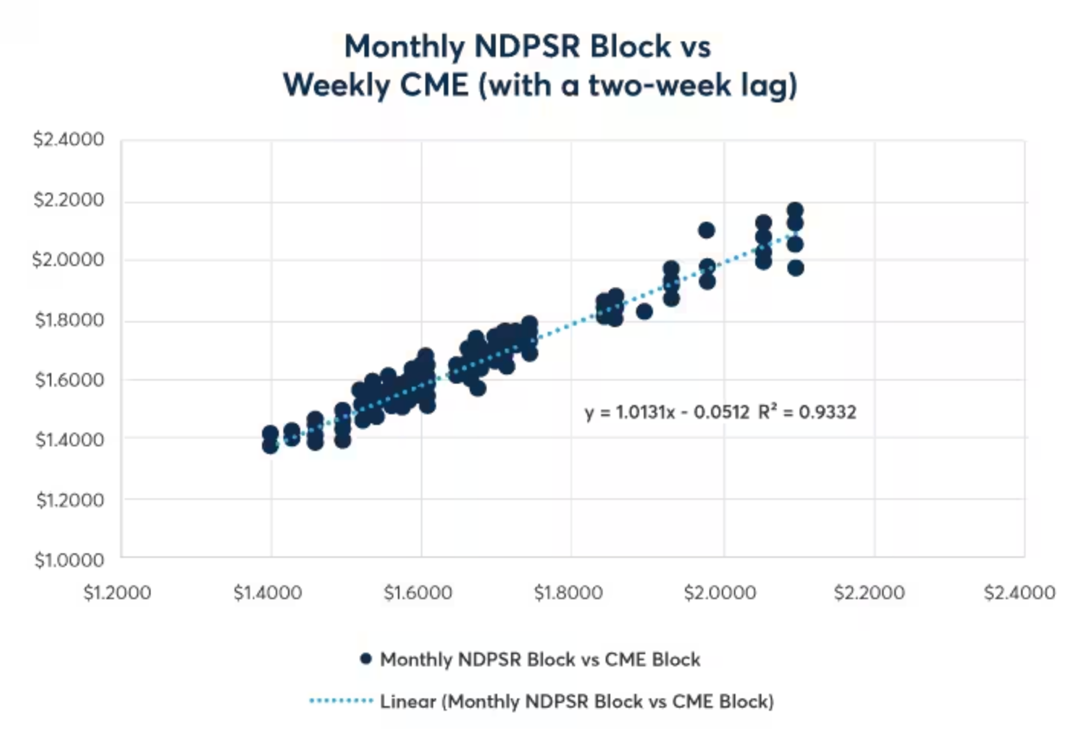
Source: CME
Looking at the regression conducted by CME pictured above, one can see that, NDSPR block cheese prices explained around 93% of the price change in the weekly CME spot price making the BLK contracts a good financial product to hedge Cheddar Block price exposure.


0 Comments