Not long ago, two major oil-producing countries (Russia and Saudi Arabia) reached an agreement, according to which the stake of output of those countries was capped at January-2016 levels. The move was very unexpected, since no one had bet that the deal would be reached, thus oil prices went through serious fluctuations the same day; although, the market calmed down quite soon. The outcome of the meeting, in fact, changed nothing: the production was capped at record-highs, and only two players (though, two of the biggest ones) participated to the agreement. But there is one issue we may conclude from this precedent: the “needs” of oil producers start to get in line with their “wants”, thus creating an incentive for action.
That let’s us allocate a lot more credibility to the recent news on the new agreement, this time a really global one, which can be achieved at a planned meeting of oil producing countries at mid-March in Russia. According to Russian authorities, it is scheduled on the 20th March, but there are some doubts regarding Iran participation, so the meeting may be postponed. Our idea is the following: so far, we can by no means forecast the outcome of the meeting, but we suppose, that it will definitely have a major effect on prices. If the cuts in production are agreed, the market is sure to surge, taking into account the strength of the current glut. If there is a complete fail, or there is no meeting at all, the market should slump, because, as we think, a good portion of the recent rally is attributed to the expectations of this meeting.
If the results of the meeting are mediocre, oil price should be also sliding downwards. The price level is quite high now and it may allow some producers to restart their operations at the rigs which had been previously frozen due to high costs, but reasonably assuming that the amount of production we see now will remain as it is, we may encounter the situation of so-called “operational stress”: this phenomenon is pretty feasible in oil, comparing to, for instance, metals, because the storage capacity is expensive and hard-hurdled. This happens, when the storage capacity is fully exhausted, and it may force the producers to suspend the production, which is very costly. In order to avoid such a necessity, producers may opt for selling at their cash costs, thus driving prices to very low levels. The level of potential operational stress is estimated at $40-45, so the current prices are really close to it now. But it is to be mentioned, that if the cuts are agreed upon, this level will not present a constraint anymore, because the overall supply landscape will change.
As we have already said, there is a big deal of ambiguity related to the expected meeting, but it definitely has to make an effect on prices. That is why we propose a long straddle strategy. Let’s discuss first in brief, what is straddle, and what it can be employed for. Below we present the P&L graph for this strategy at and before expiration.
It should be pointed out that there are two principal ways to profit from a long straddle. First of all, it may be used as a trend bet: if the underlying asset is trending, straddle makes money; this is the most straight-line implication of this strategy, and often it assumes that the options are held to maturity. The second, more complicated way to use straddle, is to make a volatility bet: since straddle consists of a call and a put, its vega (which stands for the sensitivity of the position value to implied volatility) is large, while its delta (sensitivity of the position value to the underlying price move) is small, and particularly, equal to zero for ATM-forward straddle. So, we may dynamically rehedge the position in order to keep it delta- neutral (with cumulative delta equal to zero), which gives us two opportunities: first, we may profit from increases in implied volatility, and second, we may profit if the realized volatility is higher than implied one; this feature is called gamma-scalping (it will be covered in one of the future articles in more details).
Gamma-scalping offers us a very nice way to enhance the profitability of our position: the point is that it prevents the time- decay of long options. In fact, employing this technique gives one the ability to profit from a long straddle even if the price lies just in the middle of the losing range at expiration, but it eliminates the possibility of making money out of a strong trend in underlying price. Thus, for us, the technique is interesting in the following way: since the implied volatility is really high now, we face strong time decay of a long straddle, so we may erase this effect by keeping on delta-hedging our position before the possible date of the meeting, and then unwind our hedge. The only thing required here is to follow the market all the time, not to miss the right news (that may appear before the estimated date as well, such as cancellation of meeting, for instance).
Implied volatility for short-term WTI options now is approximately 50%, and so does the trailing realized volatility on WTI spot price. We examine now how profitable gamma-scalping strategy may be potentially. As we see from the graph below, current realized volatility is a good proxy for current implied volatility, but current implied volatility is not a good predictor of future realized volatility.
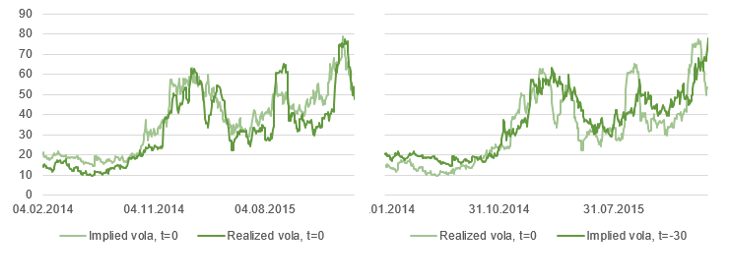
Source: Yahoo Finance, BSIC
This means we can not really say a lot about what is the market view on future realized volatility; on average, gamma-scalping appears to be insufficient to cover time-decay. But there are two issues: first, the graphs presented above are based on the assumption that delta is rehedged only once a day, at the end of the day; it doesn’t take into account the intraday price moves, which, if captured may augment the profitability a lot. And the second one, particularly attributed to our strategy, is that we do not use gamma-scalping as the predominant component of the profits we make; it is just a way to better up our position.
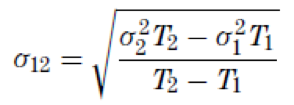
Our proposed strategy is event-driven, thus we can try to determine the proportion of implied volatility, attributed to the event we are looking for. Usually, if the market is aware of the event beforehand and the timing is known, the implied volatility for the month, when event is supposed to happen, is bigger than for the consecutive month. So, we can compute the IV of the event in the following way: first, we find forward volatility, or the volatility being implied from the first expiration at T1 until the second expiration at T2:
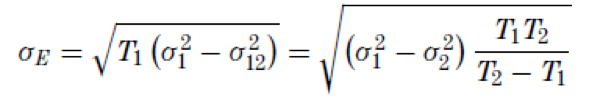
After this, we can find the volatility attributed to the event as the difference of the front month volatility and the forward volatility:
The crux of performing this manipulation is to find the jump in price, which market expects to occur due to event. Now let’s examine the actual volatility term structure for USO options: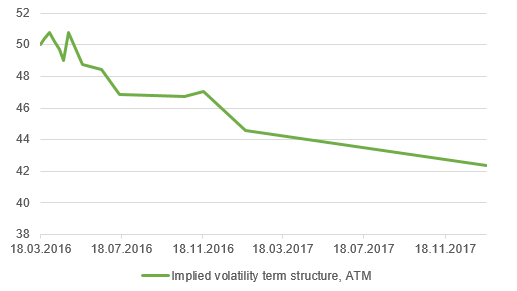 Source: Yahoo Finance, BSIC
At first, the shape of the graph we get seems to satisfy our requirements: the implied volatility decreases for some consecutive times after reaching the peak, and at some point the trend reverses and it begins to grow. But then, the structure continues to decrease up to the most distant time to expiration. This structure is called an inverted volatility structure, and, unfortunately, it nullifies our attempts to detect some abnormal volatility. The framework discussed above is based on the assumptions that volatility structure is normal, i.e. IV increases with the increase in time to maturity.
Generally, we think that the market recognizes the incoming event to have substantial pricing power, but the presence of inverted volatility structure puts an obstacle in calculating the exact fraction of volatility, attributed to the event. This can be explained by the fact that the dates are really fuzzy so far: we know about the meeting itself only from individual officials. Moreover, the results of the previous meeting were made public without any prior announcements, so obviously this time we may see the same thing.
As a conclusion, the markets are waiting now for the oil-producing countries meeting. This meeting should have a strong effect on oil prices, thus we suggest that long straddle should be a nice thing to do now. The two ways of making money out of straddle may be used: first, we can gamma-scalp it, and then unwind the hedge before the meeting to be able to profit from the underlying price move itself, or second, we can just buy a straddle and keep it unhedged till the expiration. The second strategy gives us purer exposure to trends in oil, but is subject to time-decay.
As we think, there are two most suitable ways to do this trade: we can long very short-term straddle without hedging it somehow, or we can buy a straddle with a bit larger time to maturity and proceed with gamma-scalping up to some point. The first one is more feasible, if we presume that either the meeting will take place on 20th of March, or it will be cancelled before this date, both of which will cause a major market impact. The possible candidate is a straddle made out of Apr-16 American options on WTI, traded at CME. The price of this combination will be around $1.6 (futures at $38.5 now), the maturity is on March, 22. As for the second way, it appears more well-reasoned if we think that the meeting may be postponed, and maybe several times, before some final result is known. Here we can use the straddles, expiring in April or May; the only point is that they are much more expensive: the former costs $4.59, the latter costs $6.08. But taking into account the gamma-scalping, the prices may not be unbeneficial at all.
Best of luck in trading, and keep on following us!
[edmc id= 3693]Download as PDF[/edmc]


0 Comments