Introduction
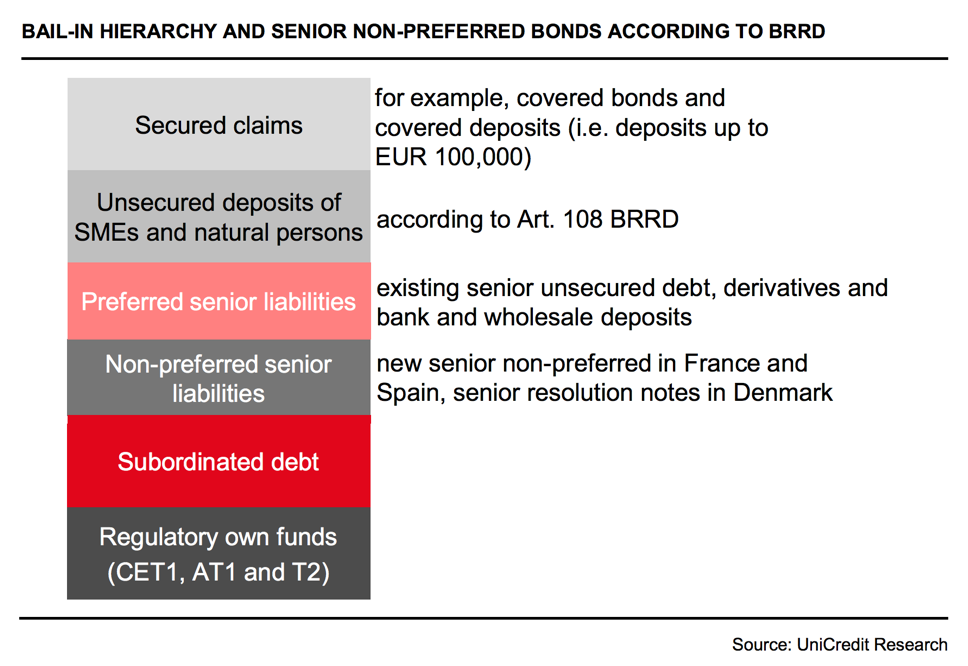
Banks finance themselves through a variety of different sources with different maturities and credit risk characteristics, for example through deposits, equity, short-term wholesale funding, long-term unsecured bonds, covered bonds, and asset-backed securities (ABSs). Hereunder a representation of the main long-term funding sources for a bank in their order of hierarchy.
In this article, we will describe certain segments of a bank’s capital structure. The funding products we will analyze will be the main pillars of non-deposit funding of a typical European bank.
Senior (preferred) unsecured debt
Senior unsecured debt instruments are one of the main long-term funding sources. Unsecured debt instruments are not backed by any collateral and have a fixed maturity. In case of bankruptcy, unsecured debt holders will not absorb any loss (the debt instruments are not eligible as capital) and they will be the first ones to be reimbursed within the category of issues with no additional guarantee.
The issuance of these debt instruments plays an important role in the activity of financial institutions in capital markets. After 2008, banks have started to prefer long term debt instruments as short term funding and opaque and complex ABS structures turned out to be sources of the problems emerged in the Great Financial Crisis. However, the failure of Lehman Brothers heightened counterparty risk and uncertainty in the market and for this reason, much of the issuance by banks was made of covered bonds, either guaranteed by the national government or included in the ECB covered bond purchase program (CBPP). The issuance of covered bonds required banks to increase the pool of assets used as collateral for these types of debt instruments. Investors in senior unsecured debt recognized that fewer assets could be used to pay them back in case of default and the riskiness of these debt instruments rose accordingly. Consequently, the issuance of senior unsecured debt by banks during the 2010-2020 years has decreased from pre-2010 levels and only a few big national banks have been able to use these funding instruments. The smaller banks, especially in the Euro Area, have used central bank liquidity to access funding instead of unsecured debt instruments.

Over the years, there have also been changes in bank regulation by financial authorities which have affected the ability of banks to borrow money from the ECB and have reinforced the concept of bail-in by transferring the risk of banking failure to bond investors rather than taxpayers.
Senior non-preferred bonds (Tier 3 Capital)
Non-Preferred Senior bonds (NPS) are a relatively new asset class of debt instruments that rank between subordinated debt and senior unsecured debt (i.e. the preferred senior debt). Non-Preferred Senior notes are unconditional, senior, and unsecured obligations and rank pari passu amongst themselves and senior to subordinated notes, but junior to senior preferred notes and any claims benefiting from legal or statutory preferences. Namely, they should have an original contractual maturity of at least one year, the instrument cannot be a derivative and can’t contain embedded derivatives.
These debt instruments are also called Tier 3 Notes and they will be eligible as capital under MLEC/TLAC regulation. Senior non-preferred bonds can be converted to equity or “bailed in” if a bank’s losses wipe out its capital buffers. The EU Member States were required to have legislation in place allowing non-preferred issuance by the end of 2018. Before this, they had their transitional arrangements. In France, non-preferred bond issuance was provided for as a new type of senior debt through legislation introduced in late 2016. Major Spanish banks issued non-preferred bonds through a subordination clause in the bond contract. In Germany, legislation introduced in 2015 allowed for all senior unsecured bank bonds to be bailed-in under resolution.
Bail-in eligibility for SNP relative to senior preferred bonds implies the existence of a BIRP (bail-in risk premium) in the pricing of these debt instruments.

Tier 2 Capital
Tier 2 Capital debt instruments are subordinated to depositors and general senior creditors of the bank. The objective of Tier 2 Capital is to provide loss absorption on a gone-concern basis, which means that Tier 2 Notes are converted to equity when the institution is in a liquidation state or is likely to enter it soon. Tier 2 instruments have a fixed maturity, whereas AT1s are only perpetual.
Tier 2 capital consists of the sum of the following elements:
- Instruments issued by the bank that meet the criteria for inclusion in Tier 2 capital (and are not included in Tier 1 capital)
- Stock surplus (share premium) resulting from the issue of instruments included in Tier 2 capital
- Instruments issued by consolidated subsidiaries of the bank and held by third parties that meet the criteria for inclusion in Tier 2 capital and are not included in Tier 1 capital.
- Certain loan loss provisions
- Regulatory adjustments applied in the calculation of Tier 2 Capital.


Explaining terms:
Paid-in capital generally refers to capital that has been received with finality by the bank, is reliably valued, fully under the bank’s control, and does not directly or indirectly expose the bank to the credit risk of the investor.
A step-up in a bond is a feature that allows for rate increases at periodic intervals.

Brief History of Additional Tier 1 Capital
When we examine the financial history, we can easily realize that when banks need capital to stay solvent it often is not very easy for them to access that capital. The usual lenders to banks -private investors- become increasingly reluctant to lend to banks due to idiosyncratic worries and/or worries originating from the linkages that exist within the sector. This reluctance causes the evaporation of capital available to banks creating risks of large bank insolvencies. Due to the critical nature of the banking sector for the functioning of modern markets, governments intervene and inject capital into banks to avoid catastrophic financial stress. The latest instance that this has happened is the 2008 Global Financial Crisis, which has changed financial markets in many ways. As GFC originated from the banking sector, lessons learned from GFC changed many angles of banks, including their capital structure. Experiencing the evaporation of capital available to banks during the crisis, it was evident that a review of bank funding structure had to happen so when something like the GFC happens again, the effect on banks hopefully will not be as lethal as it was back in 2008.
Contingent convertible capital instruments (CoCos) as a hybrid instrument is a product of this process. They were first issued after the GFC to be an available source of capital in times of stress. When CoCos are triggered, they support the bank’s funding structure either via getting transformed into common equity or by suffering principal write-down of the debt – both of which reduce the overall level of debt that the firm has. The trigger can be either a pre-set level of capital ratio or it can be totally up to the discretion of the regulator.
Trigger
As the trigger can cause principal write-down or conversion to common equity its definition is one of the most important features of CoCo bond dynamics. As mentioned before, a pre-set level of capital ratios can serve as a trigger for these instruments. Pre-set level of capital ratios (in other words, mechanical triggers) can be based on either:
- Book Value Based: They are triggers that are contractually set as the book value of Common Equity Tier 1(CET1) as a ratio of Risk-Weighted Assets (RWA). Here as banks will need capital urgently in case of solvency crisis book value based triggers might have disadvantages such as the fact that they are not calculated all the time (they are calculated and shared with the public only when the bank files financial results). This might delay the utilization of the CoCos, which would undermine their purpose.
- Market Value Based: They are triggers set as a ratio of the bank’s market cap to their assets. These measurements are continuous so they can overcome the “delay in trigger” shortfall of book value based triggers. Nevertheless, as stock prices are highly volatile and can be speculated these measures can be triggered via stock manipulation.
In addition to mechanical triggers, there are discretionary triggers which are triggers that can be activated by the sole discretion of the regulator. These triggers avoid the manipulation caused trigger risk of market value based trigger measures and they won’t face delays of activation that book value based triggers can cause due to their nature. However, they can also create uncertainties about when they are activated.
Overall, there is no “best” trigger measure. However, there is the possibility of having more than one trigger, in this set up different triggers can compensate for each other’s weaknesses.

The Call Feature and Coupons
CoCo bonds are issued as either super long term callable bonds (+50 years maturity) or as perpetual callable bonds. The first call date due to regulatory reasons cannot be sooner than 5 years from the issuance date. There used to be a “gentleman’s agreement” to call CoCo bonds as soon as at their first call date. However there have been two cases in which issuers have broken this agreement -which in any way is not contractual-, first was the Santander non-call event (more details on our article on the event: https://bsic.it/forever-instruments-maybe-equity-never-defaulted-at1-instruments-and-the-santander-case/) and the second was Deutsche Bank not calling one of its CoCo bonds which had a first call date of 30 April 2020. The explanation Deutsche Bank had for not calling the bonds were:
“These decisions reflect the Bank’s stated strategy of evaluating all call decisions primarily on an economic basis in order to manage the Bank’s cost of funding, taking due account of market conditions and the current and future regulatory value of the respective capital instruments.”
Deutsche Bank is not alone in taking the call decision as an economic decision. After each call date, in case of a non-call event, there is what is called a back end rate which is a variable rate + a certain spread for the coupons that are paid for each coupon payment date after the call date. As banks make the economic decision of calling or not calling the CoCo bonds, what they are looking at is the back-end rate they will pay versus the rate at which they can issue a new paper at that time.
Investor Base
As it can be understood from the design of CoCo bonds, they are the riskiest part of a bank’s capital apart from the common equity itself. This has obvious implications for the target investor base of the product. As most real money institutional investors such as pension funds have credit rating constraints on which asset they can buy, it’s not common to see them among the main buyers of Coco Bonds. The majority of CoCo bond buyers are hedge funds, banks, and asset management companies.
Capital regulations
As mentioned before, the financial crisis of 2008 posed a great deal of attention upon the structure of bank capital, as the buffers set before that period proved insufficient in periods of great market distress. For this reason, regulators around the world decided to meet once again in Basel, Switzerland, to underscore a new set of regulations and prevent further financial downturns. As a disclaimer, the keen reader should be aware before diving deep into Basel III, that the capital requirements should not be confused with the reserve requirements, which govern the assets side of a bank’s balance sheet. The latter are the proportions of its assets it must hold in cash or highly liquid assets, while capital is a source of funds and not a use of funds.
Since the aim of this article encompasses the current European banking outlook, we will forget for a moment all the world representatives attending the crucial Swiss meeting in 2009 and rest on what the EU took away from it. On 17 July 2013, more precisely, the CRD IV translated the Basel III guidelines into EU law — via the Regulation (EU) No 575/2013 on prudential requirements for credit institutions and investment firms. This is the current legislation on banking prudential requirements, and still holds to this day.
So, having endured a sovereign debt crisis which weighted on the shoulders of the Irish, Greek, Spanish and Italian banking institutions, how did the EU decide to revamp their balance sheets? Few measures have been taken accordingly, with a slow path to implementation finally crowned in 2019. Concerning capital requirements, the total amount that banks and investment firms are required to hold should be equal to at least 8% (Tier 1 + Tier 2) of risk-weighted assets (RWAs). The share that has to be of the highest quality capital – common equity tier 1 – should make up 4.5% of RWAs. On the top of this, financial institutions must hold sufficient liquid assets to cover high liquidity outflows under gravely stressed conditions – ie. “bleeding cash” – over a period of 30 days. Some guidelines are even entailing the infamous leverage ratio, which became a hot topic in the balance sheets of investment banks in 2008, but the utmost limitations that have been imposed are only about disclosing this number with full transparency on the balance sheet. An adequate leverage ratio should be about 12 as a rule of thumb, but no actions can be taken against the bank aside from the stigma coming from a market reaction.
Aside from the 4.5% required capital of common equity tier 1 capital, which then total to 8% of Tier 1 + Tier 2 capital, one may still beg the question what the other chucks could be made of. While the Basel III accords may diverge slightly in this grey area, the regulations around the European Union and the United Kingdom follow similar paths: further capital buffers have been enforced in the form of CET1 (common equity tier 1), and are particularly crucial, since an official breach of the ratio by a bank would force it to stop paying bonuses or dividends to shareholders. For instance, the Capital conservation buffer is equal to 2.5% of a bank’s total risk exposure. The Countercyclical capital buffer does not have any specific ratio numbers attached upon it, but claims that banks have to grow this capital in good times, when credit growth is strong, so that when things turn bad this buffer can be released and allow the bank to keep lending to the real economy. The Systemic risk buffer is about 1% to 3% for all exposures and up to 5% for domestic and third country exposures, but ratios above 5% have to be authorized by the European Commission. The Global systemically important institutions buffer may ring familiarly to some readers, because it follows the same US policy on “too big to fail” institutions – which have to comply to specific sets of rules – and this surcharge does range between 1 and 3.5% of CET1 of RWAs. Finally, the Other systemically important institutions buffer follows a similar idea to the previous mentioned but is structured around the domestic “too big to fail” financial institutions.
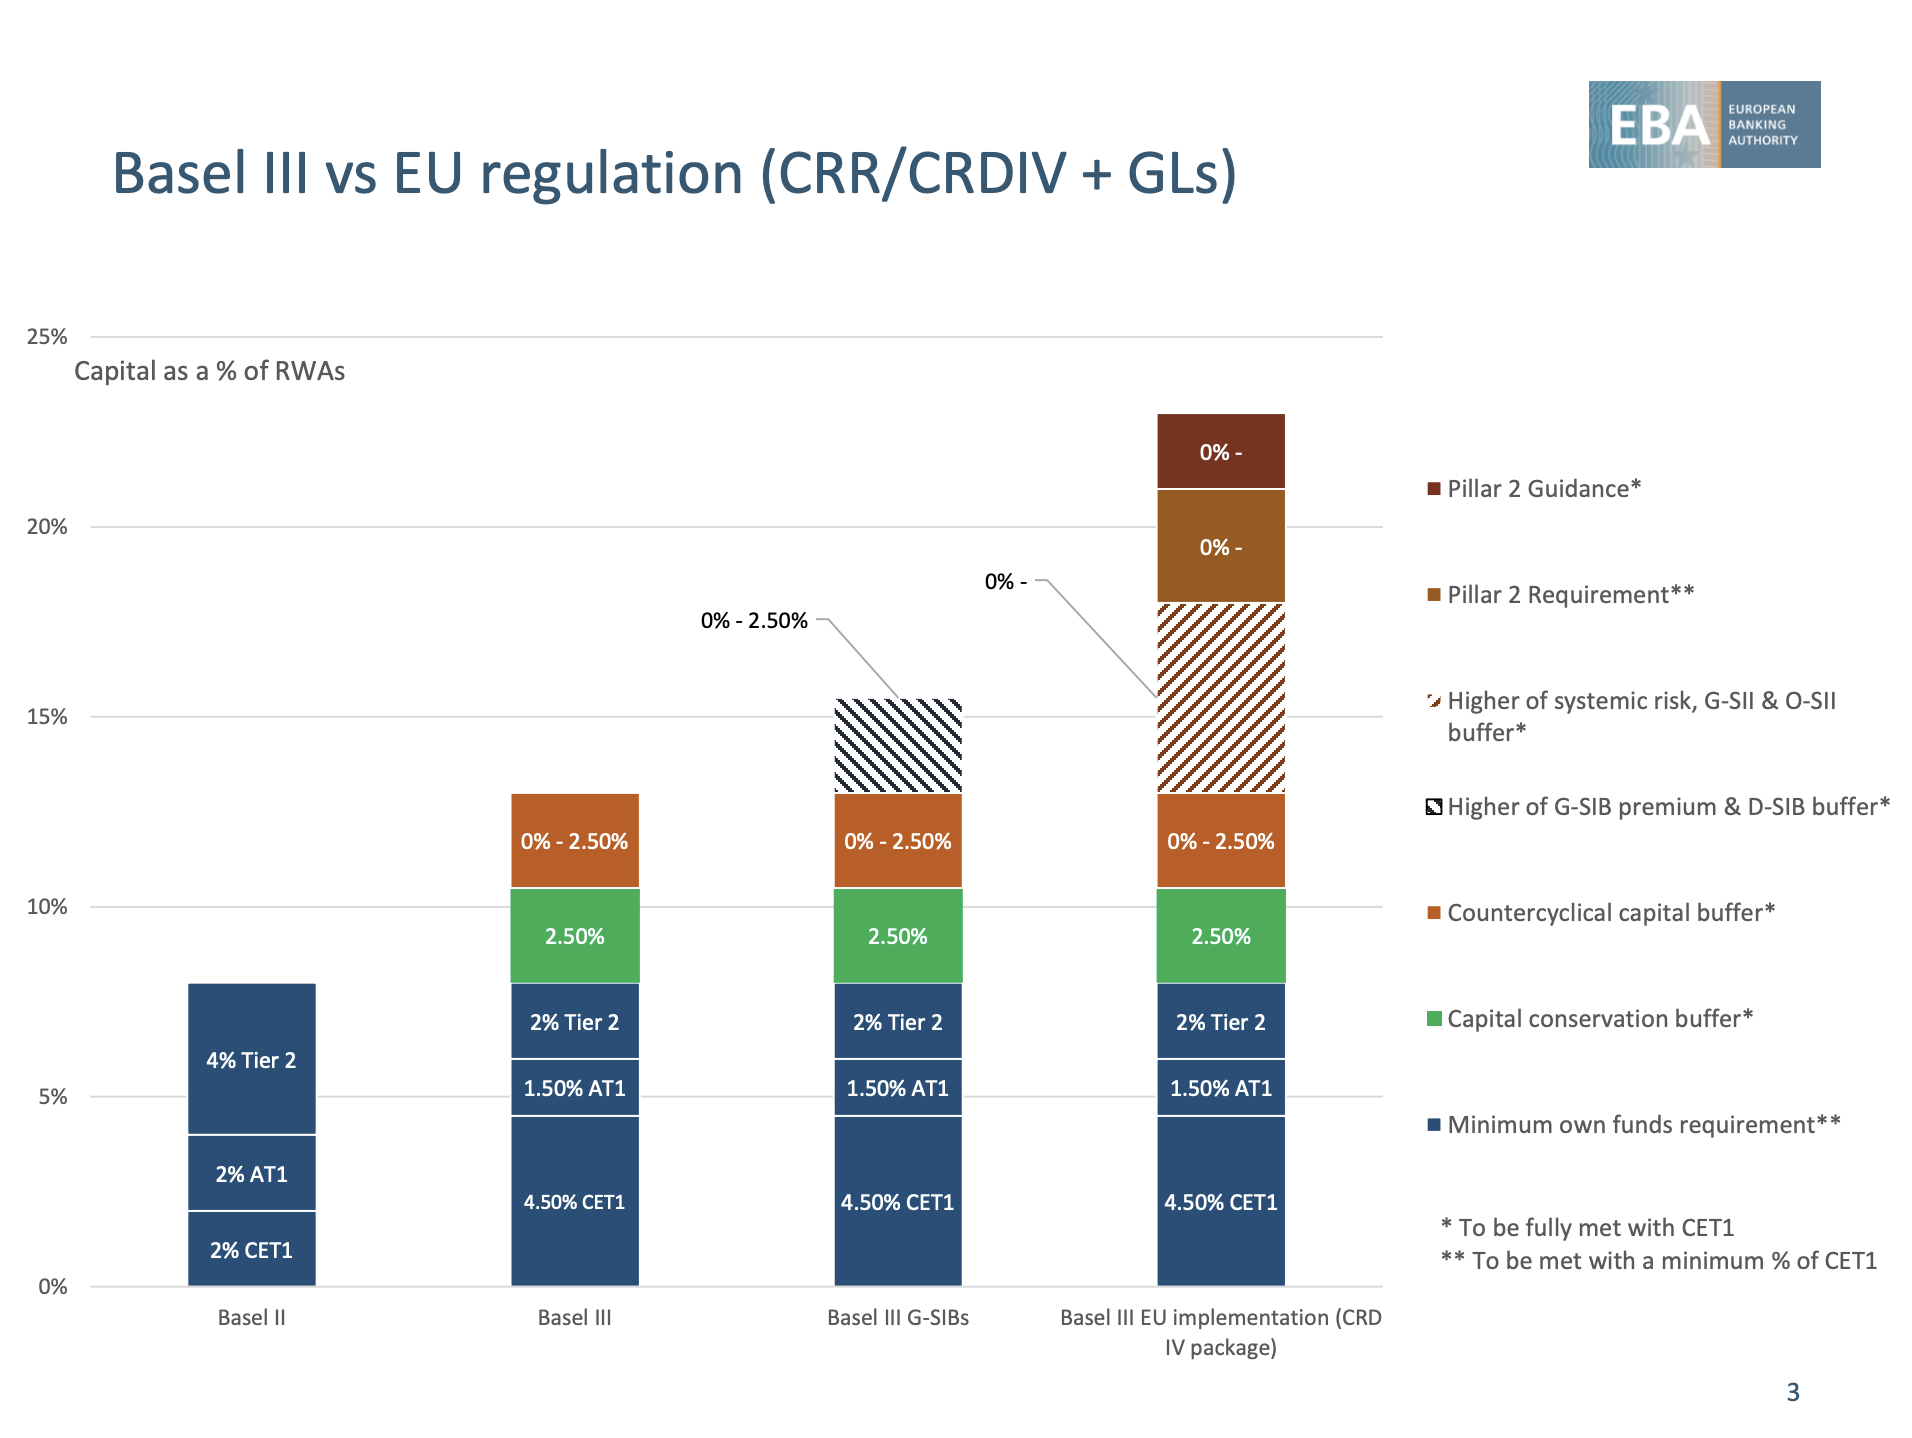 The most fundamental change, which should spark to the eye in relation to the pre-2008 accords, is that the banks move from an uni-dimensional type of world where you have only capital as a prudential reference, to multi-dimensional regulation and supervision, where you have capital, liquidity and the leverage ratio.
Source: European Banking Authority
Before diving into the current COVID-19 scenario and its management, what could be the problems of translating this pristine set of rules into action?
– The Risk Weighted Assets measurements: the CRR is the only authority defining how to weigh an institution’s assets according to their risk. Cash is disregarded in the computation, while other assets (e.g. loans to other institutions) are considered riskier and get a higher weight. In addition to risk weighing on balance sheet assets, institutions must have capital also against risks related to off balance sheet exposures such as loan and credit card commitments. It should be stated, however, that risk is not a sempiternal feature of financial assets, but will vary dynamically according to the swings of the economic cycle. Since it is known that asset bubbles are hard to predict, one should wonder how much weight the CRR would have placed on the “boring” mortgage-backed securities, delivering fixed cashflows for 30 years before the disaster struck.
– At any moment in time, assets are worth what buyers will pay for them. Determining the value of a liquid instrument, like a government bond, is easy. But what about bank loans which do not trade at all, and no one knows their market price? Finally, in periods of financial strain, even active markets can freeze, making the value of a bank’s assets even more difficult to value.
– Derivatives and accounting conventions complicate further the calculation of a bank’s balance sheet, because they don’t fully appear on the figures disclosed. The five largest U.S. banks held more than $200 trillion of gross notional value as of the end of 2015.
– Emergency actions such as forbearance – crucial in COVID-19 times – make balance sheets even more opaque, so that it becomes more difficult for investors and counterparties to back out a capital ratio and decide whether a bank is healthy or not.
– Even if buffer capacity were sufficient, banks may not have appropriate incentives to draw them down, because of restrictions on dividends and bonuses create a disincentive to their use. Additionally, bank management may be concerned that drawing down their buffer will signal to markets that they are in trouble, which (combined with the prospect of limited or non-existent dividends) may hamper their ability to raise equity capital or keep their funding sources.
COVID-19 and the way forward
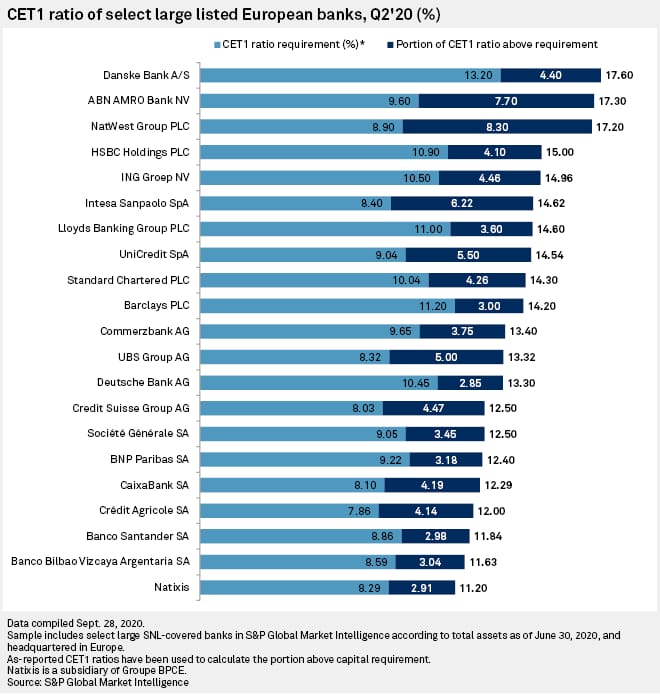
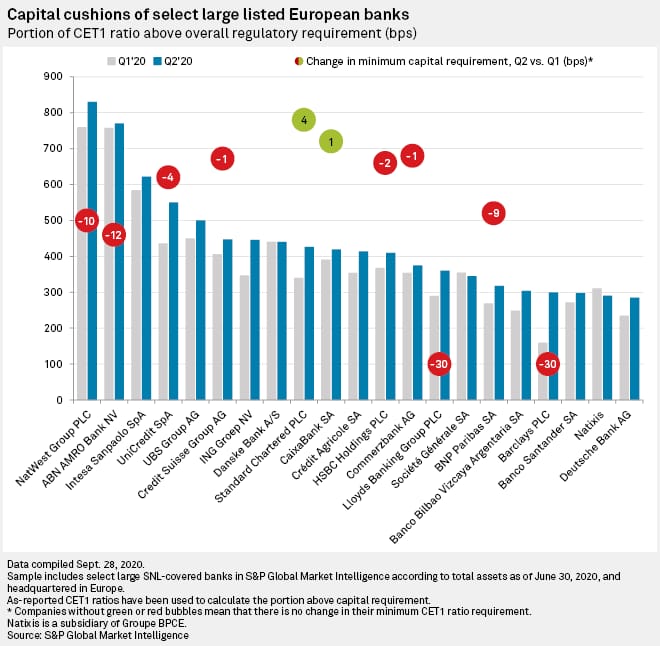
Given the preliminary remarks, it is understandable that the European banking sector was able to swiftly do its job in a period of stable economic activity and bearable inflation figures. The challenge, though, comes in hard times and that is when the motto “a smooth sea doesn’t make a skilled sailor” rings true. As of November 2020, have the banks aggregately been able to face up the music and weather the storm? Banks’ common equity tier 1 capital ratios were almost 15% by the end of 2019, up from 9% in 2009, including an average buffer of about 3% of risk weighted assets (RWAs), the EBA said in May.
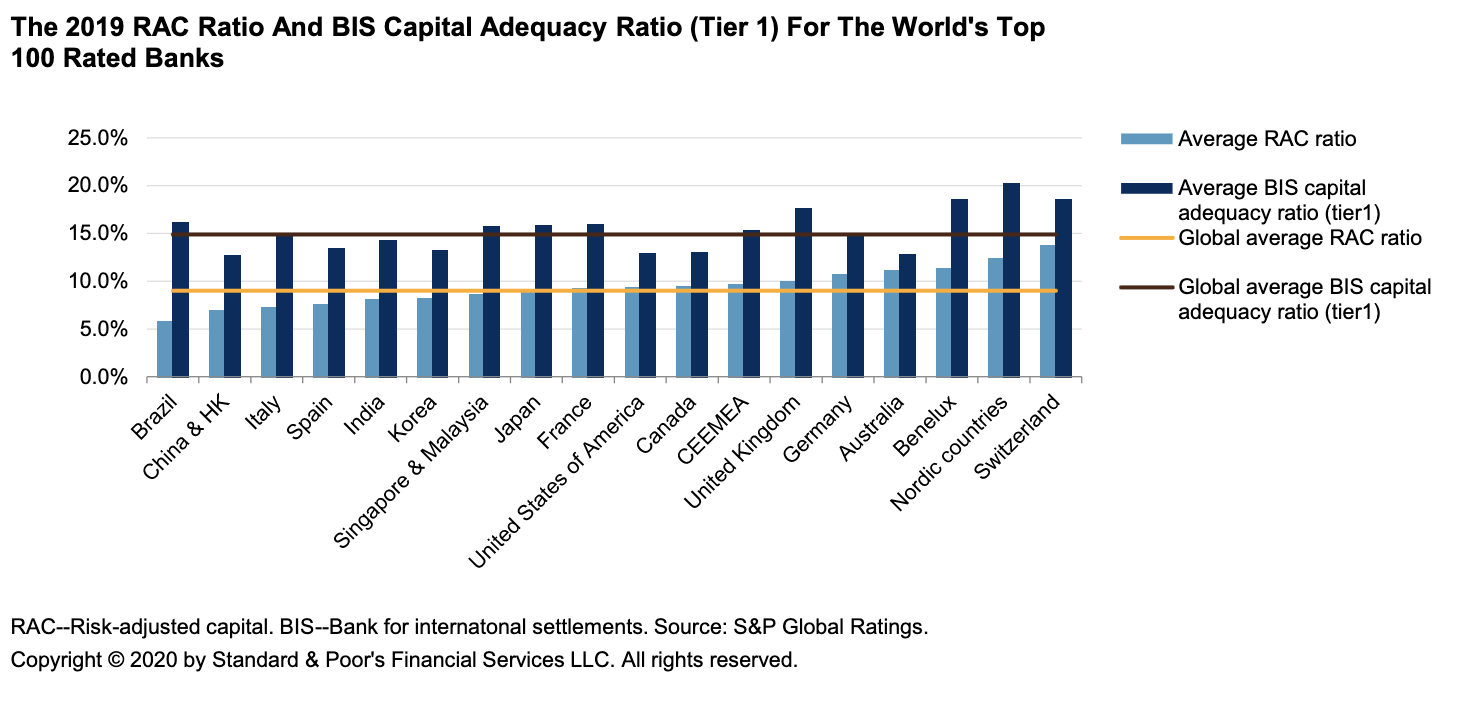 Source: Standard & Poor’s
First and foremost, when the risks rose the EBA quite logically urged banks to follow prudent dividend and other distribution policies, including remuneration and the use of capital for ensuring continuous financing to the economy. The EBA also emphasized that the capital relief the measures adopted by the EU to COVID-19 should be used to finance the corporate and household sectors and not to increase the distribution of dividends or make share buybacks to remunerate shareholders.
Regardless of this, banks were not completely immune to the economic impact of the crisis. Truth to be told, returns were already under pressure pre-COVID-19 as European banks’ returns on assets and equity have fallen over the last decade to below 0.5%. This is precisely the moment when the line between capital requirements and buffers needs to be drawn, since the latter should be duly deactivated in crisis times. In fact, the table below show that the theory was followed by the actions taken in various banking jurisdictions.
 Source: International Monetary Fund
Notes: CCyB = countercyclical capital buffer; G-SIB = globally systemically important bank; NPL = non-performing loan; IFRS = International Financial Reporting Standards.
*= EU provides guidance to member states who are expected to implement it. Jurisdictions in the EU often implement the guidance non-uniformly.
** = Canada has two G-SIBs, which are also Domestically-Systemically Important Banks, where the capital requirements exceeded the minimums, so release of D-SIB buffer is sufficient.
*** = If a U.S. bank uses the exclusion of Treasuries and deposits at the Federal Reserve Board from the leverage ratio it needs to request approval for capital distributions. Additionally, the Fed has restricted share buybacks and most dividend distributions during Q3 2020 for large banks following the release on June 25 of the DFAST 2020 (stress test).
Not so much time has passed since March and the dire situation is still unfolding, but some research has been done. According to a paper of June 2020 written by Schularick, Moritz and Steffen, Sascha and Tröger, a capital shortfall in European banks of up to 600 billion euro in a severe scenario is predicted, and around 143 billion euro in a moderate scenario. This would mean a precautionary recapitalization on the European level that puts the European Stability Mechanism (ESM) at center stage. A research by McKinsey tries to run the numbers with the utmost prediction, envisioning three possible scenarios: Scenario A1, considered the most likely, entails a muted world recovery by 2023. Scenario A3 reflects more optimism about the virus’s spread and the public-health response and, finally, scenario B2 reflects greater pessimism about the effectiveness of the public-health response. The definite result is that capital buffers look adequate but may require further injections in the  B2 scenario. The danger zone threshold is signaled once the CET1 ratio goes below 5.5%.
 While it is not the goal of this article to predict minutely the following turmoil of the banking sector, we can put our feet firm on the ground of reality and check what the COVID-19 effect has been on a bank’s balance sheet since now. At first sight the losses are greatly bearable, but it shouldn’t be forgotten that in the current distorted economy most loan losses (80%) are taken by the governments’ rising deficits. Things will surely get worse before getting better, but the takeaway is the movements of the following graphs can shift widely according to the future policy decisions. There are even particular cases, such as the Italian bank Monte dei Paschi di Siena, where a further injection of capital has already been scheduled.


0 Comments