Brazil is coming from a three-year recessionary period, with an unemployment rate still above 12%. Despite this, the Bovespa index (IBOV), which is the top equity index for the Sao Paulo Stock Exchange and has 59 components, is up almost 10% since January 1st 2017 and up 70% since January 2016 (Chart 1). The current peak has produced a widespread deterioration of the trading multiples of the listed companies. In this article, we will give an overview of the main macro drivers of this trend and we will assess the sustainability of this movement. Finally, we will suggest a possible trading strategy to exploit the current environment.
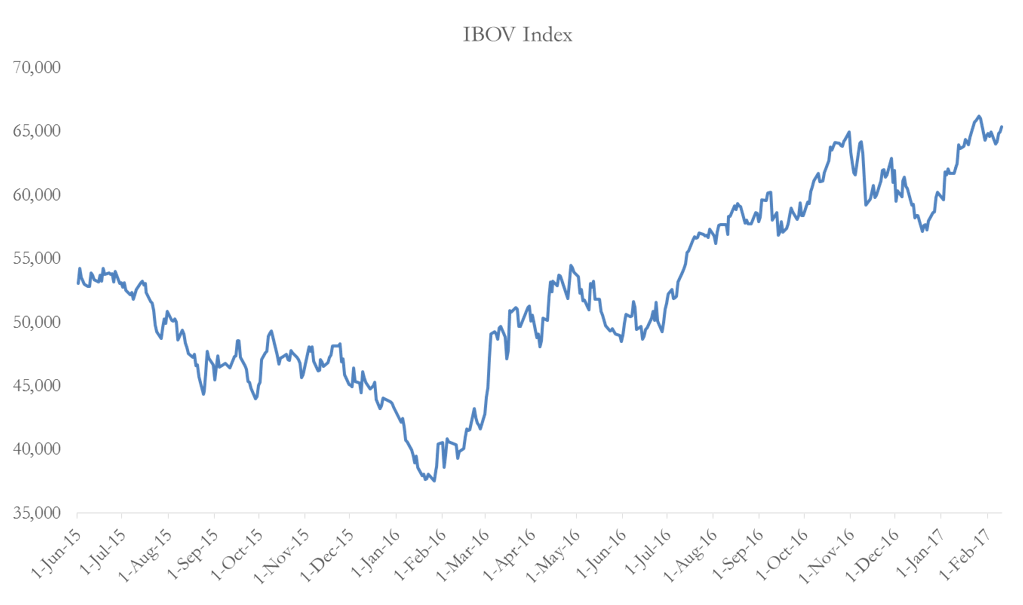
Chart 1: IBOV Index (source of chart data: Bloomberg)
Government and fiscal policies
Brazil is emerging from a period of political turmoil, which saw the suspension of President Dilma Rousseff on May 12th 2016 for impeachment trial. As a result, Michel Temer took office on August 31st 2016. Markets looked with favour at the nomination of President Temer given expectations on more business-friendly policies. This has quickly pushed up Brazilian equities in the past 12 months. Despite the harsh austerity measures put in place by the government, the deficit stood at 8.9% of GDP in 2016 and the primary deficit is forecasted to hit 2.5% of GDP in 2017, missing the target of 2.2%. The government’s budget has been strained over the last few years by the rising unemployment, which is weighting putting downward pressure on real wages and personal consumption. Finally, there has been only a timid deceleration in the recessionary pattern of the GDP YoY growth and the Current Account (CA) remains negative, as you can appreciate looking at Chart 2. Yet, further austerity policies might be eased thanks to the fact that the elasticity of tax revenues with respect to GDP growth has declined to 2.0 from 3.1 over the last decade, thus making the fiscal budget more resilient to unexpected reversals of the GDP growth path.
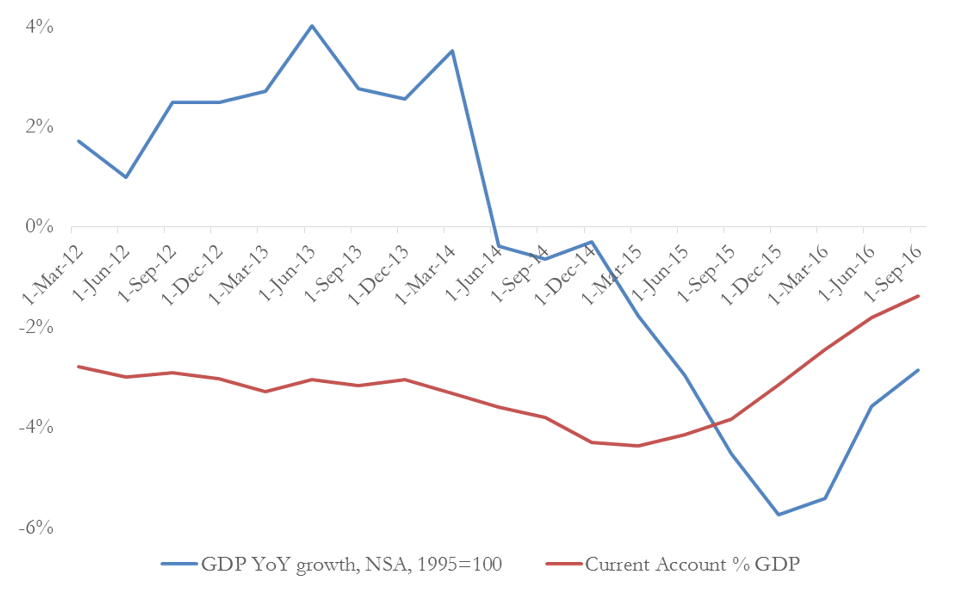
Chart 2: Macro indicators (source of chart data: Bloomberg)
Monetary policies and currencies
The recession has also been stretched by the monetary tightening that followed the end of the US QE and the start of the FED tapering process. The Banco Central do Brasil (BCB) hiked the benchmark interest rate from 7.25% in 2013 to 14.25% in mid-2015.
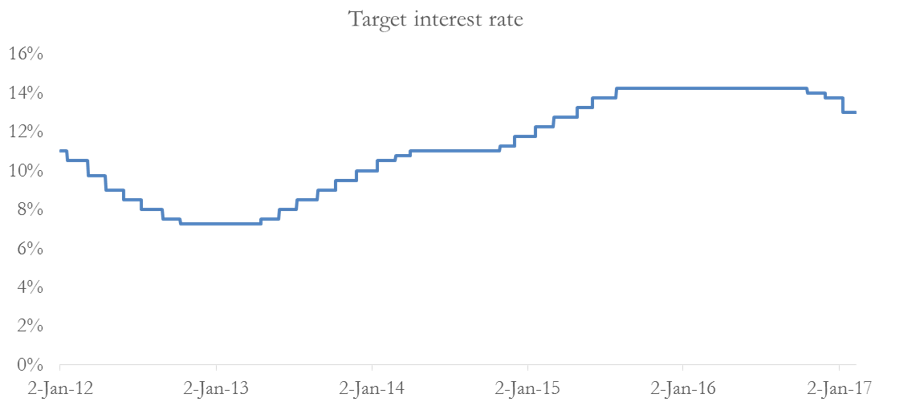 Chart 3: Brazilian target rate (source of chart data: Bloomberg)
This move was implemented as a response to the depreciation of the Brazilian real (BRL) with respect to the US dollar (USD) during the same period and to the jump of inflation from 5% in 2013 to more than 10% at the beginning of 2016. This contributed to ignite what we can call a “balance-sheet” recession, in which companies found themselves deeply over-levered and were forced to scale back production and restructure their balance sheets.
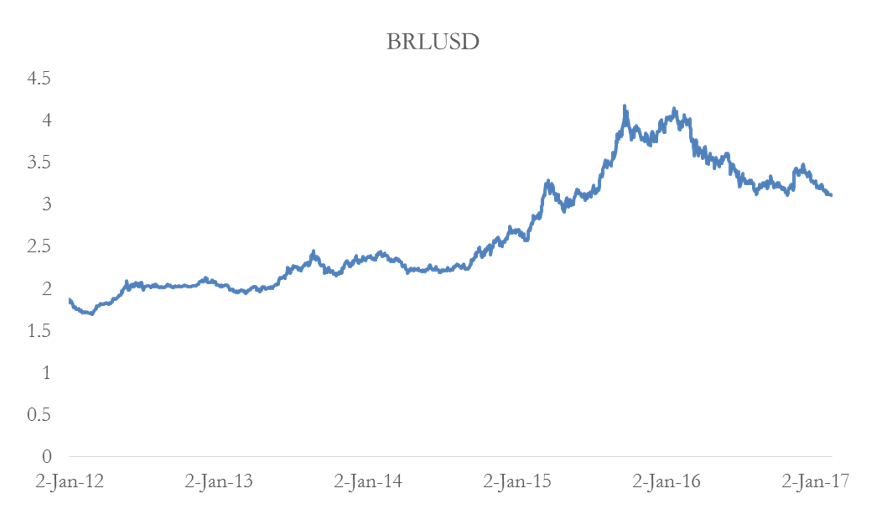 Chart 4: BRLUSD (source of chart data: Bloomberg)
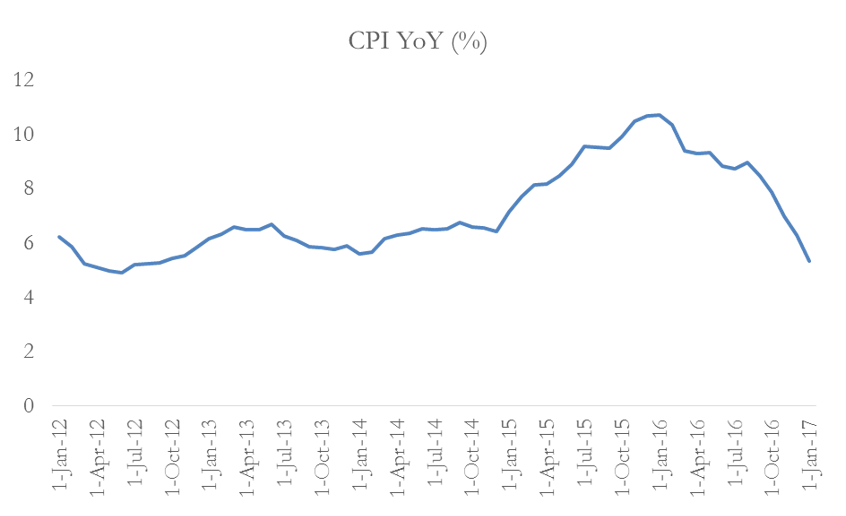
Chart 5: CPI YoY % (source of chart data: Bloomberg)
Over the last few months, this protracted tightening contributed to a complete turnaround of the BRLUSD exchange rate[1], with the BRL rallying against the USD. Furthermore, we have also seen a closely related and sudden fall of the CPI to 5.35% YoY[2] from a height of 10.71% YoY in January 2016. This rapid change of trend has pushed real interest rates above 6%, something which is increasingly attracting foreign capitals in the bond market, in spite of the still high idiosyncratic risks. This led to a changed economic landscape: negative GDP growth, negative CA, appreciating Brazilian real and falling CPI.
The new environment, coupled with the still high unemployment rate, has driven the BCB to start easing its monetary policy in October 2016 in order revive growth by encouraging investments and giving some relief to levered companies. The BCB is expected to maintain this easing path with around 350bps of policy rate cuts over the rest of 2017.
Historically, monetary easing has consistently pushed up equities market in Brazil and the change in the expectations about the future policies of the BCB has been one of the main drivers of the current rally of the Bovespa index.
It is yet to be seen if the expected easing cycle will sustain the improvement of the broader economic outlook. A positive factor for the economy of Brazil is that it is more domestically oriented than many other emerging economies. To give a reference point, the ratio of the Brazilian exports with respect to GDP is equal to 13%, not comparable with 22.1% of China, 29.5% of Russia, 30.7% of South Africa, 19.9% of India (source of data: World Bank). This implies a lower elasticity of GDP with respect to an appreciation of the Brazilian Real ceteris paribus. This has made Brazil the best target of investors in the emerging markets that need to hedge against geopolitical risk and against the uncertainty around the new Trump administration’s trade policies, thus further strengthening the Bovespa rally.
On the other hand, the BCB will still have to adjust its next moves by taking into account what the hiking path followed by the Fed will be. In fact, in case of faster-than-expected hikes by the FED, the BCB might respond by not easing furtherly, in order to arrest a possible excessive depreciation of the real.
Commodities
Brazil is heavily reliant on raw materials, crude oil and agriculture and this is reflected in the effect that commodities prices have on the performance of the Bovespa index. Just by looking at the chart of crude oil and at that of Bovespa (Chart 1), we can notice how the shapes of the two curves are incredibly similar (the two charts are made easily comparable, given they have same start and end dates).

Chart 6: Brent crude oil (source of chart data: Bloomberg)
Indeed, Petrobras (the most important oil and energy company in Brazil) weights for almost 10% of the market capitalisation of Bovespa index. Even though we cannot write about a proper index domination, the influence of this stock on the index performance is not negligible.
Rolling correlations
Given this premise, we decided to compute rolling correlations between IBOV and BRLUSD, IBOV and Brent and BRLUSD and Brent. We plot 120-days rolling correlations in Chart 7.
It is not a surprise to see that the 120-days correlation between the Bovespa index and the Brent crude oil has been positive from 2012 onwards (more significantly after 2014). This implies that higher oil prices have been accompanied by higher equity prices over the past 5 years, and vice versa. We checked also for a correlation between the exchange rate BRLUSD and crude oil. As expected, the correlation is slightly negative, consistently over time. This means that higher oil prices have come together with an appreciating real versus dollar over the past 5 years. This is at the heart of the possible explanations for the recent rally of the Brazilian Real. Given the strong exposure of the Brazilian economy to oil prices, the recent positive trend of crude oil has had a causal and beneficial effect on BRL, together with the mutated domestic and international political environment. Also, given the two previous considerations, transitively we might assume a negative correlation between BRLUSD and the Bovespa index. This intuition is confirmed by the data shown in the chart: an appreciating real has gone together with rallying equities in the past 5 years.
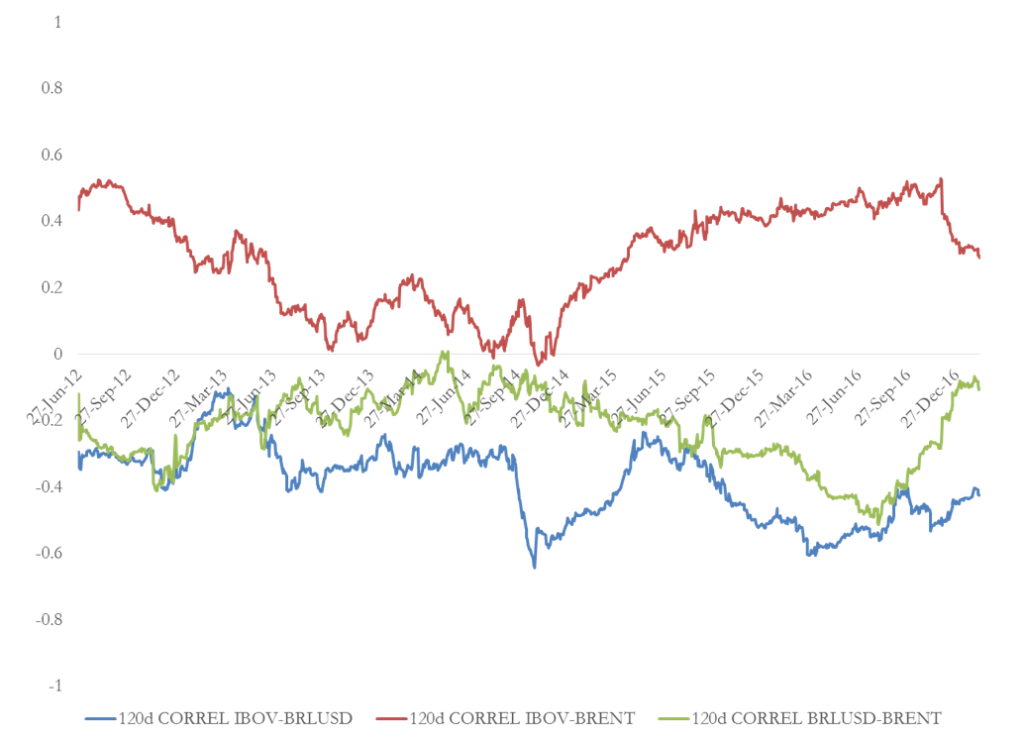 Chart 7: 120-days rolling correlations (source of chart data: Bloomberg)
The results shown in the chart are based on 120-days correlations. Similar results are obtained also for 30-day and 60-day correlations, which are not presented for reasons of parsimony and due to their more volatile paths.
Since we have also iron ore and soybeans among the top exports of Brazil, we checked for correlations between these commodities and the Bovespa index, but there are no significant results over the time span we are analysing.
The bull call spread on the Bovespa index
The previous analysis gives rise to the following conclusions. Firstly, the recent rally of the Brazilian equities has been mainly driven by the normalisation of crude oil prices. Stronger oil and a stronger currency, together with an inflation rate back under control, are driving the BCB to ease its monetary policy, thus helping the over-levered Brazilian companies. Secondly, despite the fact that expectations for GDP growth for 2017 are of just +0.5% according to a BCB survey, this provides a slight improvement with respect to the past year. Thirdly, we believe that investors will keep on using Brazil as a country to partially hedge against a “Trump” risk for the reasons previously explained. Hence, while acknowledging the risks posed by the quite bleak macro scenario, we believe that there is still some upside in the Brazilian equities market in the coming months.
Before setting up our trade, we want to have an idea of the realized volatility of the IBOV index in the past year. To achieve this objective, we estimate an exponentially smoothed variance V for the log returns of the IBOV index. We set the smoothing parameter λ to 0.95. We use a backward-looking estimation window of n=255 trading days. Defining r as the daily log return and applying the usual formula:
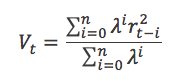
we get an exponentially smoothed annualized volatility of 19.29%. This is below the historical annualized volatility of 23.58% over the 5 years. This finding is consistent with the intuition that in up markets volatility tends to fall.
Given our view and our risks analysis, we want to set up a bullish directional strategy on the IBOV index with a short horizon of 90 days. For the following computations, we use Bloomberg. Hence, we implement a European bull call spread strategy on the IBOV index with 90 days maturity. We buy an ATM call and sell a 5% OTM call. As expected, the implied vol of the ATM call (20.597%) is higher than that of the 105% call (19.543%) (it is nice to notice how in this case implied vol is only slightly higher than our estimate of smoothed realized vol). The cost of the first leg is 3611.44, while the premium received on the second leg is 1908.76. The overall cost of the bull call spread is 1702.68, or 2.575% of the underlying price (at 66124.52). The position will have a positive delta of 19.35%, negative vega of -3.90 and positive theta of 0.19.
Notes:
[1] BRL per USD, so that an increase of BRLUSD implies a depreciation of the BRL. This point will be later detailed.
[2] Within the target band set by the BCB, i.e. 4.5% +/- 2%.

0 Comments