On May 6th, Sergio Marchionne has announced an ambitious, probably unnecessarily bullish, five-year plan at the Chrysler division’s headquarters in Auburn Hills, near Detroit. Through this article, we are going to evaluate it and its impact on the stock price, from both the fundamental approach and the technical analysis methodology.
The industrial plan in detail
According to the plan, one of the key growth drivers of FCA are sales, which should surge from the current 4.4 million vehicles per year to 6.3 million in 2018. Moreover, thanks to new joint ventures in China and India, there will be an extra 700,000 vehicles per year, which should be the basis for a significant expansion in these emerging markets. Marchionne has always considered the target of 6 million vehicles as the minimum limit for the survival of an automotive company and, during the presentation of the plan, he has reaffirmed “I’ve always had the view that 6 million cars was D-day”.
Let us now focus on how FCA wants to reach these incredible results.
Firstly, the company expects sales to grow only roughly 3.4% annually in Europe. Consequently, the main source of sales growth will be America: LatAm, and in particular Brazil, have been the most interesting markets for light vehicles in the past years and expectations are still extremely positive.
Secondly, there will be investments of €50bn on the various brands of FCA. In particular, Jeep will lead the charge with an aggressive plan to increase its worldwide presence (according to the business plan, Jeep’s sales are expected to increase from 732,000 last year to 1.9 million in 2018). The “umpteenth” relaunch of Alfa Romeo will be pushed with 8 new models: they have been designed to compete with Ford and Volkswagen vehicles and should bring sales to 400,000 vehicles worldwide by 2018. The expansion of Chrysler’s sales in North America is planned to be from 350,000 in 2014 to 800,000 in 2018. Sales of highly exclusive Ferrari will remain steady at 7,000 units and Maserati will continue its bid to become a leading luxury brand, with new models and increased market penetration.
Finally yet importantly, as explained by the CFO Richard Palmer, the net industrial debt would reach a peak of €11bn in 2015 (as a consequence of the massive investment plan) and then decline to nearly €1bn by 2018. On this point, though, Mr. Marchionne has not been as clear as expected, especially regarding the debt and the fundraising method to sustain the plan. He said “probably the most prudent thing that one can do is raise some type of equity-linked instrument”. So, according to our view, there will be an issuance of hybrid securities (such as convertible bonds), most likely in December after the listing of FCA in Wall Street.
Multiples analysis
Given what we have said so far, we try to translate the business plan into markets values now. In particular, we focus on three multiples: P/E, EV/Sales and EV/EBITDA.
According to P/E “ttm” (i.e., trailing twelve months), Fiat has been trading at premium compared to its closest competitors. The P/E ttm is 13.2 versus an average of 9.8 of the comparable set. At first glance, the stock would seem to be overrated. However, if we look at the balance sheet, we can notice that approximately €500 million of non-recurring expenses affected the income statement. As clearly explained in the notes to the financial statements, this cost “mainly includes write-downs of €272 million as a result of the rationalization of architectures associated with the new product strategy”. Therefore, if we consider these write-downs as exceptional events, we find that the adjusted P/E ttm is approximately 11.2: it is still above peers, but the gap is narrower.
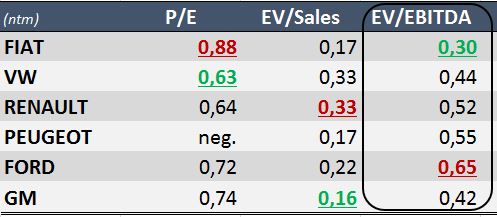
Nevertheless, we know that markets always look forward, thus “ntm” (i.e: next twelve months) multiples should provide a better assessment of prices. Let us look to the following table:

Source: Bloomberg, BSIC
A simple analysis of those multiples tells us the following: according to P/E, FIAT is trading at 15% premium to peers. This huge overpricing is counterbalanced by the discount highlighted by the other two multiples considered. Is it possible? In our opinion, the main evidence of that is related to the very low net profit margin of Fiat (1.5%) compared to an average of 5% for the industry. However, taking into account massive CapEx and economies of scale that are expected to stem from the 6 million car production target, we believe that the lower profitability is just a temporary issue.
After this traditional analysis, we tried to be more innovative, building the following table.
Source: Bloomberg, BSIC
The figures are a kind of relative multiples, i.e. the multiples of the shares relative to the multiples of the indexes they belong to. We considered Eurostoxx for European firms and S&P500 for American corporations. The rationale of this approach is the following: correlation matters, stocks (even global ones) are exposed to local turmoil, and pure multiples could be misleading in this context; so, assuming that an industry should trade at the same level relative to its “local” benchmark, this relative approach makes “international” comparison easier and more significant.
The results of the analysis are the following: P/E of FIAT is extremely high, while EV/Sales and EV/EBITDA seem more in line with reality. EV/Sales allows direct comparison in the sense that it is not influenced by accounting policies of firms; moreover, it seems that sales are the main indicator to set targets in the industry, but it does not reflect company’s profitability. That said, we decided to focus on EV/EBITDA, noticing a big relative discount of FIAT to competitors. In particular, considering the upcoming listing in New York, we believe that Ford will become the closest peer for the new FCA, implying that we are positive on the stock from a fundamental value standpoint.
Nonetheless, as we pointed out at the beginning of this part of the analysis, markets care about the future: FIAT stock price is discounting that growth targets will be achieved in full; otherwise, markets will start reconsidering their view on the stock.
Technical analysis
After providing a view regarding the trading multiples of FIAT, we try to give momentum to the analysis, using different technical indicators.
Immediately after the presentation of the new industrial plan (on May 6th), the stock has started to fall and it has reached a minimum at €7.06 on May 16th, touching the support level at €7.08. The last closing price (€7.15) is exactly at the same level of another minor support line, already tested on February 5th.

Source: Yahoo Finance, BSIC
Several widely used technical analysis tools indicate that we are now in an extreme situation. The price is definitely close to the lower Bollinger Band and also the Williams% R indicator, which reflects the level of the close relative to the highest high for a given look-back period (in this case 20 days), confirms the oversold signal, registering a -95.54% on Friday. Moreover, taking into consideration also the slope of the regression line on prices and the relative R-squared coefficient (at 20 days), the bullish signal is even stronger. Indeed, the first indicator reached the lowest level over 200 days at -0.10, while the R-squared coefficient is slightly higher than 0.80. Finally, the stock closed nearly to the 0.5 Fibonacci retracement (€7.12), which may turn out to be a strong support.
Even though all technical indicators we mentioned provide a buy signal, the situation is not so straightforward. Indeed, the stochastic momentum index is far away from a turning point suggesting that the bearish trend might continue for other days.
Looking at the situation also from a wider point of view, some equity indexes have recently reached their historical maxima, and the bullish sentiment may fade quickly. Moreover, the European election may shock markets if unexpected results will turn out.
Therefore, if it were a more relaxing situation, the bullish sentiment on the stock would have definitely overcome the bearish one. Nevertheless, since volatility has increased in the last trading days, and more uncertainty may be on the way, the overall picture is not crystal-clear: the general market trend would be likely to affect also Fiat.
That said, however, not being discouraged by a high level of risk, we would entry the stock taking a long position; close stop losses and take profits will play an important role to avoid displeasing consequences.
[edmc id=1747]Download as pdf[/edmc]


0 Comments