The aim of this article is to analyse the popular Fed Model, pointing out its strengths as a descriptive tool but warning investors against its alleged predictive qualities. The Fed Model is a stock valuation approach introduced in the late 1990s. It asserts that the acceptable earnings yield (the inverse of the PE ratio) for the broad stock-market index is the prevailing 10-year government bond yield. From this rule of thumbs, it is possible to derive that when the earnings yield is below (above) the 10-year government bond yield, the stock market is supposed to be relatively overvalued (undervalued). Therefore, the fair value for the stock index should be equal to the earnings level divided by the 10-year government bond yield.
The idea of comparing “stock yields” with bond yields is an old one, but became popular after Alan Greenspan, chair of the Fed from 1987 to 2006, juxtaposed it in a 1997 congressional appearance. From that moment on, the aforementioned rule was named Fed Model, though it is not endorsed by the Federal Reserve. In this article, we will highlight that the Fed Model could be a genuine descriptive tool, as market data show its effectiveness in describing how investors actually go about setting the PE ratio. Unfortunately, the Fed Model is much more often used to give theoretical grounding to expensive equity valuations in periods of low-interest rates. From this perspective, we will show the shaky grounds on which the model is built and the many theoretical justifications against its relevance.
Common sense supports the Fed Model
As first step, we will quickly go over the main arguments supporting the Fed Model.
The first argument is the perfect substitutability of bonds and equities as investment products. Because of this, market participants constantly arbitrage the stock and bond markets. When new money has to be invested and interest rates are low, we expect this money into flow in the stock market. The opposite should be true when interest rates are high. The frequent bond-equity carry trades, in which investors take advantage of low interest rates to buy stocks on margin, provides evidence to the aforementioned argument. Due to bond-equity carry trades, the stock market benefits from a low-rate environment as portfolio managers incur low borrowing costs when buying shares. When interest rates rise, portfolio managers sell shares to cap their borrowing costs. As equities and bonds are competing assets, it makes sense to compare bond and stock yields, represented by the yield to maturity for bonds and the earnings yield for stocks.
The second argument is that the Fed Model can be derived from a simple dividend discount model. Textbook finance theory defines the price of a stock as the present value of its expected future cash-flows, represented by dividends, discounted with an appropriate cost of capital. We can split the cost of capital in its risk-free component (equivalent to the government bond yield) and the risk premium. In this simplified framework, decreasing (increasing) government bond yields imply a smaller (larger) discount factor, hence a higher (lower) stock price. Note that the Fed Model assumes that the other variables in the valuation formula are not affected by the modifications of the discount factor. We will show later that this is a fundamental pitfall of the Fed Model, because the risk premium and the expected nominal earnings growth rate are usually interrelated with bond yields.
The third argument is empirical. In the US, the Fed Model has been a successful tool in describing the dynamics of stock prices. The earnings yield of the S&P 500 has somewhat tracked the 10-year US Treasury yield for decades. Most notably, the model describes the rise in stock yields, along with inflation, during the 1970s and early 1980s, and the decline in stock yields in 1990s.
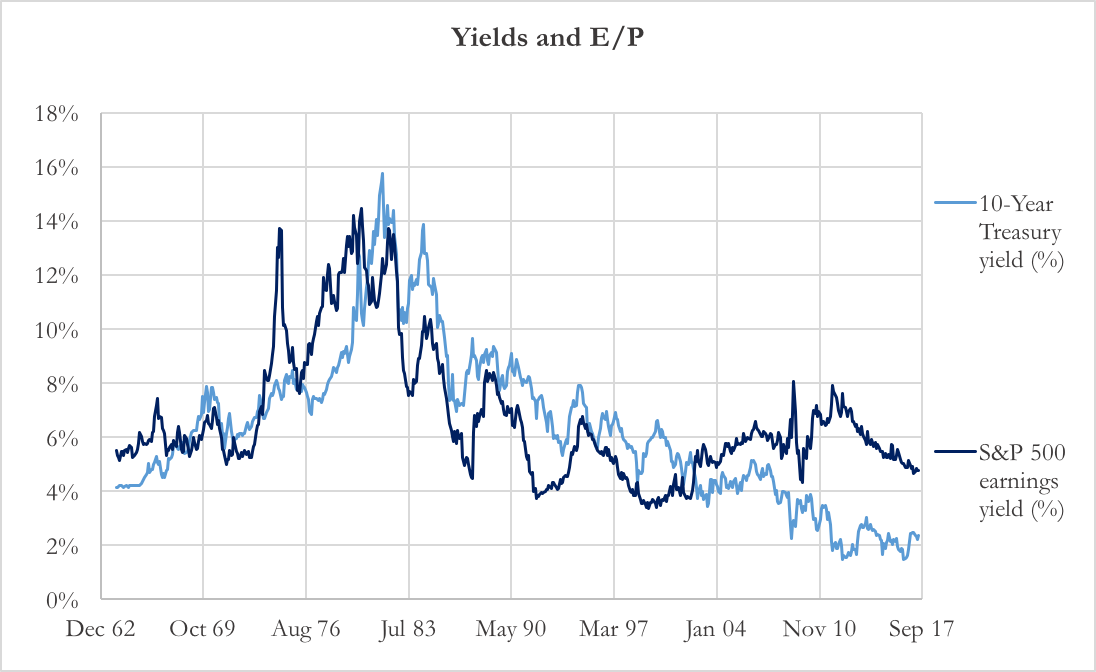
Chart 1: 10Y yield vs. E/P (Source of data: Bloomberg, Thomson Reuters)
The inflation illusion
Since its introduction in the late 1990s, there has been a growing criticism of this simplified valuation approach. Among the many arguments academics have made to prove its fallacy as a predictive model, the inflation illusion is by far the most famous and solid. The inflation illusion argument essentially states that the comparison of earnings yield and bond yield is erroneous because it compares a real number, the earnings yield, to a nominal one, the bond yield. The point is that long-term bond yields reflect inflation, while stock prices do not since nominal corporate earnings already do so. In order to explain the inflation illusion, we report below the Gordon Model formula rearranged to derive the expected stock return in nominal and real terms:
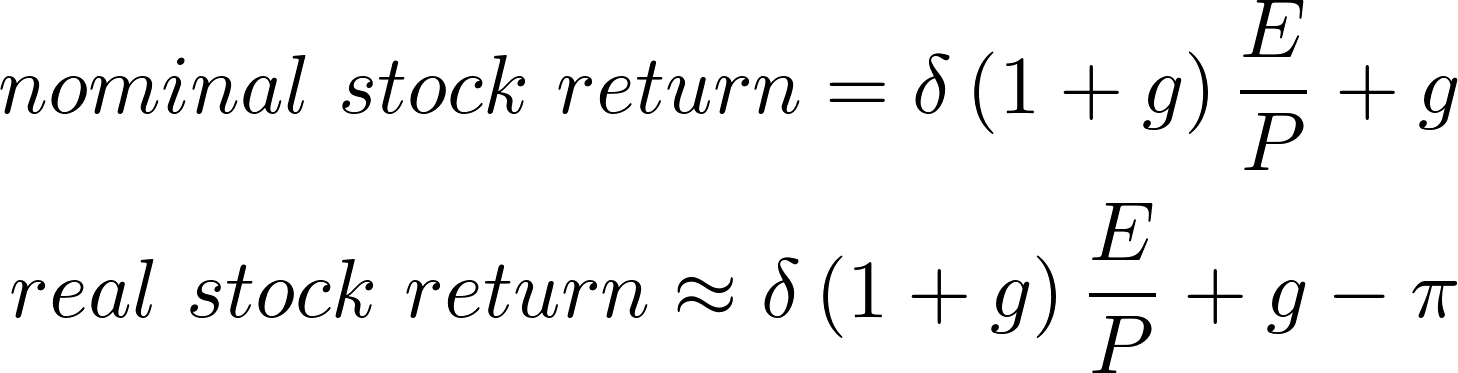
Where δ stands for the payout ratio, E for the present earnings, P for the current price, g for the expected nominal growth rate of earnings and π for expected inflation. The term g – π represents the expected real earnings growth rate. As the formula shows, real stock returns are a positive function of the earnings yield (or, equivalently, a negative function of the PE ratio) and expected real earnings growth rate.
Now, the weakness of the Fed Model is to overlook the effects of inflation, while inflation plays an important role in stock valuation. In order to prove this point, suppose investors expect falling future inflation. These expectations pull down bond yields. Using the simplified framework of the Fed Model, the decrease in bond yields should result in a one-to-one decrease in the earnings yield, thus leading to swelling valuations (larger PE ratio). However, the Fed Model ignores the effect of a lower expected inflation on the expected nominal earnings growth. Simple economic intuition shows that a falling inflation is likely to negatively affect corporate earnings. In fact, in a low inflation environment pricing power is low and profits grow more slowly in nominal terms. In other words, falling expected inflation drags down expected nominal earnings growth.
As we proved, inflation affects the bond yield, the earnings yield and the expected nominal earnings growth. This approach stresses that the expected nominal earnings growth and earnings yield are interrelated variables in the valuation formula. From this perspective, the Fed Model is fallacious because it states that inflation affects only one of the two variables (i.e. the earnings yield and not the expected nominal earnings growth rate). In order to investigate this relationship, we assume that inflation changes do not affect real stock returns, which remain constant. We will address to this assumption later, proving that it is well founded. The unchanged real stock return could be the effect of a fall in the expected nominal earnings growth rate that offsets the fall in inflation. Therefore, higher stock prices and swelling valuations are not warranted by low yields.
If this seems counter-intuitive, consider that one of the tried-and-true reasons to own equities is the belief that stocks are a good long-term inflation hedge. This belief is equivalent to stating that the expected real stock return is constant, which was our previous assumption. As it is proved that stocks are a good inflation hedge (see Boudoukh and Richardson [1993]), then our assumption concerning a constant expected real return for stocks is consistent. If stocks are a good inflation hedge it is precisely because the nominal earnings of companies tend to rise with nominal inflation, de facto making stocks a real asset. Anyone who believes in the Fed Model but also believes stocks are a good hedge for long-term inflation is inconsistent, as we have just proved.
Changing risk-premium
Though market data seem to support the Fed Model, a careful analysis calls into question this cornerstone of Fed Model enthusiasts. While the Fed Model perfectly describes the relationship between bond yields and stock-market valuations in the 1965-2001 period (i.e. the same period in which the model became popular among investors), its performance is disappointing if we consider a longer time span. In fact, the correlation between the earnings yield of the S&P 500 and the 10-year US Treasury yield was an impressive +0.81 for the 1965-2001 period, while it was a mild +0.18 for the 1926-2001 period.
These empirical data show an inconsistency of the Fed Model. We argue that this inconstancy is probably due to the extreme simplicity of the model itself, which, beyond ignoring inflation, overlooks investors’ risk appetite too. In other words, the Fed Model does not consider a crucial variable: investors’ perception of risk changes over time, affecting risk premia. One important assumption of the Fed Model is that bonds and equities are perfectly substitutable, so that investors can compare their yields. However, this may not be the case as, in certain periods, investors may perceive stocks to be riskier than bonds and thus demand a higher risk premium.
In order to investigate investors’ risk perceptions, we look at the correlation between bond yields and equities. The Fed Model implies a negative correlation between the two, since lower yields correspond to swelling valuations and vice versa. The graph reported below shows that the negative correlation between equities and yields holds until 1999. From that moment on, equities and bond yields show a positive correlation.
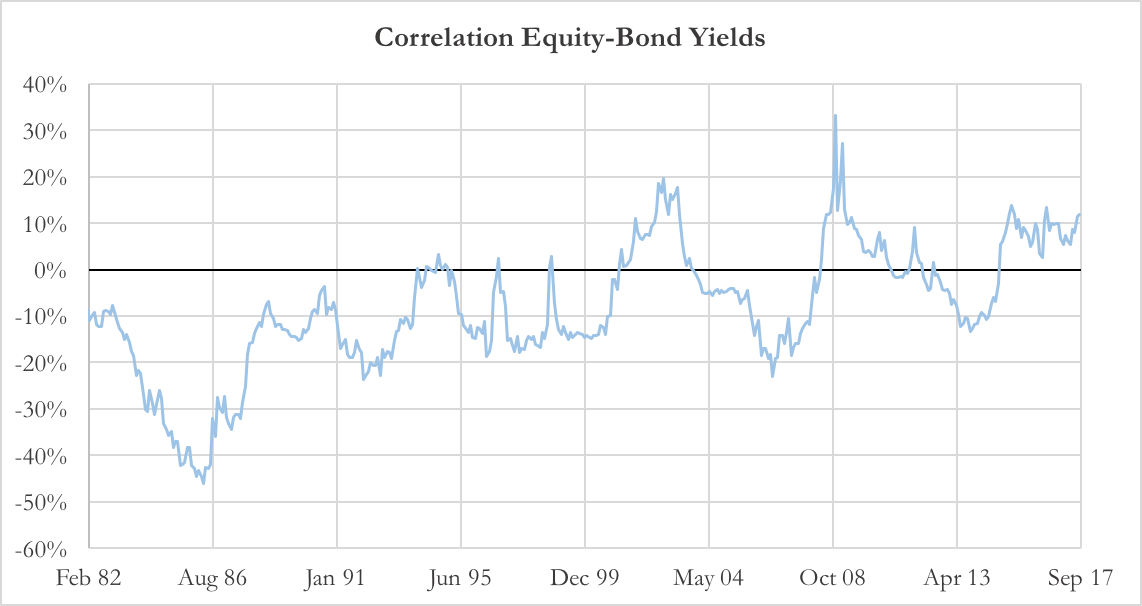
Chart 2: Correlation between Equity and Bond yields (Source of data: Bloomberg, Thomson Reuters)
We can explain this phenomenon with changing risk premium. Before 1999, investors considered bond and equities as competing assets. The trend has changed during the Tech Bubble as investors began dumping overvalued stocks, piling into Treasury bonds. The rational was that investors perceived stocks as risky while US Treasuries were regarded as safe-heaven assets. If bonds are considered safe-heavens, then the Fed Model does not hold anymore. In fact, investors do not regard bonds and equities as comparable assets, but apply risk-on/risk-off strategies. When investors increase risk exposure, they sell government debt, and invest the proceeds in equities. Reducing risk exposure involves selling risky assets and buying Treasuries (flight to quality). This risk-on/risk-off asset allocation approach has caused a positive correlation between equities and interest rates over the past years and especially in periods of high risk.
Enhancing the Fed Model
In this last section, we enhance the Fed Model, showing that it may have a robust descriptive power if investors’ changing perceptions on stocks and bonds risk are taken into account. We start from a base Fed Model according to which the earnings yield only depends on the long-term bond yield (E/P = a + bY). We then consider an advanced version of it, which also considers as inputs the 10-year historical volatility of bonds and equities. We use the 10-year historical volatility as a proxy of investors’ perceived risk on stocks and bonds. The enhanced Fed Model is the following:
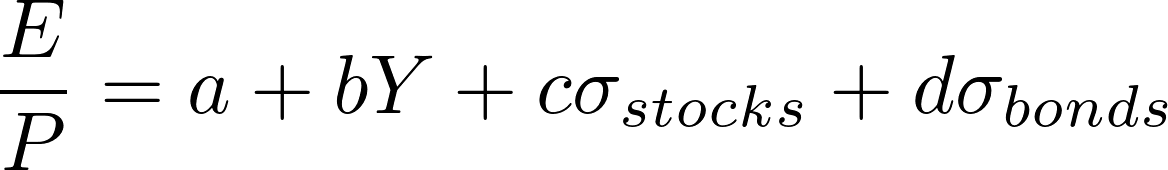
Where a, b, c and d are regression coefficients. We run the regression on the 1974-2017 period obtaining the following coefficients estimates:
| Coefficient | Stat t | p-value | |
| a | -0.036 | -7.14 | 3.06 E-12 |
| b | 0.602 | 20.85 | 1.35 E-70 |
| c | 0.384 | 16.00 | 3.93 E-47 |
| d | -0.094 | -9.14 | 1.45 E-18 |
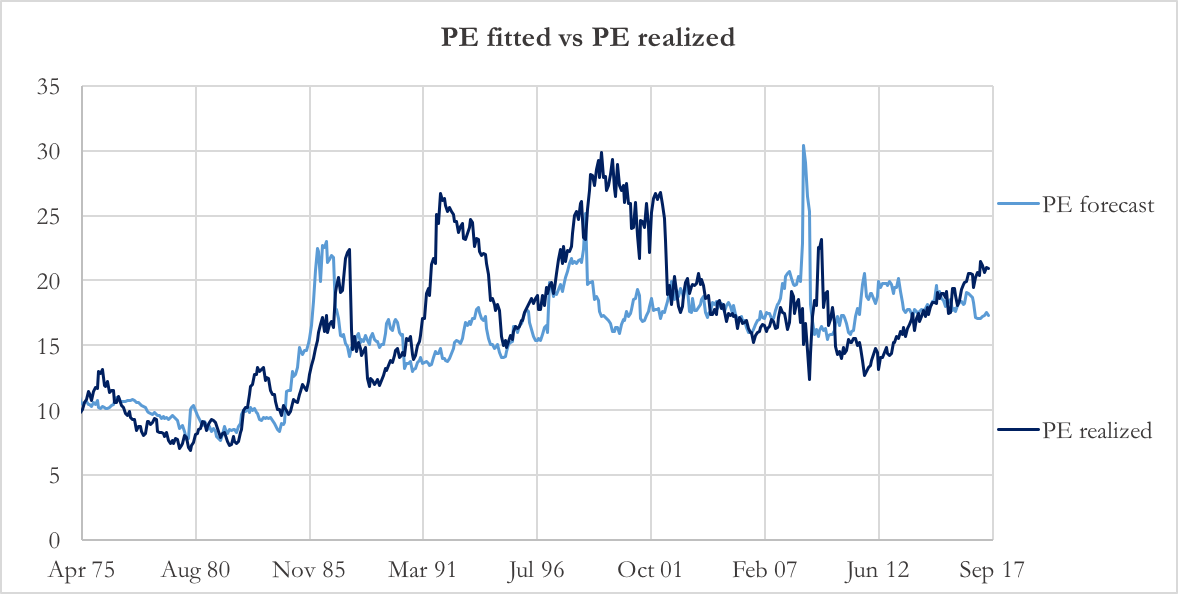
Chart 3: Fitted P/E vs. realized P/E (Source of data: Bloomberg, Thomson Reuters)
The enhanced Fed Model has two strengths. The first is its superior in-sample performance if compared with the basic Fed Model: over the same period (1974-2017) the enhanced Fed Model has an adjusted R^2 of 0.64 while the basic Fed Model has an R^2 of 0.30. Note that we are using the adjusted R^2 to assess the performance of the enhanced Fed Model in order to keep into account the larger number of independent variables considered. The second strength of the enhanced Fed Model is the meaningful signs of the coefficients c and d. With c positive and d negative, it means that the weighted difference of stocks and bonds volatility is relevant to the level of the earnings yield. In other words, investors set the earnings yield as a function of bond yields (the coefficient b is indeed positive), but they also require a higher earnings yield versus the bond yield when they have experienced more volatility in stocks as compared to bonds. Chart 3 plots the actual PE ratio of the S&P 500 and the forecasted PE ratio using the enhanced Fed Model. Though we built the enhanced Fed Model only for descriptive purposes, we could point out that the forecasted PE somewhat anticipates movements of the realized PE. Clear examples are the spikes in 1986, 1998 and 2008. Today, according to the enhanced Fed Model, the stock-market is slightly overvalued as the forecasted PE is 17.5 against a realized PE of 21.
Conclusions
To conclude, we would like to draw a line separating the descriptive function of the Fed Model from its allegedly predictive one. The Fed Model does work as a descriptive tool for how investors choose to set the current stock-market PE ratio, especially if we adjust for bond and stock volatility. The descriptive function of the Fed Model alludes to the observation that, historically, when interest rates or inflation are low, the stock market’s earnings yield is low too. From this perspective, the Fed Model recognizes a strange pattern of investors: investors appear to adjust the discount rate to value stocks to match the prevailing nominal interest rate. However, they are caught by an inflation illusion as they seem to ignore the effect of inflation on the nominal earnings growth rate. On the other hand, using the Fed Model as a predictive tool is a logical abuse: it assumes that as earnings yield and government bond yields showed a positive correlation in the past, so they should do it in the future.
Download the PDF of this article


0 Comments