[edmc id= 3236]Download here the Ferrari Pitch[/edmc]
After having covered the IPO of Ferrari (https://bsic.it/wanna-flawless-ferrari-52-now-feasible/) in detail a couple of weeks ago, we are now trying to identify RACE’s market positioning in terms of multiples. The structure of the analysis is as follows: firstly, we plot Ferrari’s positioning against major automakers and luxury brands in terms of fundamental business metrics; secondly, we analyse its market multiples; finally, we make some sensitivity analysis to give flexibility to our assumptions.
Ferrari (RACE) is an ultra-luxury carmaker, and, as such, cannot be compared to massive automotive stocks. The factors to which it appears exposed are far closer to luxury players. For example, as reported in the IPO prospectus, Ferrari sales are not really cyclical: this feature is common to luxury brands, whose stocks are classified as anti-cyclical usually. Still, we believe that some market players may perceive it to be part of the automotive industry (RACE market history is too short to make any correlation analysis though). Therefore, a comprehensive research requires us to consider both sectors.

Source: BSIC (raw data from Bloomberg)
Car conglomerates are usually bigger in size than luxury players, but grow at a slower rate. In this context, Ferrari’s size is similar to the one of an average luxury company, while its growth rate is rather conservative due to exclusivity. Exclusivity that looks like a dilemma for the Maranello-based company: they are willing to produce up to 9,000 cars per year by 2019 (7,255 vehicles produced in 2014), thus markets expect some growth. Nevertheless, what about the subsequent period? Will the company succumb to investors’ pressure and go beyond that quantity, or will it remain highly exclusive? Some argue that, as the number of HNWI grows, Ferrari production can expand as well. On the other side, as WSJ reported (http://www.wsj.com/articles/ferrari-ipo-why-this-engine-runs-too-rich-1445324982), it seems that the Italian company would lose some “benefits” in the US if it exceeds the 10,000 cars per year threshold.
In any case, Ferrari size/growth positioning does not seem anything special, and we feel comfortable in stating that it can be compared to average luxury players. Expanding our scope, we could also state that its revenue breakdown is partly consistent with such a framework.
Moving to market multiples, the most difficult part of the research was to find a uniform way of classifying automotive and luxury stocks together. To pursue this goal, we decided to run a regression analysis of the type: market multiples against profitability measures.
Although measures like P/E or EV/EBITDA give better results on a single sector basis, we found that the best-fitted inter-sector relationship is described by a linear regression of NTM EV/Sales-to-growth plotted against the expected EBITDA margin. Given the very varied growth rates highlighted before, it was necessary to adjust the raw EV/Sales multiple to account for such a difference.

Source: BSIC (raw data from Bloomberg)
By looking at the chart, the first interesting point to highlight is that all carmakers are situated in the bottom-left area, while luxury stocks are towards the right. This means that the latter are characterised by higher margins, thus can trade at higher multiples.
After that, more important, RACE appears extremely overvalued according to the study: although it trades at lower multiples than Hermes, its expected figures are not enough to bear such a value.
At this point, it seems useful to focus a bit more on the assumptions we made with regard to Ferrari. Assuming a linear growth of car units sold until 2019 (thus reaching 9,000 units, with a CAGR of 4.4%), we project revenues to grow at a CAGR of 4.5% in 2016, 2017. Therefore, this implies only a small improvement of the revenue composition, as we believe that it would be difficult for the company to increase vehicles sold without losing some pricing power. We take the company guidance as a reference for 2015. Moving to margins, our standard scenario keeps EBITDA margin stable at 27% (thus pointing to a growth compared to the expected 26.1% of the guidance figures). Under these forecasts, the assessment points to an overvaluation of around 50% (on the enterprise value)!
Nonetheless, bearing in mind that valuation is more an art than a science, we decided to allow for some flexibility in the model.
First of all, if we assume that part of the hefty price is justified by its prestige and heritage, we can account for an intrinsic premium. Considering that Hermes has had similar reputation on the market (it is usually indicated as the true representation of luxury on financial markets), it is possible to disregard the same percentage of overvaluation that the French brand shows according to our regression analysis (roughly 35%). Nonetheless, RACE still looks overestimated.
Hence, the second step of our elastic approach implies performing some sensitivity analysis on the two main metrics that we have employed, i.e. margins and revenue growth.
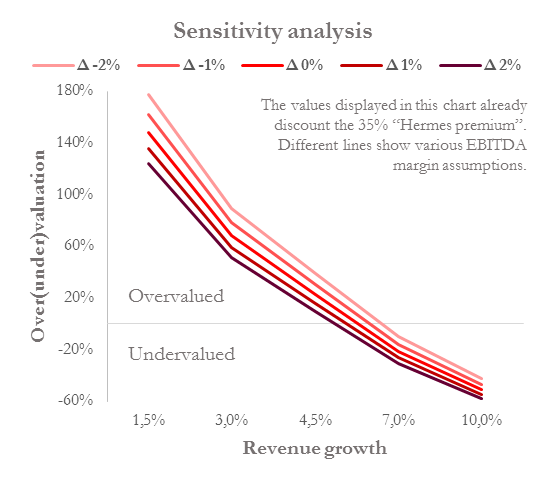
Source: BSIC (raw data from Bloomberg)
As reported in the chart, however, unless top-line growth and margins will outperform significantly, it seems difficult to accept such a high stock price. Indeed, a simple improvement on margins (we stressed it up to +2%) would not be enough for the price to reach the equilibrium point (and remember that we are already including the “Hermes premium” effect). On the revenue side (leaving margins unchanged), we would need the prancing horse to grow at a CAGR of slightly more than 5.5% to erase the overpricing: is this possible? Well, we do not want to exclude it ex-ante, as it may be achieved by keeping the same expected number of cars produced, thus focusing on models that are more expensive (or simply by increasing vehicle prices, while royalties business is unlike to give such an incremental contribution alone). However, we should also start questioning about the post-2019 then, so we cannot account for a seamless growth.
If some prefer to rely on historical data, it can be stressed that revenues grew with an 11.4% CAGR in the period 2012-2014. With such a massive growth, Ferrari stock price would even be underestimated by the market currently. Nevertheless, several aspects (among which 2015 revenue guidance and what stated before about the trade-off between units sold and pricing power) suggest that a similar progression is not feasible: that kind of backward-looking estimate must be overlooked.
In conclusion, with stock price above USD 50 currently, RACE looks at least as expensive as the four-wheel jewels that Ferrari produces. Part of the overpricing could be accepted as an intrinsic premium, which we believe will remain robust in the future as well. The remaining portion appears difficult to justify right now. We do not see any upside on the stock at the moment, and we believe that investors will prefer something different in the months to come. Once the post-IPO effect will disappear, the focus will move to the next quarterly results, which will help clarify the actual potential of the company (and the stock). In addition, of course, much will depend on the number of stocks that will reach the market in 2016: the more Ferrari shares allowed to free-float on the market, the lower its appeal of being rare. The stock is not attractive from a value standpoint, but we do not see any very short-term catalysts that could make a short selling profitable now.
[edmc id= 3201]Download as PDF[/edmc]


0 Comments