Introduction
Firstly, we briefly present H&M business. Secondly, we provide a report of recently announced Q1 2017 results. Thirdly, we perform a DCF and multiples valuation to find a target price for H&M, in line with recently announced results. Finally, we will explore a strategy to profit from our analysis.
H&M: business snapshot
Hennes & Mauritz AB (H&M) (Bloomberg: HMB SS / NASDAQ Stockholm: HMb) (Friday 7th April closing price of SEK 218.30, market cap of SEK 361.302bn, 1,655.072m shares[1], no minorities) is a Swedish fashion retailer with operations all over the world which designs and retails clothing for women, men, teens and children. The company sells a variety of trendy, sporty, and classic garments in addition to accessories such as jewelry, bags, and scarves, and cosmetics. It designs cheap yet chic clothing, mainly for men and women ages 18 to 45, children’s apparel, and its own brands of cosmetics. Analysing briefly the value chain, H&M designs and sells the collections but it outsources manufacturing to independent external suppliers. H&M’s first store was opened in 1947. Now, it employs more than 161,000 people all around the world. H&M focuses a lot on employing a sustainable business model, using 43% of recycled cotton in FY 2016 and having a 100% target within FY 2020, as part of its project to build a circular value chain with minimized waste.
H&M sells through its stores and via its website. As of Q1 2017, H&M has 4,393 stores in 64 markets and e-commerce in 35 H&M markets. During FY 2016[2], H&M continued its strategy of expanding its physical presence by opening 427 new stores worldwide: 7 in the Nordic Region (Sweden, Norway, Denmark and Finland), 71 in the Eurozone (Germany, France, Italy, Spain, Netherlands, Austria, Belgium, Greece, Portugal, Ireland, Slovakia, Slovenia, Luxembourg, Estonia and Latvia), 32 franchise stores and 317 in the rest of the world (RoW) (with main focus on China, with net openings of 91 stores, USA, net openings of 53 stores and UK an Russia, both with 17 net openings). This trend kept on during Q1 2017, with 42 net openings worldwide, mainly driven by 50 net openings in franchise and RoW (16 in the USA, 11 in China and 5 in Russia). This expansion trend has been contrasted by 8 stores closed in the European region, especially 4 in Sweden, 4 in Germany and 3 in France.

Chart 1: Evolution of H&M stores, 2012-LTM (source of chart data: Bloomberg, company data, BSIC)
We can see that in the last 5 years, H&M followed a clear strategy of international expansion in extra-European countries, with the main objective of tapping emerging markets’ growth potential for what concerns the clothing market and to establish a stronger presence in the USA. As we see from Chart 1, in a 5 year time there was almost no net expansion in terms of stores in the Nordic region, proof of the fact that that market is mature. In the Eurozone, the highest net openings have been in Italy (+64), France (+53) and Germany (+49). Overall, during the last 5 years the number of brick and mortar stores has been growing at 9.4% CAGR (from 2,776 in 2012 to 4,393 LTM). This investment has been accompanied by a growth in the number of employees at a 9.65% CAGR.
In Q1 2017, reported on March 29th, H&M registered[3]:
- LTM sales of SEK 195,561m (5-year CAGR 10.01%, YoY growth 6.12%)
- LTM gross profit of SEK 107,944m (5-year CAGR 8.43%, YoY growth 4.14%, GPM[4]20%)
- LTM EBITDA of SEK 31,604m (5-year CAGR 4.65%, YoY growth -1.96%, EBITDA margin 16.16%)
- LTM EBIT of SEK 23,712m (5-year CAGR 2.11%, YoY growth -7.28%, OPM[5]13%)
- LTM net income of SEK 18,495m (5-year CAGR 2.20%, YoY growth -6.73%, NPM[6]46%)
The company operates through 7 brands: H&M, H&M Home (which are aggregated for reporting purposes), COS, Monki, Weekday, & Other Stories and Cheap Monday. Furthermore, as hinted by CEO Karl-Johan Persson, the 8th brand Arket will open in autumn 2017. Chart 2 shows the number of stores split by brand.
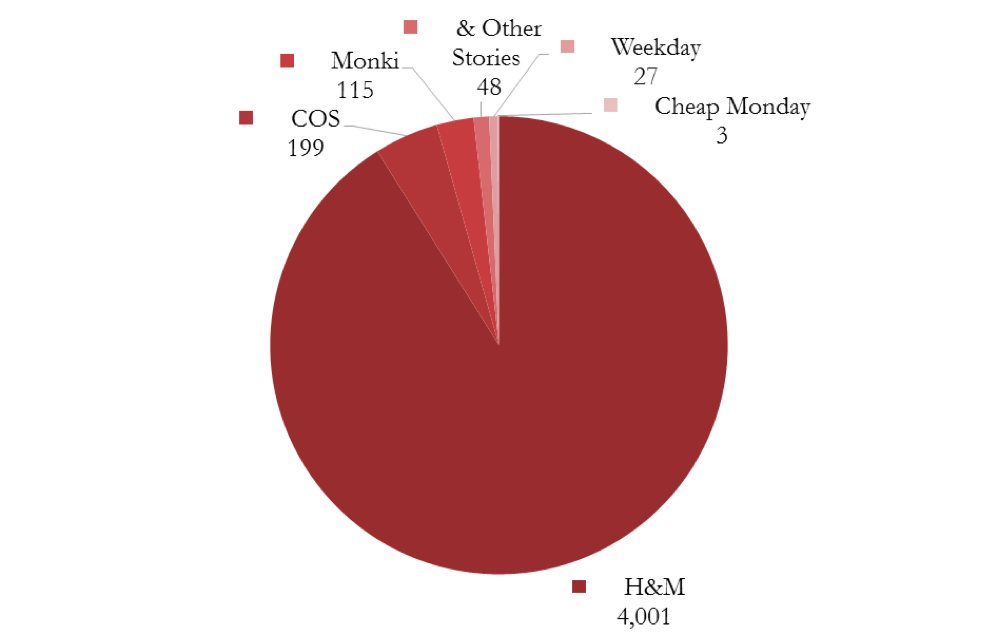
Chart 2: Number of stores by brand, Q1 2017 (source of chart data: Bloomberg, company data, BSIC)
Chart 3 below shows the split of sales by region and the average sales per store for each region.
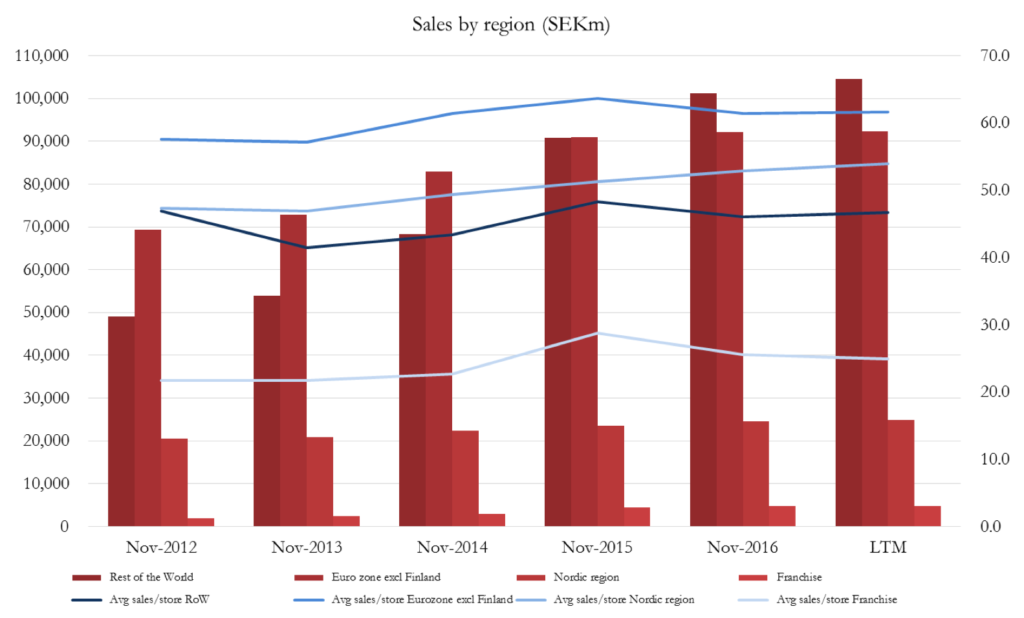
Chart 3: Sales by region and average sales per store, 2012-LTM (source of chart data: Bloomberg, company data, BSIC)
RoW has surpassed Eurozone as the main revenues source during the last 5 years. Furthermore, we can see how Eurozone and the Nordic region maintain their primacy in terms of average sales per store. In terms of revenues, the top 5 markets are Germany (16.31% of LTM sales incl. VAT), USA (12.05% of LTM sales incl. VAT), UK (6.58% of LTM sales incl. VAT), France (6.05% of LTM sales incl. VAT), and China (4.99% of LTM sales incl. VAT), for a total of 45.98%.
For what concerns the financial position of H&M, it is a very safe company, with negative net debt of SEK -6,579m (LTM). The components are: SEK 9,446m cash and equivalents; SEK 2000m of ST interest bearing debt issued to Nordic lenders (bearing a rate of -0.15% to -0.10%); SEK 68m ST issued to non-nordic lenders (9% average rate); SEK 59m ST financial lease debt (0.28% to 0.53% rate); SEK 213m LT financial lease (3% rate), SEK 527m LT pension liabilities.
The profitability of the company has slowly deteriorated in terms of margins during the past 5 years.
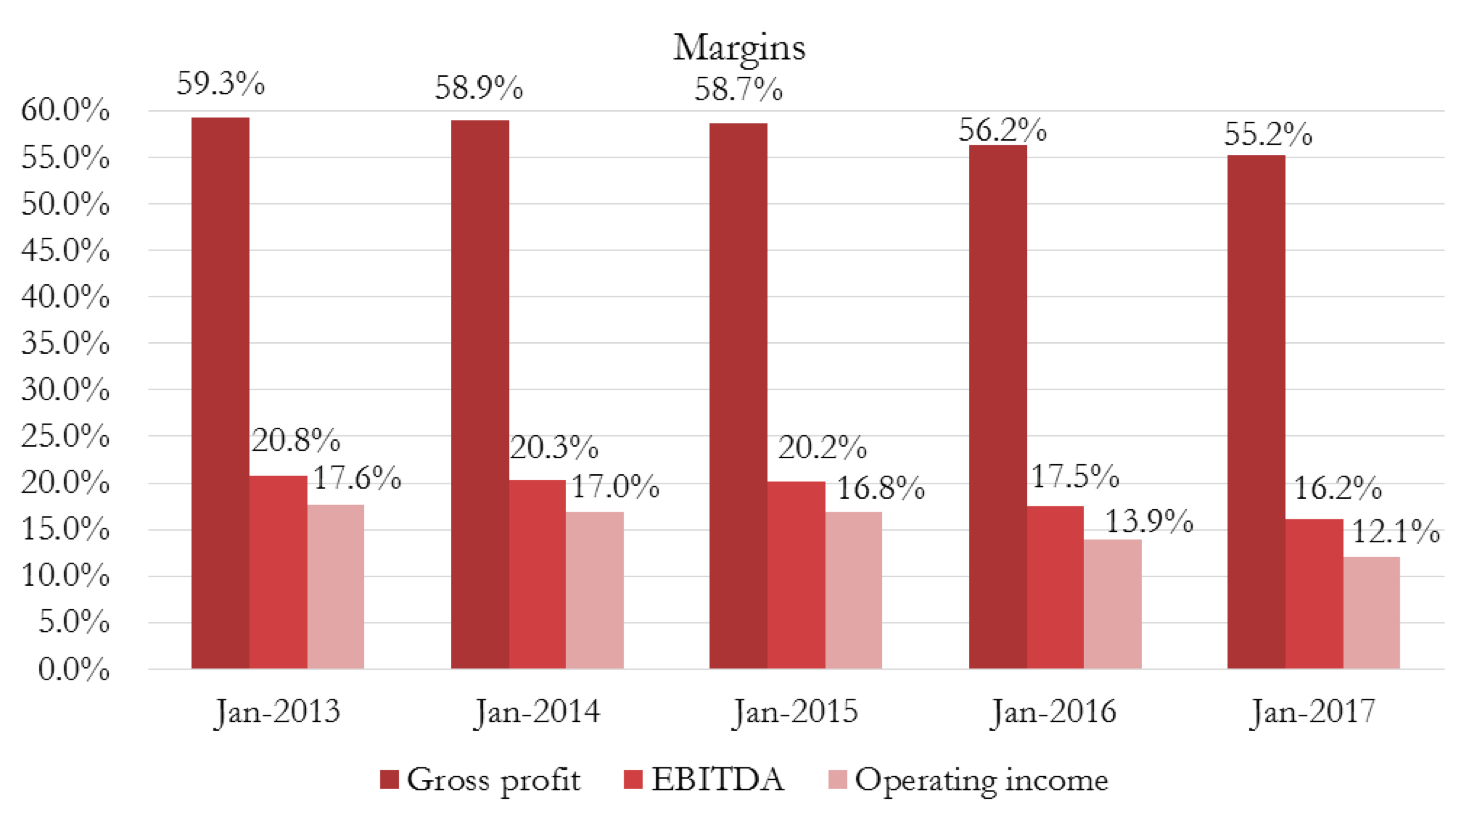
Chart 4: Key profitability margins, LTM, 5-year trailing period Feb-Feb (source of chart data: Bloomberg, company data, BSIC)
H&M and Q1 2017: beating expectations but falling in price
On March 29th 2017, H&M reported its Q1 2017, delivering above-consensus results. The outperformance was mainly driven by an upbeat tone in GPM (52.1% vs consensus of 50/51%). However, the trading update for March 2017 was sour. The most alarming message has concerned record high inventory levels. This has sent the stock plunging after an initial rally, as we can see looking at Chart 5 below.
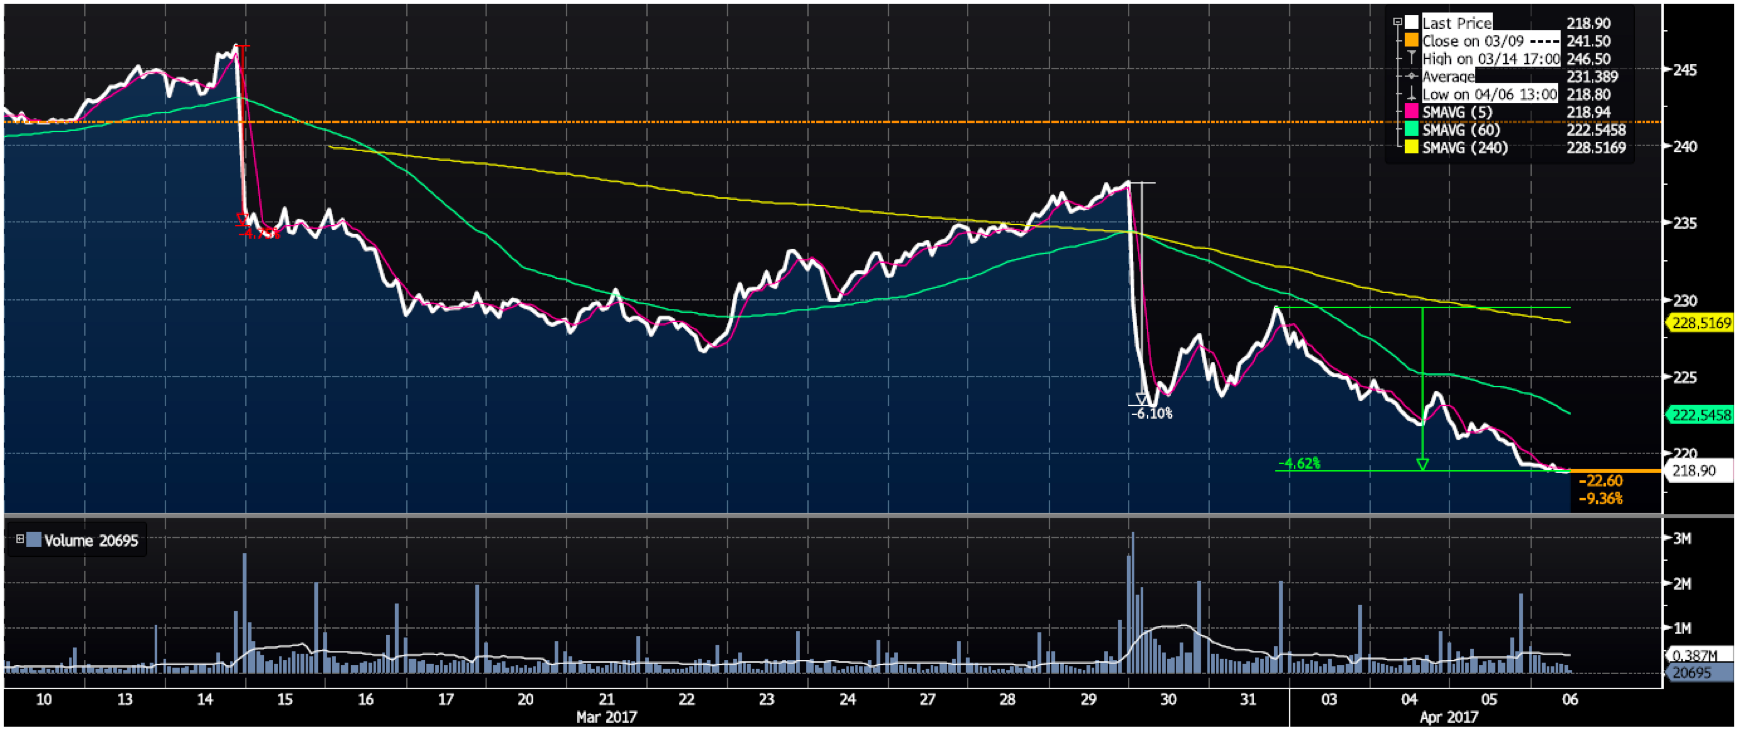
Chart 5: H&M 1-month stock price (source: Bloomberg)
The initial news regarding higher-than-expected GPM sent the stock higher by around 3%. This marginal improvement has been mainly driven by lower-than-expected inventory markdowns. This of course helped the GPM and, consequently, also sustained the EBIT above expectations: actual reading of SEK 3159m vs estimate of ca. SEK 2800m – SEK 2900m. However, we followed the minutes of the conference call as soon as they were out and we spotted the big issue of rising inventories (Chart 6).

Chart 6: H&M inventory data (source: company data, BSIC)
The lower-than-expected write down activity in inventories was also accompanied by a slower than expected growth in the top line[7]. Inventories grew 30% YoY in Q1 2017 and, if we take out FX effects, at 28%. YoY sales were up at constant FX 7.54% in Q1 2017, which is well below the 10%-15% target in local currency. This despite the fact that last year Easter holiday was annualized during Q1 2017 (when stores are usually closed and so sales naturally decrease).
Hence, bringing back inventories at historical levels would probably require either the long-delayed write-downs or selling items at a price discount to decrease the warehoused clothing. Both actions would imply a downward pressure on gross margins and, hence, a negative adjustment to bottom-line profitability.
Given this premise, we decide to value the stock, having in mind a negative environment in the short-term, but with a possible value proposition for the longer-term, given the currently depressed stock price.
H&M DCF and Relative Valuation: the bear appears
We will value the stock from an enterprise perspective, using FCFO and WACC.
We start by projecting average sales per store, keeping into account both like-for-like growth and FX effects. In the last 5 periods (February to February, to account for the recently released Q1 data), global H&M sales per store increased at 1% per year, but declining 4.1% in LTM. For the period Feb 17 – Feb 18, we project a 0.5% like-for-like growth in average sales per store and a negative -1% effect coming from FX effects. In particular, we are concerned about a string USD for purchasing raw materials. This is more bearish than estimates provided by two reference brokers (+1.6% and +1% combining like-for-like and FX effects).
Then we project growth in the number of stores. The average growth in the past 5 years has been 11.7%. For Feb 17 – Feb 18 we project a 9.5%. We stay on the downside, given the fact that Q1 already passed and there were many net openings as previously highlighted. This is more bullish than our reference broker estimates of +8.8% in FY 2017.
We then smooth our estimates for the period up until February 2027. Applying this forecast, we target SEK 213, 069m for Feb 17 – Feb 18 (YoY +9%).
We later assume a reduction in GPM, due to probable price promotions and / or the awaited write-downs. We project EBITDA margin at 16%. Capex have constantly increased over the last 5 years, reaching SEK 13,318m in Feb 16 – Feb 17, driven by increasing capitalized costs for IT infrastructure development aimed at establishing H&M as a successful online retailer (capex at 6.8% of comparable sales). We forecast for NTM 6.9% of sales. With respect to D&A, we forecast it at 62% of capex and 4.3% of sales, converging in terminal period to 100% of capex. This leads us to operating profit of SEK 24,976m (for an OPM of 11.7%, which will gradually converge to the average of peers towards 10%-11%).
Forecasting net working capital elements through their respective days indicators, we put particular attention to days inventories, given the aforementioned issue.
We assume an 8% WACC[8] and a 1.5% terminal growth rate. We obtain a EV of SEK 334,757m, implying a market cap of SEK 341,336m for a target price of SEK 206.24 per share (last price SEK 218.3, 5.52% discount).
We perform some sensitivity tests.

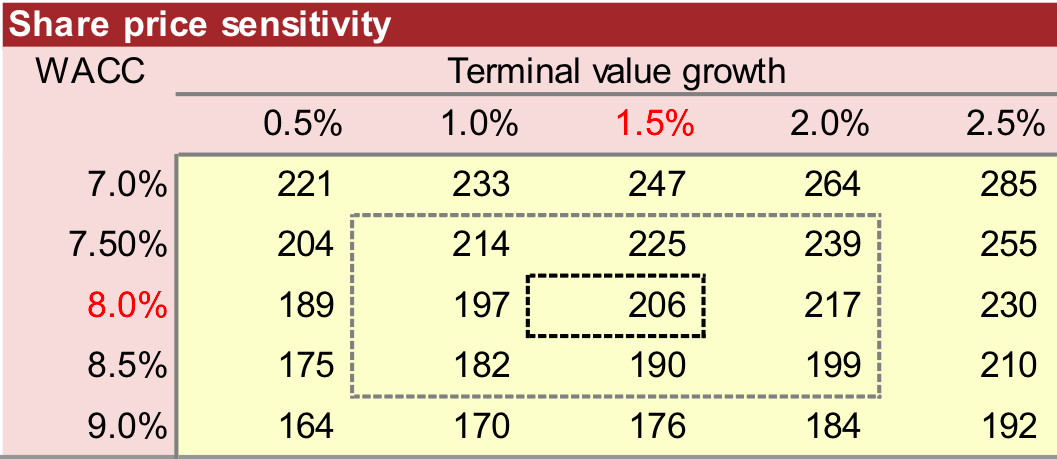
Tables 1-2: EV and target share price sensitivities (source of table data: Bloomberg, company data, BSIC estimates)
Finally, we validate our DCF with a quick multiples analysis.
We take as peers those selected through Bloomberg analytics for reasons of parsimony (Ted Baker Plc, Next Plc, OVS Spa, Brown (N) Group Plc, Industria De Diseno Textil, Sports Direct International, Supergroup Plc, Hugo Boss AG). While they are similar in terms of margins and business model, they are quite different in terms of leverage: this will affect our results, especially for what concerns P/E estimation.
The P/E method gives us 3 target share prices: SEK 216.48 (using LTM data), SEK 194.88 (using current year estimates) and SEK 199.21 (using NTM data).
EV/EBITDA gives us an EV of SEK 329,217m, consistent with a target share price of SEK 202.89.
Finally, EV/sales gives us an EV of SEK 329,413m, leading to a price of SEK 203.01.
Averaging all our results, we target a price of SEK 203.79, implying a further 7.1% downside relative to last closing price.
The bear has come.
H&M Strategy: profit from a downside with catalyst Q2 2017
Following our aforementioned DCF analysis, our view on H&M is bearish in the short term[9]. We use as catalyst for our bearish view the next quarterly earnings release on June 29th 2017. We take the view that the expected inventory write-downs / promotional activities will materialize, bringing negative pressure to gross profits and EPS in the bottom-line.
Of course, a simple and straightforward (and even more convenient from a profitability point of view, should our view materialize) way to implement our strategy would be that of short-selling the stock or selling futures on the stock (if available).
However, and mainly for didactical purposes, we will focus on an options strategy.
We want to implement a call bear spread, in order to take a directional delta negative view on the underlying H&M stock, while retaining a small vega exposure, limiting the upside but cashing in a positive premium now.
Considering that options available are standardized with fixed maturity on 15th of March, June, September and December, we have chosen the 15th of September as the expiration date of the two options composing the strategy (of course, the options are of the American type).
For options of different maturities, we also see characteristic differences in implied volatility. In this contest, the volatility term structure highlights this relationship between implied volatilities and time to expiration. We know that volatilities tend to follow a mean-reversion trend in the long run: if the current volatility is dramatically low, we expect a future increase, and therefore, the term structure will show a positive slope. Vice versa if the current implied volatility is very high. Usually the slope of the structure depends on the type of underlying asset. In case of stock options, it is related to the market’s implied impact of upcoming news. Therefore, in our case we expect high levels of implied volatility for the options with time to expiration right before the release of Q2 inventory data and lower levels for the following ones.
Before setting up the strategy we looked also at the implied volatility of options with different strike prices. A fast and effective way to do that is looking at the volatility smile chart: it represents the relationship between moneyness (or strike price) and implied volatility. Again, as the term structure, it depends on the type of underlying asset and, in the case of stock options, we’d better talk of “volatility skew” rather than “volatility smile”.

Volatility skew is typical of option with stock underlying assets: to give you an insight of why this happen, we should firstly recall the famous Black Scholes formula (for simplicity only for call option).
Where, as always:
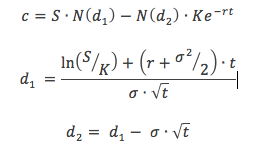
c= Call premium
S= current stock price
t= time until option exercise
K= strike price
r= risk free rate
N= cumulative standard normal distribution
= standard deviation
B&S formula assumes the probability distribution of the future stock prices to be log-normal. In general, this is not true, especially for stocks. As we can also see from the chart below, it’s well known that the distribution of stock returns has a marked prominence on the left tail.
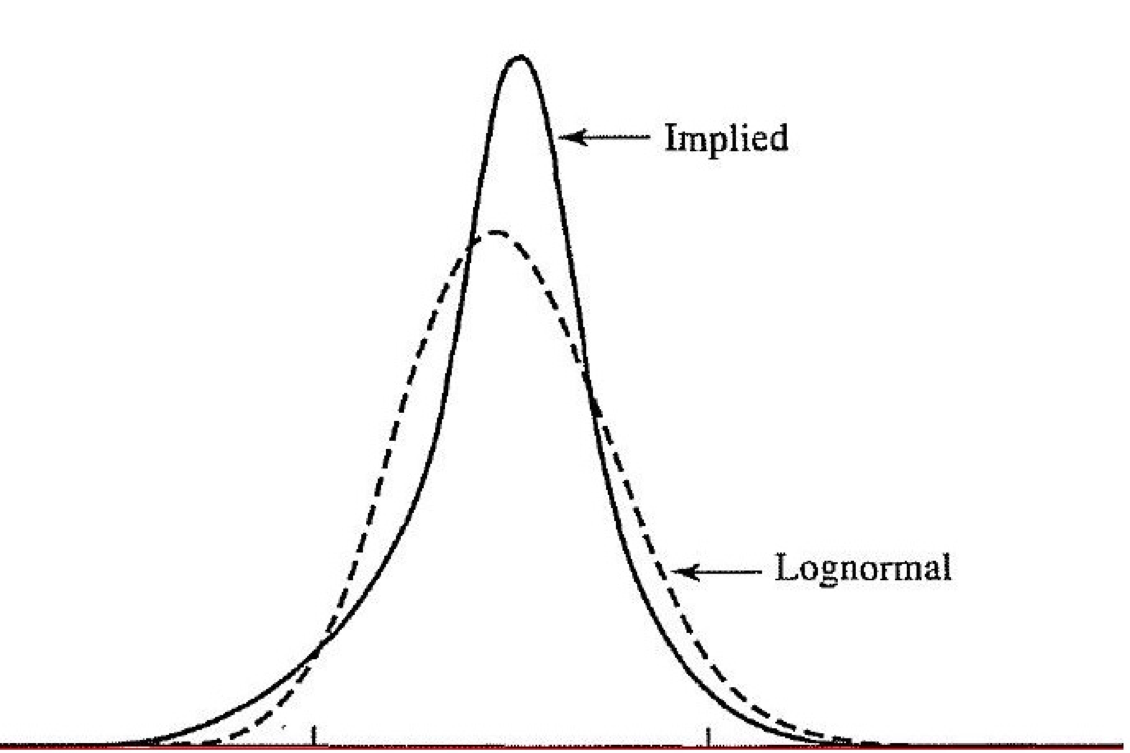
Therefore, the probability of extreme negative returns is higher than what forecasted from the Black&Scholes model. If we simply include this larger probability in the B&S formula (precisely in and ) it is quite straightforward that the implied volatility of the call increases. That’s why the “volatility smile” of stock option has usually a negative slope (thus, puts deep out of the money and calls deep in the money have higher implied volatility and vice versa).
Another naïve but popular explanation is based on leverage. If the stock value of a company decreases, the leverage will relatively increase, making the firm riskier. Vice versa, if the stock value of a company increases, the leverage will relatively decrease. Hence, we should expect that the volatility is a decreasing function of the price.
All in all, to collect both these information in one chart, we should recall the volatility surface graph: this is a three-dimensional graph that simultaneously shows both, volatility smile and term structure of volatility.
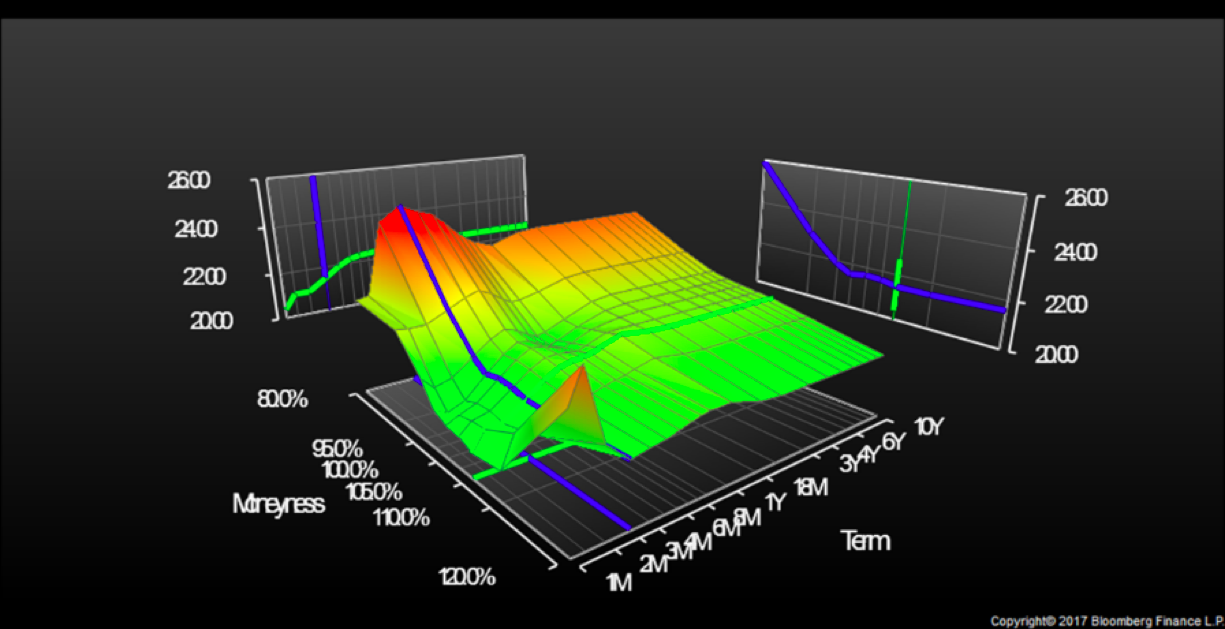
Chart 7: H&M options volatility surface (source of chart data: Bloomberg)
It is interesting to notice that the H&M stock options volatility surface in Chat 7, unlike what we have just explained, shows a “smile” shape (roughly) for the first two months, characteristic for currency underlying rather than for stocks underlying. This is actually in line with the uncertain period H&M is now facing: the implied probability of large squeezes before the release of Q2 inventory data are very high, in both directions, leading to an implied distribution with fat tails on both sides. Furthermore, as we can notice from the chart, approximately after the two-month maturity (hence after the data release) the term structure of implied volatility takes the usual skew form we described.
To sum up, given our analysis and considering the current levels of implied volatility, we implement our call bear spread with maturity September 15th 2017 (underlying price SEK 218.85 at time of strategy implementation). We decide to buy 5% OTM call (ask implied volatility 22.7) and sell 5% ITM call (bid implied volatility 22.122). The cost of the first leg is SEK 7.04 (3.216% of stock), while the premium received on the second leg is SEK 16.29 (7.445% of stock). The overall premium of the bear call spread is positive SEK 9.26, or 4.229% of the underlying price. The position will have a negative delta of -28.56, negative gamma of -0.4405 and roughly zero theta and vega.[10]

Chart 8: Profit and Loss bear call spread strategy at different dates (source of chart data: Bloomberg)
[1] 1,460,672,000 class B shares, listed and floating (1 vote per share) + 194,400,000 class A shares, non-listed (10 votes per share), with the founding Persson family holding 38.5% of total shares giving them 70.1% of voting rights.
[2] H&M FY ends at the end of November.
[3] LTM numbers based on BSIC estimates, sources of data Bloomberg, company data
[4] GPM = Gross Profit Margin
[5] OPM = Operating Profit Margin
[6] NPM = Net Profit Margin
[7] CEO Karl-Johan Persson recently changed the target from having 10%-15% increase in number of stores to 10%-15% increase in sales in local currency.
[8] Actually, given a levered adjusted beta of 0.92, a 10-year Swedish risk-free of 0.534% and an ERP for Sweden of 5.71%, we would get a cost of levered equity of 5.8% (equal to WACC given almost zero financial debt). However, we think that the company’s cash flows are riskier given that H&M derives the majority of its cash flows from outside Sweden. Hence, we decide to conservatively increase the WACC, in line with methodologies used by reference brokers.
[9] We acknowledge that with a long term horizon of e.g. 2-3 years the current low stock price might provide a convenient entry level, should the current concerns on stores expansion, pricing and inventory be likely addressed in the above mentioned longer horizon.
[10] Pricing through Bloomberg.


0 Comments