Introduction
What happens in option markets strongly influences the behavior of the underlying asset. In this article, we review the evidence and academic research on the dynamic relation between market makers’ gamma exposure and the price process of the underlying assets, specifically in terms of intraday volatility and autocorrelation.
In the absence of risk management, an option dealer profit profile is potentially very volatile and non-linear. To limit their market exposure, most dealers delta-hedge by selling shares of the underlying asset. The optimal number of shares to buy (sell), however, changes depending on the fluctuations of the underlying price. When the aggregate gamma imbalance of dealers is largely negative (positive), the overall intraday activity of financial intermediaries may be substantial and may add additional pressure to an initial move of the underlying asset, giving rise to intraday momentum (mean-reversion). In this article we focus on these “second order” transactions that strongly influence market movements, despite being detached from fundamentals.
We will discuss some of the studies that report the link between large aggregate dealers’ gamma imbalances and intraday momentum/reversal of stock returns, arising from the potential feedback effects of delta-hedging in derivative markets on the underlying market. This channel relies on limited liquidity of the underlying market (the effect is stronger for the least liquid underlying securities), but it is distinct from information and funding liquidity frictions. In addition to explaining intra-day autocorrelation of returns, the results help to explain both intra-day volatility and the magnitude of flash crash events.
A brief recap on Gamma
The delta of an option is defined as the first derivative of the option price with respect to the underlying price. At time t, delta-hedging an option portfolio requires buying or selling an amount of the underlying asset equal to −∆t. Since fluctuations in the underlying price change the value of the option’s delta, delta hedging strategies require a dynamic adjustment of the position on the underlying asset.
The Greek Gamma measures the rate of change of Delta given a change in the underlying asset, i.e. is a second derivative, and is proportional to the convexity of the value of the derivative security with respect to the underlying price. Both call and put options are convex, thus, a long portfolio of options implies a positive Gamma, which implies that the size of the delta-hedging position is positively related to the underlying price. On the other hand, a short portfolio of options implies a negative gamma, i.e. the size of the delta-hedging position is negatively related to the underlying price.
Financial institutions heavily rely on option markets to transfer some of the risk embedded in the contracts offered to their clients. The traded options market has become a solution of choice, due to their liquidity and limited counter-party risk. A large literature documents that in certain periods the book of financial intermediaries can be imbalanced. This would occur, for instance, when the aggregate demand of their customers contributes to a build-up of an excess demand for either puts or calls in a particular index or individual stock. We are interested in a measure of this imbalance (the gamma imbalance) at the day and asset-specific level.
Barbon and Buraschi (2021) assume that only broker-dealers and market makers are involved in delta-hedging. Then, the total delta hedgers’ inventory for a given option j on day t is computed as the difference in BrokerDealers Inventory and Customers Inventory for the option j. Since each option has a gamma which depends on its moneyness and time to expiration, they compute the gamma exposure of each specific call and put option on each trading day t. The aggregate hedgers’ Gamma exposures on stock j on day t is computed as the gamma-weighted sum of inventories across the options written on that stock.
Two channels drive the time-variation in Gamma. The first one is due to a quantity effect: the portfolio decision of institutional and retail investors to buy/sell options and the willingness of option dealers to accept the trade. The second one is due to a price effect: the endogenous impact on Gamma induced by a variation in the price of the underlying asset. This second effect depends on the entire distribution of the moneyness and maturities of the call and put options held in dealers’ book; intraday shocks to the underlying price have immediate implications on the aggregate Gamma.

Source: perfiliev.co.uk
The figure above refers to SPX options and is useful to understand individual and aggregate gamma behaviors. It displays an approximate amount of dealer hedging flows across index levels (only for options expiring on Feb 18th). It illustrates that dealers are short gamma to the left and long gamma to the right with the presence of a flipping point.
When dealers’ gamma is positive (negative), their delta increases (drops) when the underlying asset increases. Thus, their delta-hedging strategy requires selling (buying) more of the underlying asset following an increase in the underlying price. Therefore, dealers order-flow acts as a contrarian (reinforcing) force, thus limiting (strengthening) the magnitude of initial price movements.
As a reference, if the imbalance on a single stock is due to short OTM put options positions, intermediaries can limit their market exposure by delta-hedging with short positions in the stock. Suppose the price starts dropping sharply, driving a large amount of put options closer to being ATM. Thus, to maintain a constant delta exposure, intermediaries should increase their short positions by selling more stocks. As the stock price continues to fall throughout the rest of the trading day, delta-hedging would induce dealers to increase even further their short positions, creating a further spiral. The effect is particularly strong during the last 30 minutes of the trading day when we observe a significant rise in trading volume.
It follows that when the aggregate gamma imbalance is large and negative, one should observe larger market volatility and short-term momentum (positive serial autocorrelation). On the other hand, when the gamma imbalance is positive, one should observe lower than average volatility and short-term mean reversion (negative serial autocorrelation). Notice that this specific effect is independent of the presence of information frictions, such as order flow toxicity, and of the additional role played by economic frictions such as margin constraints. It does, however, require that the market is not infinitely liquid to absorb intraday market makers demand shocks. This suggests an additional testable implication: the effect should be stronger for less liquid stocks.
The following findings support the thesis described above.
Key findings: Gamma imbalance and intraday market Volatility
The analysis conducted by Barbon and Buraschi (2021) proves that Gamma Imbalance helps to explain intraday market volatility despite the many reasons why someone may expect the opposite. Among the others: (i) dealers may be less risk-averse than commonly perceived and less interested in aggressively hedging their delta imbalances; (ii) the underlying asset market could be sufficiently liquid and frictionless so that dealers’ delta hedging strategies have no price or volatility impact; (iii) dealers could be extremely rational and technologically sophisticated to be able to implement hedging strategies with no aggregate price impact; (iv) while this channel might be realistic, it might not be sufficiently strong to dominate other equally important channels.
To test this hypothesis the authors run a panel regression of absolute returns on stock j conditional on the aggregate gamma imbalance of option dealers for security j at time t – 1. They also include a FE (fixed-effect) term and the previous day implied volatility as regressor. The results show that the coefficient of the Gamma imbalance (t-1) is negative and highly significant both for single stocks and indexes. Indeed, consistent with the null hypothesis, the data shows a negative relationship between daily volatility of returns and gamma dealer exposure. These results are also significant from an economic standpoint. For single equities, the estimates indicate that one sigma in the gamma imbalance is associated with a decrease between 5 and 25 bps in the absolute value of the daily return for the underlying stock. For the tested indexes the economic magnitude of the effect is even more striking, as one standard deviation increase in the gamma imbalance is associated to a decrease in absolute return of the underlying index of more than 20 basis points (about 20% of a standard deviation).
The above evidence might suggest the existence of frictions in the derivative and underlying asset market. A potential channel for such a friction relies on option dealers generating price impact when rebalancing their delta-hedging positions. It follows that the effect of gamma imbalance on stock returns would be more pronounced for less-liquid stocks, for which the price impact arising from option dealers’ trades should be larger in magnitude. Hence, Barbon and Buraschi (2021) consider a dollar version of their Gamma Imbalance proxy, multiplying the precedent proxy by the average daily volume of the relevant stock. Then, after regressing the absolute daily returns on the interaction between the dollar version of their Gamma Imbalance and a dummy variable IL indicating the most illiquid asset, the authors prove that the increase in absolute returns during negative gamma days is significantly larger for the most illiquid assets.
A similar conclusion is drawn by Nia, Pearsonb, Poteshmanc, and White (2018) that confirm the significant negative relation between stock return volatility and the net gammas of the option positions of the option market participants likely to delta hedge their option positions. In this case approximately 9.5% (13.4%) of the daily absolute return of optioned stocks during the 1990-2001 (2002-2012) sample period can be attributed to option market participants re-balancing the stock hedges of their options positions. Furthermore, the hedge re-balancing is estimated to alter the probability of daily absolute stock returns greater than 300 (500) basis points by 5% (14%) during the 1990-2001 sample period, and by 13% (40%) during the 2002-2012 period.
Key findings: Gamma and Intraday Autocorrelation
At intraday frequencies, several studies document that stock prices deviate from a random walk. The below figure provides a simple summary of the properties of the autocorrelation coefficient (rho) of intraday returns sampled at 5-minutes frequency using non-overlapping observations. On the y-axis the figure reports the probability that the absolute value of rho is larger than rho = 0.10, 0.20, …, 0.90. If stock prices were random walks, the autocorrelation coefficient would be zero. The results strongly reject this hypothesis and show evidence of non-zero intraday autocorrelation.
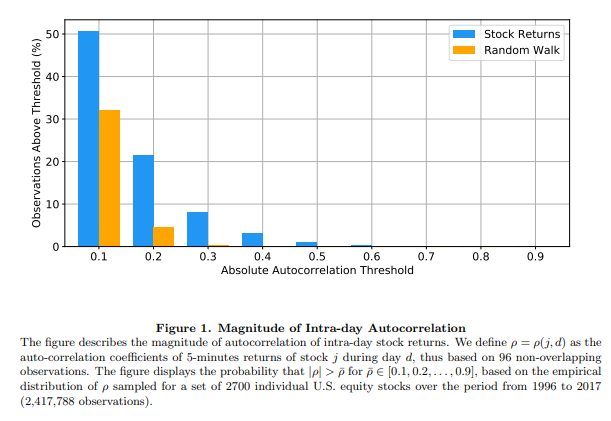
Source: Andrea Barbon and Andrea Buraschi, “Gamma Fragility”, 2021
A reason for this is that dealers’ delta-hedging strategies require selling more of the underlying asset following an increase in the underlying price if their Gamma Imbalance is positive. The opposite effect occurs when the Gamma Imbalance is negative. Thus, dealers order-flow should act as a contrarian force when the Gamma Imbalance is positive giving rise to intraday mean-reversion, namely negative intraday autocorrelation. The opposite effect should emerge when the Gamma Imbalance is negative when one should expect intra-day momentum, i.e. positive intraday autocorrelation.
To check if the equity serial autocorrelation is positive (negative) when dealers are short (long) gamma Barbon and Buraschi (2021) compute the autocorrelation of returns at different frequencies. For each day-asset pair (t, j) they estimate the sample autocorrelation coefficient of h-minute non-overlapping returns with h = 5, 10, 20, 30, and 60. Then, they run a regression with the autocorrelation coefficient as the dependent variable and the gamma imbalance as the independent one (adjusting for the FE term). Results show that the slope coefficients on gamma are indeed negative and significant for all the frequencies, especially for h = 5 and h = 60. This is consistent with two frequency of portfolio rebalancing. Broker/dealers adjust their delta-hedged portfolios both at high-frequency (5 minutes) and at a lower frequency of about 60 minutes. The economic magnitude of these results is also significant. A unitary standard deviation increase in the gamma imbalance proxy is associated to a decrease in autocorrelation between 1.5% and 2%.
Similarly, Beckmeyer and Moerke (2021) estimate that establishing delta-neutrality around the market close causes return momentum or reversal of 18 basis points for each one percentage point move in the underlying until half an hour before trading close. The direction is determined by the interaction between the aggregated gamma exposure of option market makers and the return until 30 minutes before market close. Interestingly, their results are more pronounced for stocks with high market capitalization. Also, in this case information-based explanations are not driving the result, suggesting a non-informational channel through which option markets affect underlying stocks.
Likewise, Baltussen, Da, Lammers, and Martens (2020) support strong “market intraday momentum” everywhere. Their analysis, using intraday returns on over 60 futures on equities, bonds, commodities, and currencies documents a strong market intraday momentum across the main markets in the major asset classes. The futures return during the last 30 minutes before the market close is positively predicted by the futures return during the rest of the day (from previous market close to just before the last 30 minutes). The predictive power is both statistically and economically highly significant, yielding Sharpe ratios between 0.87 and 1.73. Market intraday momentum is robustly present across markets and over time, reverts over the next days and is distinct from intraday seasonality effects.
Key findings: Market fragility and flash crashes
Barbon and Buraschi’s hypothesis is that flash crashes are more likely to occur when markets are fragile, where an important factor contributing to market fragility is the aggregate gamma imbalance.
To investigate whether gamma imbalance is potentially related to these events, they construct a temporary proxy of intraday volatility that is particularly sensitive to intraday jumps. They use as dependent variable the daily spread, i.e. the difference between the intraday High and Low relative to the mid-point price, then, for each day-asset pair (t, j) they run a regression of the Spread(t) onto the lagged level of gamma imbalance (t-1) after controlling for fixed effects and lagged implied volatility. Their findings are consistent as (i) the slope coefficient of a regression of Spread on lagged gamma exposure is negative and highly significant (1%), suggesting that large negative values of the gamma imbalance correlates with increases in intraday price jumps; (ii) the economic significance of the effect on the intraday Spread is important. This estimate implies that a one standard deviation decrease in gamma imbalance is associated to an increase of roughly 16 basis points in the daily spread. This is consistent with the economic hypothesis that periods of large negative gamma imbalances are more fragile. Jumps and flash crashes are more frequent, and volatility is higher.
References
[1] Andrea Barbon and Andrea Buraschi, “Gamma Fragility”, 2021
[2] Heiner Beckmeyer and Mathis Moerke, “End-of-Day Momentum in the Cross-Section and Option Hedging”, 2021
[3] Guido Baltussen, Zhi Da, Sten Lammers, and Martin Martens, “Hedging demand and market intraday momentum”, 2020
[4] Sophie X. Nia, Neil D. Pearsonb, Allen M. Poteshmanc, and Joshua Whited, “Does Option Trading Have a Pervasive Impact on Underlying Stock Prices?”, 2018


1 Comment
bc · 13 June 2023 at 7:59
Hi, thank you for the great article.
Would it be possible to know the full page source of the first graph used in your article?
Hereby referring to the chart that came from perfiliev.co.uk , as I am unable to find it on the main website.
Thanks and best regards.
B