Introduction
Inflation is back. After more than 10 years with inflation rates at around 1-2% in most developed economies, governments and central banks are now being confronted with significantly higher inflation rates. This increasing rate of cost of living has prompted a majority of the central banks worldwide, after many of them insisted that inflation would be transitory, to hike interest rates at a historical pace in a desperate effort to bring inflation back under control. Generally, and in these circumstances specifically, CBs closely follow market participants’ inflation expectations as they play a central role in the CBs mission for price stability. This is because inflation expectations influence private agents’ consumption, investment decisions and the wage as well as price setting process. Moreover, by having a direct impact on the pricing of financial instruments, e.g. nominal bonds, inflation expectations significantly affect the transmission of monetary policy to the real economy. Adding to that, market participants’ inflation expectations also serve as a cross-check for the CBs own inflation outlook.
There are two main ways CBs inform themselves of inflation expectations, survey-based measures and market-based measures. The latter is derived from continuously traded financial instruments. As a result, market-based measures can give a timelier indication of shifting inflation expectations but also of premiums related to inflation uncertainty. In this article, we will focus on a specific market-based measure, namely inflation-linked swap (ILS).
An ILS is a derivative contract in which a payment defined in terms of a fixed rate on a notional amount (the “fixed leg” of the swap) is exchanged for a payment defined in terms of the inflation rate realised over a predetermined horizon on the same notional amount. At the swap’s maturity, only the net cash flows—that is, the difference between the fixed leg’s rate and the actual inflation rate applied to the contract’s notional value—are swapped. Indicative of the market’s anticipated inflation rate over the relevant period is the ILS rate on the contract. Typically, a non-seasonally adjusted consumer price index (CPI) is linked to the swap contract. In the euro area, the relevant index is the HICP excluding tobacco (HICPxT), while in the United States it is the Consumer Price Index for All Urban Consumers (CPI‐U) and in the United Kingdom, it is the Retail Price Index (RPI).
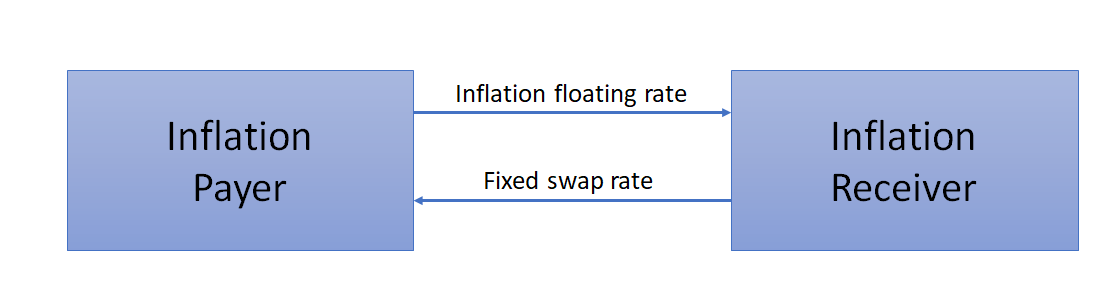
Source: Bocconi Students Investment Club
Compared to bond derived break-even inflation rates (BEIRs), ILS rates offer a clearer indicator of longer-term inflation expectations. BEIRs are determined by the spread between the nominal bond yield and the inflation-linked bond yield. Unlike ILS rates, BEIRs can be impacted by country-specific risk premia and significant time-varying liquidity effects. Because of this, market participants prefer to employ market-based inflation expectations metrics derived from ILS rates over BEIRs.
However, ILS rates are not exempt from the impact of risk premia, as with any indicators derived from prices on financial markets. The risk premia included in ILS rates compensate for the inflation risk exposure. Where ILS rates in particular include an inflation risk premium that makes up for the risks associated with investors’ central estimates of inflation throughout the forecast horizon. In addition to being a correction that must be performed in order to reveal mean expectations, the inflation risk premium also contains information about the inflation outcomes investors care about most. Despite being unobservable, the inflation risk premium can be estimated by modelling the inflation swap curve with an affine term structure model or by utilizing a non-model-based proxy, such as the difference between market-based and survey-based inflation expectations.
Inflation Linked Swaps – Term Structure
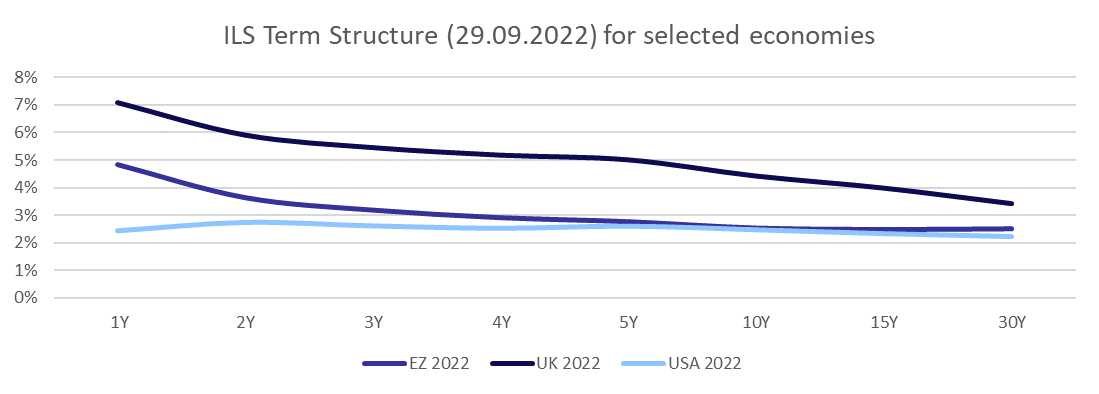
Source: Bocconi Students Investment Club
The graph above depicts the ILS term structure of the euro area, United Kingdom, and the US all for 29.09.2022. As can be seen readily, UK market participants expect a considerably higher inflation rate to persist compared to the other geographies, over the next 15 years. Especially when looking at the shorter maturities such as the 1Y, 2Y and 3Y it becomes evident to see that investors, as for now, believe that the ECB and the FED will be more successful in quickly bringing inflation back to their target rate of around 2%. For the US, one can see that investors are of the belief that inflation will be close to or at the FED’s target as soon as next year. Considering current YoY inflation levels of 8.3% in August, this might seem like a very optimistic viewpoint. As for the euro area, the term structure clearly converges to the ECB’s target of 2% over the coming five years. In general, it is important to note that in the last couple of years ILS term structures were rather steady around the respective Central Bank’s targets, whereas for now, we are experiencing a more downward-sloping curve for the euro area and the UK.
The following three graphs all compare the term structure of 29.09.2022 to the economies’ prevailing term structure of 29.09.2008, where inflation was elevated relative to the following years. For the euro area it is interesting to note that even though inflation was consistently above 3% during 2008 and some countries in the European Union already experienced recessions, the short maturity swap rates stayed within the ECB’s target rate. Both in 2008 and 2022 the curves converge to a value of around 2.5%. In the US, market participants were expecting a rather low level of inflation for the years 2009 and 2010, most certainly anticipating the impacts of the Great Financial Crisis. For the longer-dated swaps, both in 2008 and 2022, the swap rate mirrored the FED’s inflation target. The 2008 term structure for UK Inflation-Linked Swaps was an upwards sloping curve compared to the 2022 downward-sloping curve, with swap rates on the 10Y maturities well above the BOE’s target of 2%.

Source: Bocconi Students Investment Club
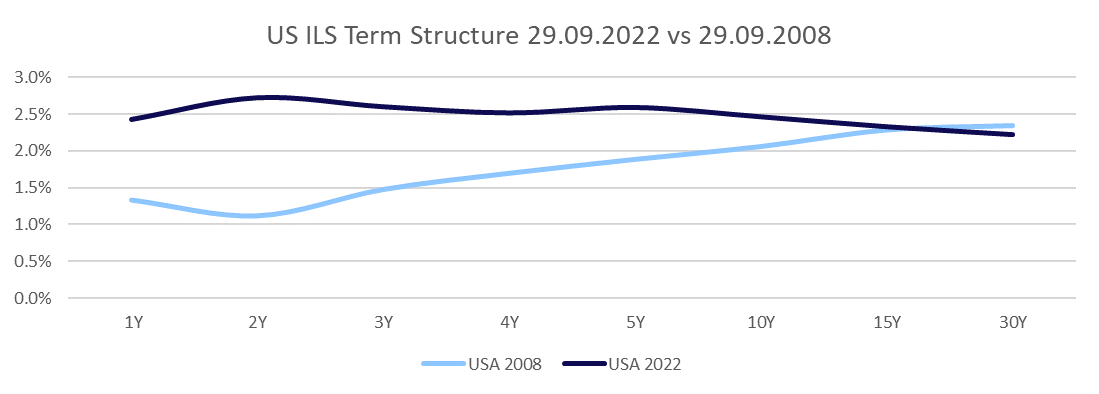
Source: Bocconi Students Investment Club
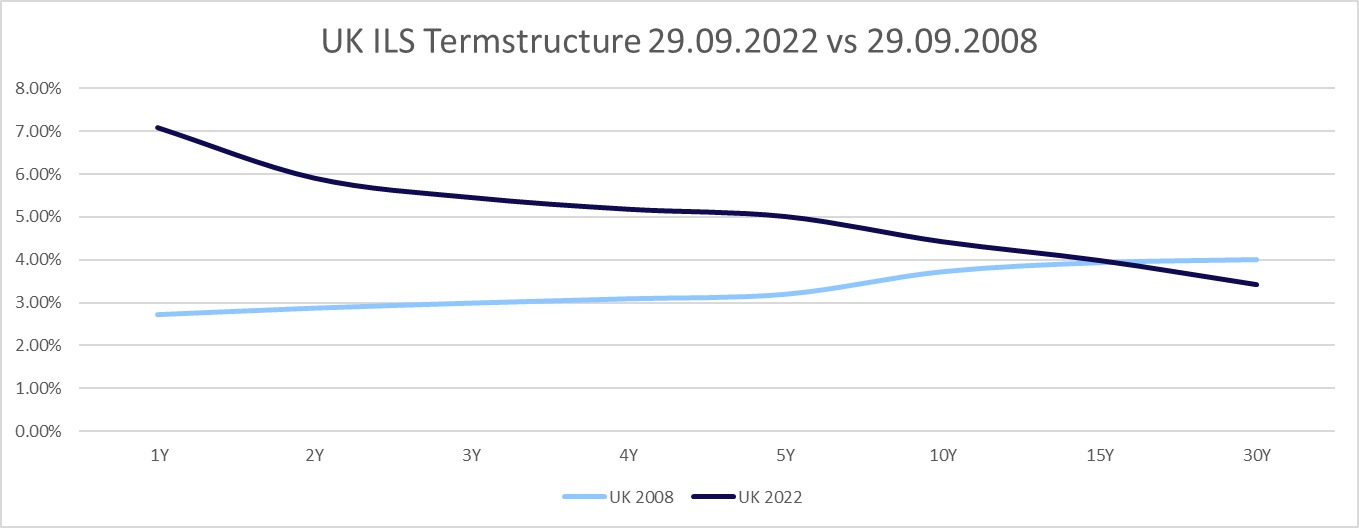
Source: Bocconi Students Investment Club
UK
On September 23rd, the new Chancellor of the Exchequer, Kwasi Kwarteng, made a speech on the Growth Plan that ignited a crisis. He spectacularly frightened financial markets by announcing unfunded tax cuts of £45bn. Although most of the tax reductions and emergency expenditures had been hinted at, the expected changes in the supply side remained ambiguous. This led to a drastic selloff in UK markets, as the value of its stock and bond markets dropped by almost $500bn since the end of Boris Johnson’s mandate.
UK pension funds received margin calls related to hedging strategies from their counterparties. To fulfil such demands, pension funds went on a selling binge of liquid assets, which started a vicious cycle of gilt sales. Advisors appealed for support to stop the gilt market from destabilizing and jeopardizing pensions for millions of people.
The Bank of England needed to step in to manage the market disorder caused by the controversial tax-cut initiative. The central bank signalled to be ready to purchase unlimited amounts of long-dated bonds following the rising gilt yields that alarmed investors, which proved to be a short breather for pension funds. The short-term restart of bond purchases by the Bank of England demonstrates the conditionality of the fight against inflation. Judged by itself, the central bank’s decision to purchase bonds while the headline inflation in the UK stands at 10% is controversial. Nonetheless, the BoE’s mini-QE should not last too much. Hence, its overall impact on UK inflation will likely be minimal.
After this market turmoil, the public is already pressuring Liz Truss’s cabinet given the bad start of her administration, many questioning whether she is the right person to govern the country. Despite voices of disagreement from all around Britain, Truss has not changed direction.
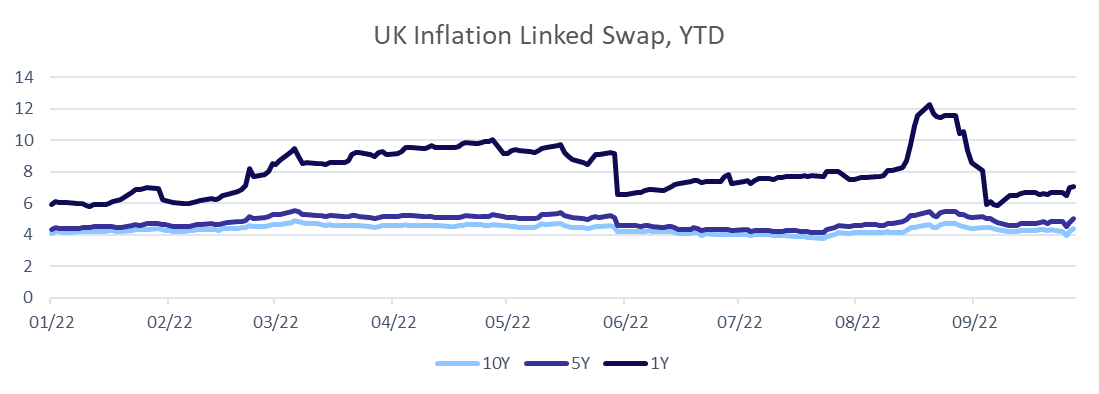
Considering the recent events from an inflation swap perspective, we can observe how the 5Y and 10Y swap rates have remained almost constant throughout the year, whereas the 1Y point fluctuated substantially. The 1Y swap rate registered a spike in mid-August when the inflation print registered a record figure of 10.1%, while Citi reported a forecast of over 18% for this January. After these concerning prospects, the BoE was expected to take a stronger stance on inflation and raise rates ever further up to 400 bps next year, which calmed down the 1Y swap rate, as we can observe in the figure below. Nevertheless, we suppose that the decline in the 1Y swap rate was also caused by the indexation lag, a feature of the inflation swaps. It means that the contracts are matched with the inflation for a period that begins before the contract start date (usually lagging two months in the case of the UK and three months for the EU and US swaps). Therefore, with time passing by the investors forecast lower inflation for one year ahead (currently the 2023 end of summer).
Source: Bocconi Students Investment Club
EU & US
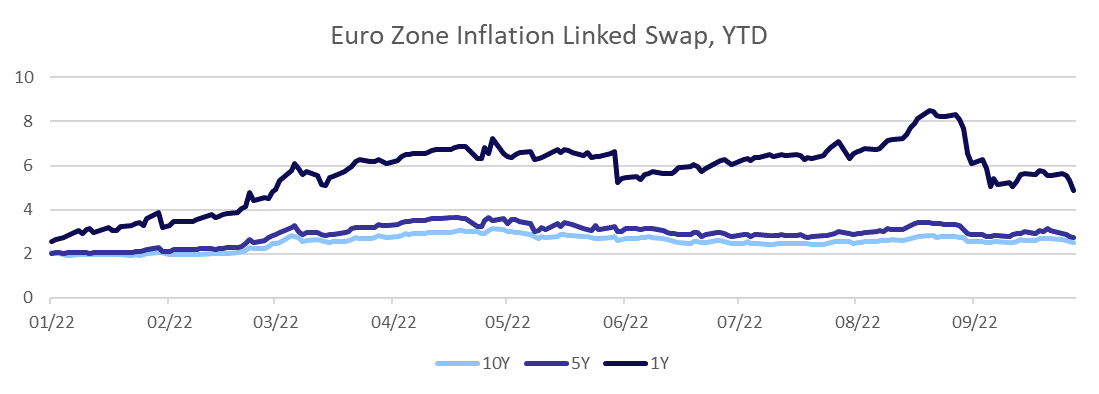
According to the latest inflation print, consumer prices grew at an annual rate of 10% across the Euro Zone (EZ) in September. France’s inflation rate, which is the lowest in the EU at 6.2%, decreased following its significant energy bill subsidies. German inflation, which increased to a record high of 10.9% in September, helped to boost the overall EZ total. At its most recent two sessions, the ECB increased the deposit rate by 1.25 percentage points, which only partially motivates the decrease in the 1Y swap rate. The other part can be explained by the indexation lag, as previously mentioned.
Following its invasion of Ukraine, Russia has restricted gas exports to Europe, driving up energy costs. As families cut down on their spending and companies scale back their output, economists anticipate that the EZ will enter a recession this winter. To quote Nouriel Roubini, he forecasts a “stagflationary hard landing” for the EZ, as a result of chronically high inflation and slow growth.
Source: Bocconi Students Investment Club
Switching to the US, inflation jumped to even higher levels in August after a slight decline in July, while increased interest rates and slower wage growth have made the economy susceptible to a downturn. Impatience for inflation to slow down is intensifying, giving the Federal Reserve justification to keep hiking rates. Observing how the inflation swap market moved this year in the US and other geographies, we consider the 1Y inflation swap rate decline overly optimistic, going as low as 2.4 percentage points.
Source: Bocconi Students Investment Club


0 Comments