Introduction
The price-to-earning ratio, known as P/E ratio, is one of the most basic valuation measures. It measures how expensive a company is relative to the earnings per share (EPS). In simple words, it measures how much an investor is paying for a stock compared to each dollar of a company’s earnings. It is important to highlight that a high P/E ratio does not necessarily mean that a company’s stock is overvalued and vice versa.
Aside from the managerial/qualitative interpretation, when looking at the whole financial market it can be seen as a parameter of a population and it can therefore be studied with statistical analysis. Since from a theoretical standpoint prices are the present value of earnings, when earnings grow, prices should increase. Indeed, prices and earnings are understood to be nonstationary time series connected by a relationship known as cointegration.
Nonstationary time series do not have the tendency to revert to their mean and vice versa. Cointegration implies that the variables share similar stochastic trends, and therefore their residuals follow a stationary process. In plain terms, two cointegrated variables may not necessarily move in the same direction (correlation), but the distance between them will remain constant over time.
Campbell and Shiller (1998, 2001) showed that high market P/E ratios forecast low market returns and that the adjustment will come mainly from declining stock prices. On the other hand, some authors argue that P/E ratios are characterized by a stochastic process and cannot be predicted. Moreover, the fact that P/E ratios have been near record high levels during the last years brought into question the usefulness of this valuation metric.
In this article, we investigate the cointegration between the two time series by reviewing the existing literature.
Premises
In both the papers we will review, the data used are taken from the database maintained by Robert Shiller. All stock returns and earnings are assumed to be real stock returns and real earnings. With P/E1 we refer to the monthly P/E ratio calculated using each month’s real price and trailing annual earnings, while with P/E10, known as the Cyclically Adjusted PE ratio (CAPE Ratio), we refer to the P/E ratio calculated using the earnings from the trailing 10-year period.
To test the stationarity, various versions of the unit root test will be used, some of which are very complex. Our focus will therefore go to the results and their implications rather than the structure of these tests.
Literature review
We will now review academic literature starting from the paper “An empirical analysis of mean reversion of the S&P 500’s P/E ratios” by Ralf Becker, Junsoo Lee and Benton E. Gup. The paper is based on data from January 1881 up to December 2003. The authors analyse the stationarity of the SP500’s P/E ratios via two very different routes.
First, they use the unit root tests with a Fourier function, this allows for an unknown number of structural breaks and can detect sharp changes in level. Then, they conduct further analysis using a regime switching model that allows a data generating process to switch between two different processes. The first trigonometric analysis assumes structural change to be of deterministic nature. The regime switching model assumes that the state variable follows a time invariant Markov process, which implies constant transition probabilities between the two different states.
In the first test, they find that the null of a unit root (nonstationarity) is rejected using the Fourier function but it is not rejected using the ADF (Augmented Dickey-Fuller) test. This is explained by the apparent bias of ignoring multiple breaks in the P/E ratio series.
In the second test, assuming the first regime to be stationary with an unconditional mean around 14 to 15 and allowing for some nonstationary behavior in the second regime, they find that the second regime is transitory, and does not prevail long. Moreover, from the Regime 2 probabilities across the different regime switching models, they identify at most 4 episodes at regular intervals (around 1900, 1930s, 1960s and around 2000).
The paper demonstrates that P/E ratios are statistically nonstationary, but stationary around multiple structural changes. As a consequence, P/E ratios fluctuate around different means. This implies that a high P/E ratio will be followed by a decrease in stock prices (Campbell and Shiller 2001) or high earnings growth. Their findings support the arguments for mean reversion in Campbell and Shiller (2001), but only when structural changes are allowed for.
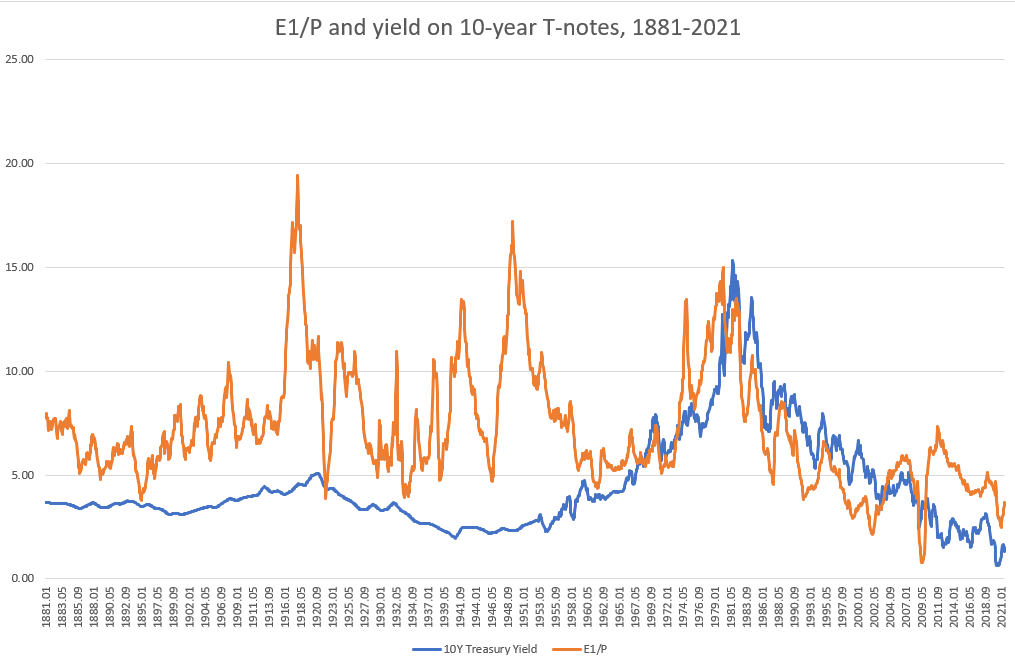
We now review the paper “Will the market P/E ratio revert to its mean?” by Robert Irons and Tao Wu. The authors extend the work in Weigand and Irons (2008), which found that investors have been benchmarking the market earnings yield (E/P) to 10 year-Treasury note yields since around 1960 implying the two series have become cointegrated. As a consequence the P/E ratio itself has become nonstationary and can depart from its mean for extended periods.
The reason given for this change is what is referred to as the “Fed Model”. The Fed Model, a term coined by Deutsche Bank analyst Edward Yardeni in 1997 after the testimony of Fed Chair Alan Greenspan, is a valuation approach in which the stock market’s earnings yield is compared to bonds yield. According to the Fed model, when earnings yield are higher than bonds yield, stock prices should increase and vice versa. The model has been heavily criticized because it requires that investors suffer from inflation illusion. Indeed, investors are comparing a real variable (E/P) to a nominal one, bonds yield. Despite the model not being suitable as a predictive tool, it has been given support as a descriptive tool for how the market P/E ratio is determined (Malkiel, 2003; Weigand and Irons, 2008) The FED Model: Illusion or Reality? – BSIC | Bocconi Students Investment Club
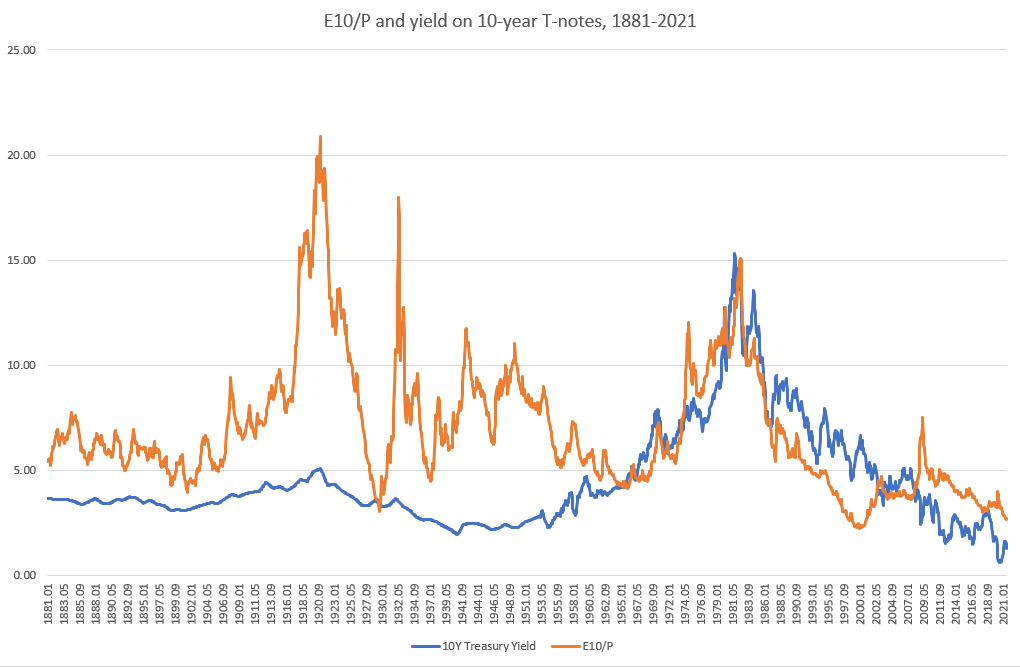
By looking at historical data, the authors find the time period when the relationship between earnings yield and the yield on 10-year Treasury notes started. The following graphs show that the relationship didn’t exist prior to around 1950, but since then the two time series have moved closely together.


If the two time series (earnings yield and 10Y Treasury Yield) became cointegrated during that period, then the stationarity of the P/E ratio should also have broken down (cointegration occurs only between nonstationary time-series). The hypothesis is tested first with ADF tests and then with a correlation analysis.
The following table shows the results of the ADF tests. The null hypothesis Delta = 0 (the series has a unit root, i.e., is non-stationary) is consistently rejected for the pre-1950 P/E data but cannot be rejected for the period after 1949.
The correlation analysis is performed by comparing the correlation coefficient before the year in question versus from that year forward for the period 1945 to 1965 (correlation coefficients are calculated from the period 1872 to 2008) . It is clear that the most significant change in correlation occurs in the year 1950. Indeed the spread between the correlation coefficients as of 1949 is 0.0273, while as of 1950 is 0.2046, an increase of almost 650%.
After having tested for nonstationarity of the P/E ratio in the period 1950-2008 and having confirmed that the change most likely occurred in 1950, the authors conduct a final analysis to confirm cointegration between the market earnings yield and the 10-year T-note yield. Three different tests are performed.
First the Johansen trace and max eigenvalue tests show that the null-hypothesis is rejected for the relationship between the E1/P and 10-year T-note yields, while it can not be rejected when using the E10/P. The tests therefore show evidence of cointegration between E1/P and the 10-year T-note yield for the period 1950-2008.
Lastly, tests of the residuals for simple regression models regressing both E1/P and the E10/P on the 10-year T-note yield are conducted. If there is cointegration between E/P and Treasury yields, the nonstationarity contained in the variables will not pass through the residuals, and thus the residuals will be stationary. The tests show that the null hypothesis of nonstationarity is rejected for the E1/P but not for the E10/P. Thus, the time series E1/P and the 10-year yield T-note yields are cointegrated for the period 1950-2008.
Weigand and Irons (2008) stated that as long as investors continue to believe in the Fed model, the market P/E ratio will be determined by nominal interest rates. However, investors could abandon their belief in the model if interest rates rise dramatically.
Findings and Implications
The two papers show very different findings.
The first one comes to the conclusion that when allowing for structural breaks, the P/E ratio is found to be stationary. Despite the lack of evidence that in the future structural breaks (high P/E ratio regimes) will reappear at regular intervals, in the past century this has been the case.
On the other hand, the author of the second paper shows that the P/E ratios were stationary prior to 1950, but nonstationary from 1950 on. Moreover, they find that after 1950 the earnings yield (E/P) and the 10-year T-note yield have been cointegrated. This is explained by the fact that investors have been pegging the earnings yield to the 10-year Treasury yield since 1950.
Finally, we conclude from the first paper that the P/E ratio is mean reverting and that improper modeling of structural changes can lead to incorrect statistical inference. The second paper, despite not finding evidence of mean reversion of the P/E ratio, gives us additional information in the determination of this valuation measure.
Bibliography
Ralf Becker & Junsoo Lee & Benton E. Gup, “An empirical analysis of mean reversion of the S&P 500’s P/E ratios”, Journal of Economics and Finance, July 2010
Robert Irons & Tao Wu, “Will the market P/E ratio revert to its mean?”, Investment Management and Financial Innovations, 10(4-1), December 2013
Campbell & Shiller, “Valuation ratios and the long-run stock market outlook: an update.”, NBER Working Paper No. 8221, April 2001
Weigand, R.A. and R. Irons, “Compression and expansion of the market P/E ratio: the fed model explained”, Journal of Investing, 17 (1), pp. 55-64, February 2008


0 Comments