Introduction
We continue our series on the impact of negative interest rate policies (NIRP) on various asset classes by looking at equities valuations this time. The years after the Great Financial Crisis have brought secular macroeconomic, policy and structural shifts, which have resulted in an unmatched collapse in global yields. In this article, we take a further look at the channels through which NIRP impacts equity prices. We analyse the impact it has had on the industry concentration, evaluate the financial impact of COVID-19, and discuss the recent asset allocation themes in the light of the expected economic recovery.
The Framework
One year ago, in our article on the potential effects of NIRP on asset classes, we showed the contribution which the accommodative policy has provided to the overall increased demand for risky assets and the subsequent rise in equity prices. As it can be easily inferred, from the investors perspective and despite being riskier in comparison with other financial instruments, it is more productive to earn desirable returns from the stock market rather than to park their funds in a negative interest-bearing deposit account. Furthermore, from the firms’ perspective, NIRP allows them to borrow capital at lower costs, eventually boosting equities’ riskier cash flows and encouraging investments accordingly.
In dealing with NIRP and equity valuation, Damodaran (2021) and Mijot (2020) suggest that equity markets have become more attractive based on the expectations of growth of future earnings that will be paid out to investors, displaying an overall increase in the risk premium of US and European equities.
Although equity prices tend to grow consistently over time, it is worth noting that, since 2008, while the risk free rate has plunged, the implied expected return on equity market has been relatively stable (see figure 1, figure 2, figure, 3).
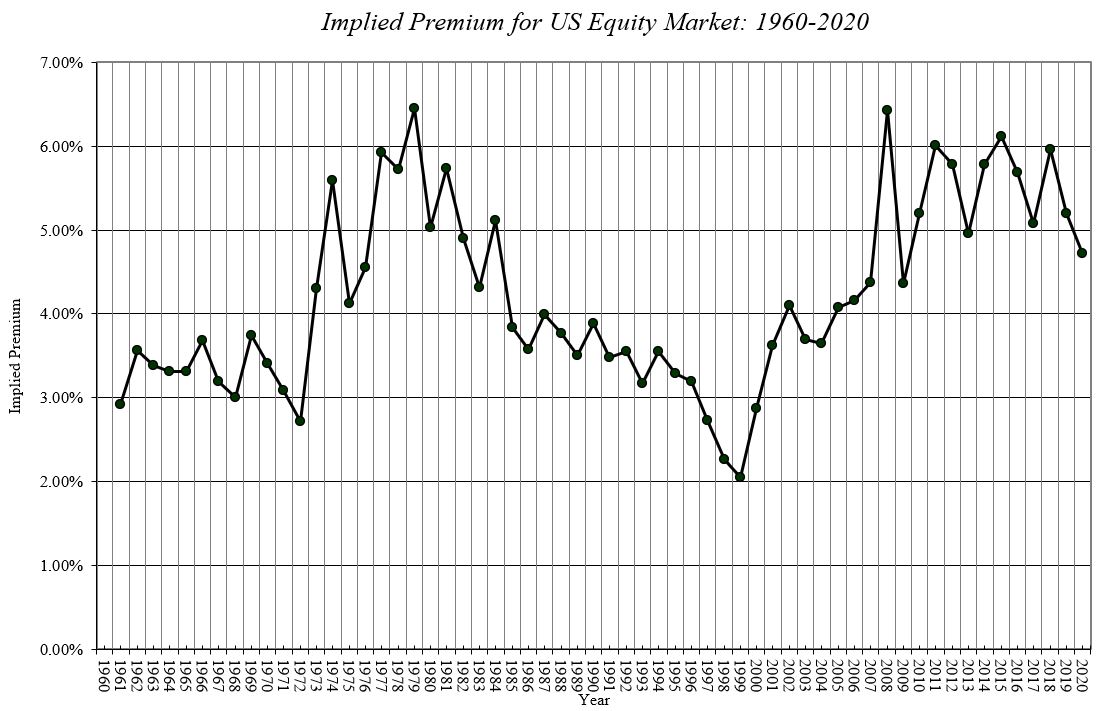
Figure 1: Implied Premium for US Equity Market: 1960-2020
Source: Damodaran, http://www.stern.nyu.edu/~adamodar/pc/datasets/histimpl.xls
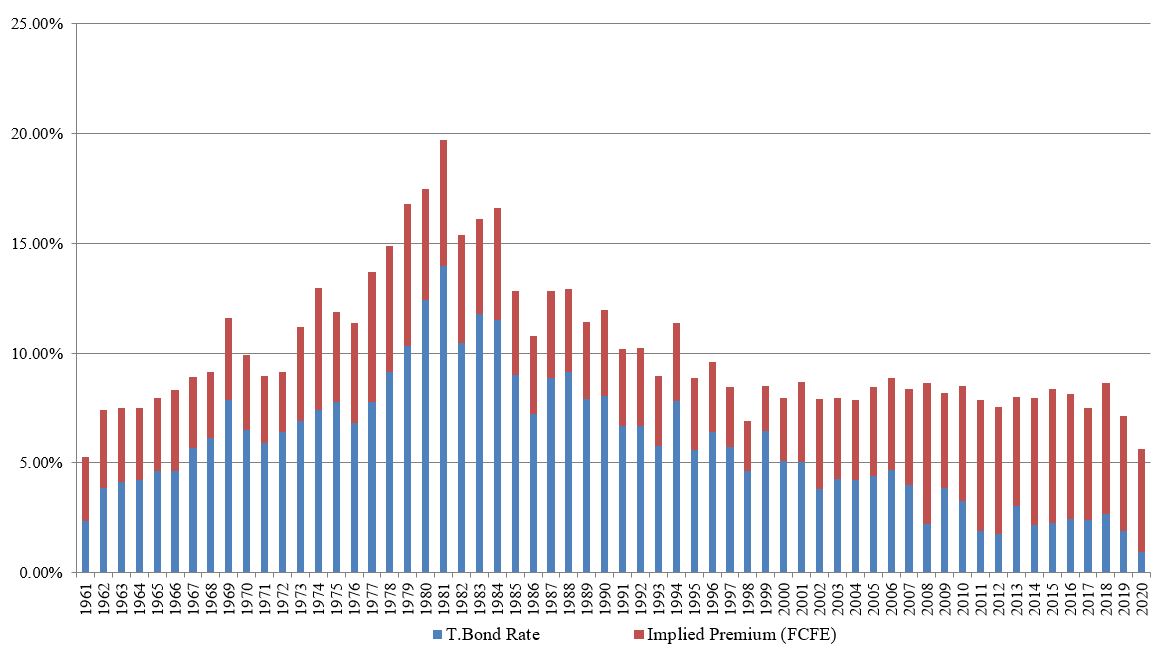 Figure 2: Implied ERP and Risk Free Rates, where Expected Return on Stocks = T.Bond Rate + Equity Risk Premium
Source: Damodaran, http://www.stern.nyu.edu/~adamodar/pc/datasets/histimpl.xls
Figure 3: Europe ERP Breakdown, where Risk premium = real potential growth + dividend yield – real interest rates
Source: E. Mijot, How will Central Banks impact the equity markets in the post-Covid world?
Amundi Asset Management
NIRP and the Industry Concentration
In addition, the connection between NIRP and industries concentration influences price growth. Specifically, we have already seen how industry leaders gain a competitive advantage as a fall in long-term interest rates incentivizes them in leveraging their investments while taking advantage of low funding costs.
This phenomenon affects mainly industry leaders, and we shall consider in this section the effects of the industries concentration due to NIRP on equity valuation of non-financial firms.
Liu, Mian and Sufi (2019) indicate that the anti-competitive effect of low interest rates raises the relative market value of leaders vs. followers by increasing leader-follower investment and productivity gap and causing a significant difference in stock valuation.
Hou and Robinson (2006) have illustrated that firms in more concentrated industries tend to earn lower returns in stock markets, despite associated positive abnormal profitability, due to low innovation risk and undiversifiable distress risk. Indeed, innovation leads to risky operating cash flows which in turn are priced, meaning that scarcely concentrated industries that are more competitive tend to earn higher returns (see Table 1). Thus, higher concentrated industries bring less innovation, lowering riskiness levels and, accordingly, expected returns.
On the other hand, high concentrated industries characterized by high entry barriers are also better insulated from demand shocks, lowering stock returns.
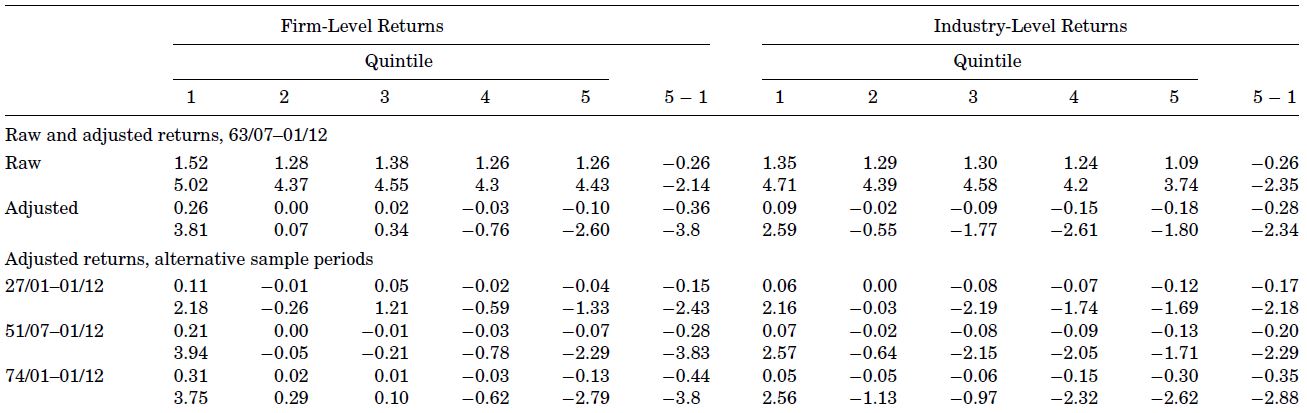
Table 1: Industry Concentration and the Cross-Section of Average Stock Returns, where industries are grouped into quintiles based on their H(Sales) value.
The H(Sales) for an industry is formed by first calculating the sum of squared sales-based market shares of all firms in that industry in a given year and then averaging over the past 3 years. The average monthly returns (in percent) of the quintile portfolios are reported from Quintile 1 (20% of industries with the lowest concentration) to Quintile 5 (20% of industries with the highest concentration).
Source: Industry Concentration and Average Stock Returns, K. Hou, D.T. Robinson
Their empirical data computed at firm-level and industry-level suggest that investors require a competitive premium for investing in firms that operate in more competitive environments with respect to firms operating in monopolistic and oligopolistic environments because, while a perfectly competitive market environment does not allow them to earn profits in the long-run, firms may earn some profits in the short-run which then will cause further entry of competitors, until profits will fall to zero.
Applin (2019), prolonging the study carried out by Hou and Robinson from 2002 to 2018, has shown that the competitive premium has appeared to increase while remaining significant at the 5% level, suggesting it is robust at firm-level and over time.
Indeed, according to Applin’s empirical study, overall returns for equities in less concentrated industries show a moderately higher variation with respect to those in more concentrated industries during 1963-2001 (see Figure 4). Moreover, as anticipated above, the competition premium may have experienced a further increase during the 2002-2018 period, since the returns of stocks in less concentrated industries are even more variable when compared to returns of stocks in more concentrated industries (see Figure 5).
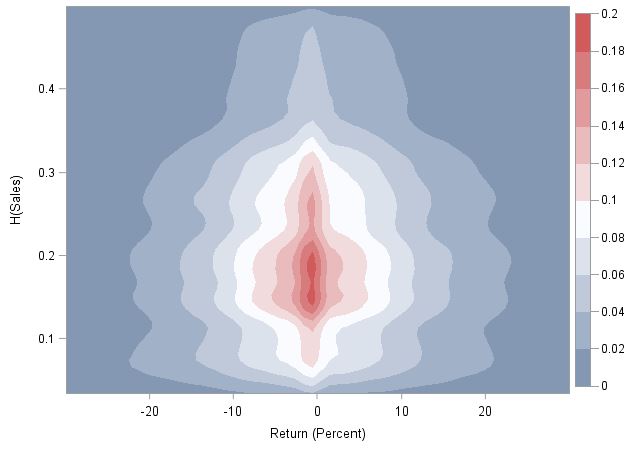
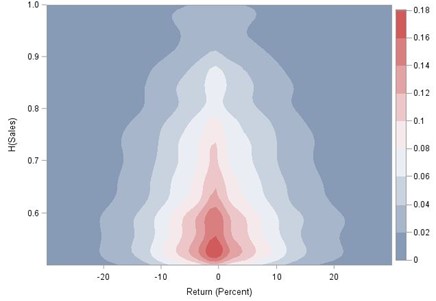
Figure 4: Kernel density for returns and concentration for 1963-2001. In the left diagram, HHI < 0.5. In the right diagram, HHI > 0.5, where HHI is the Herfindahl-Hirschman Index, the sum of squared market shares of the firms within a market.
Source: Industry Concentration and Average Stock Returns Revisited, R. Jacob Applin
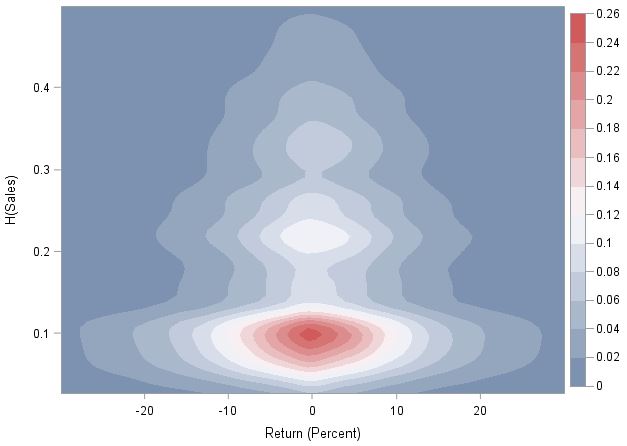
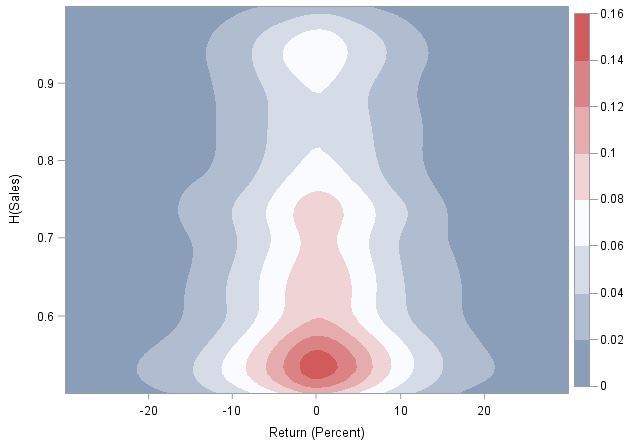
Figure 5: Kernel density for returns and concentration for 2002-2018. In the left diagram, HHI < 0.5. In the right diagram, HHI > 0.5, where HHI is the Herfindahl-Hirschman Index, the sum of squared market shares of the firms within a market.
Source: Industry Concentration and Average Stock Returns Revisited, R. Jacob Applin
Putting Factors into Perspective
As we have seen, navigating into negative interest rates zone determines high concentrated industries which may presumably be one of the most relevant factors affecting equity markets’ performance.
Ever since ZIRP and NIRP inception, growth stocks, mostly characterized by innovation and competitive markets, have experienced incredible returns, outperforming value stocks over the last decade. In fact, low interest rates cause the value of future earnings to rise and this presumably is even amplified in innovative environments based on distant future expectations with higher equity duration. Investors are attracted by desirable earnings that will probably be paid out in the future and become more valuable in a negative interest rate environment. Stagnol et al. (2021) have investigated the relationship between High Minus Low (HML) risk factor and interest rates, based on data for 10Y interest rates and the 10Y-2Y yield curve slope from 1990 to 2010 (see figure 6 and figure 7).
Reflecting the economic theory, value stocks tended to outperform in higher interest rates environment and when the yield curve steepened. Reasonably, if the economic growth is sustainable, the natural consequence is an upward movement in interest rates, along with a steepening yield curve. In this case, on the grounds of their different structure (i.e., banks/financials whose profits and overall financial activities rely mostly on interest-bearing deposits), value stocks experience a quicker growth in earnings with respect to growth stocks. Moreover, value stocks experience a rise in prices with respect to growth stocks, since a lower share of their earnings is discounted in the future. Instead, NIRP allows growth stocks to exploit a very low discount, boosting the value of distant future earnings.
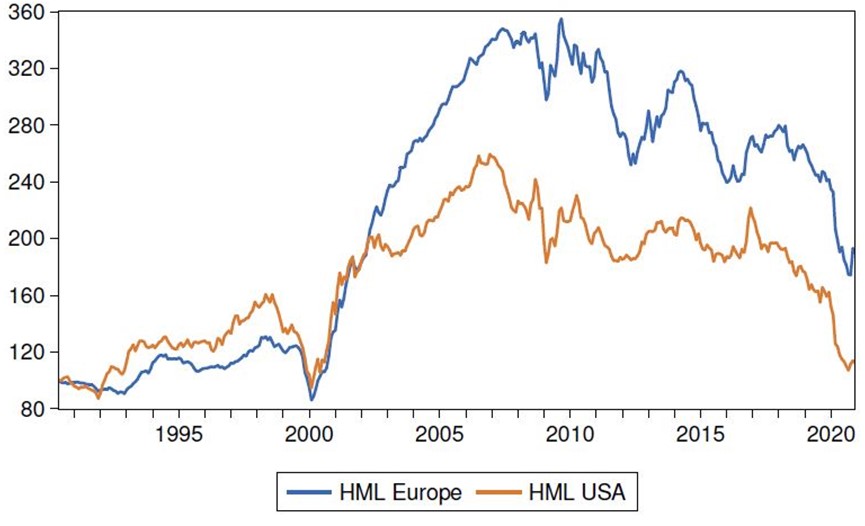 Figure 6: Cumulative performance of the HML factor (long value, short growth)
Source: Understanding the Performance of the Equity Value Factor, Stagnol et al. Amundi Asset Management

Figure 7: Average monthly return of the value risk factor (in %) across interest rates regimes
Source: Understanding the Performance of the Equity Value Factor, Stagnol et al. Amundi Asset Management
Finally, we would emphasize that everything comes with a price. It is worth noting, that a consequence of negative interest rates policies is the devaluation of the domestic currency, since investors tend to transfer their funds to countries whose central banks adopt less accommodative monetary policies that imply higher returns.
Thereby, firms that import goods from foreign suppliers or even sell imported goods may experience a surge in the price of supplies, which in turn may cause an increase in inflation not sustained by an actual growth of the real economy.
Hence, the balance between positive and negative effects of NIRP over the long-term may be controversial.
NIRP, Equities and the Pandemic
In his book “The Long Good Buy: Analysing Cycles in Markets”, Peter Oppenheimer has defined three types of bear markets: cyclical, structural, and event-driven. The cyclical ones are usually preceded by contractionary monetary policy that leads to decreased economic output. Economic imbalances and financial bubbles ready to burst preface the structural bear markets, whereas the event-driven ones are triggered by an exogenous shock, e.g., a hike in oil prices or political concern. Examining the past business cycles, Goldman Sachs has found out that throughout history, the event-driven bear markets lasted on average nine months, and the economy managed to reach the pre-crisis level after around one year. As can be noticed from Figure 8, these two levels are much lower when compared to the cyclical and structural crisis, signifying shorter and less intense slumps. The pandemic period can be qualified as an event-driven bear market, as the S&P 500 has dropped by more than 30% at its lowest, overcoming the necessary 20% fall in securities prices. Nonetheless, the US equities have swiftly restored their value after the crisis, requiring only around six months to hit the pre-pandemic level. Thus, we can conclude that this bear market has had a much faster recovery and a shorter duration than an average one.
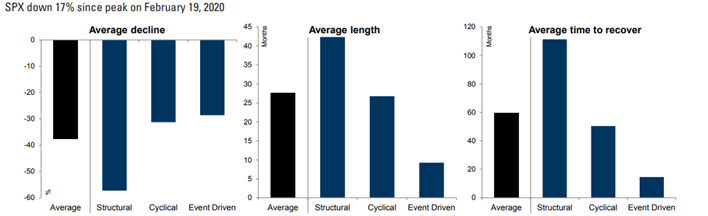
Figure 8: US Bear markets & Recoveries since the 1800s
Source: Goldman Sachs Global Investment Research
In spite of the positive signs of an early economic improvement, we should cast some doubt over the current level of the equity market, as there is the possibility for a mismatch between the real economy and the US securities. By looking at how these securities relate to both the level of earnings growth and the GDP, we can detect a quick and sound appreciation of the stock prices over the previous five years. As Figure 9 emphasizes, in the medium to short term, the discrepancy between the 12-month trailing EPS and S&P 500 index has further widened compared to its historical values, especially in the months after the pandemic when the market had excellent results despite the company earnings being on a descending trend. Additionally, the US economy has utterly underperformed its most valued stocks, as the largest 500 companies have increased their share by more than 50% compared to a few years before (see Figure 10). Hence, these two graphs illustrate the significant divergence that has appeared in these last months.
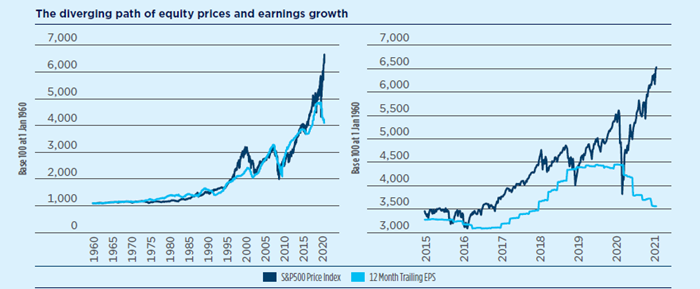
Figure 9: The diverging path of equity prices and earnings growth
Source: Amundi, Bloomberg. Data as of 12 February 2021.

Figure 10: S&P 500 / Gross Domestic Product
Sources: S&P Dow Jones Indices LLC; U.S. Bureau of Economic Analysis
The latest edition of the Global Fund Manager Survey, a flagship report of Bank of America, serves as an indicator of the present market views. It currently reveals that 55% of the American fund managers think we are in a late-stage bull market, whereas 25% believe this is just the beginning of the growth cycle. This short-term bullish outlook is corroborated with the net 89% expectation that the global profits will better over the next twelve months. Besides, the institutional investors became more concerned about the inflationary expectations than the coronavirus pandemic. After a year in which COVID-19 has been considered the main tail risk, the Wall Street sentiment has moved for the first time towards a rise in inflation – 37%, and taper tantrums – 35%, now seen as the highest risks (you can observe these fluctuations in the figure below). In fact, after the recent boost in interest rates, the vast majority of investors expect a rise in inflation during the next twelve months.
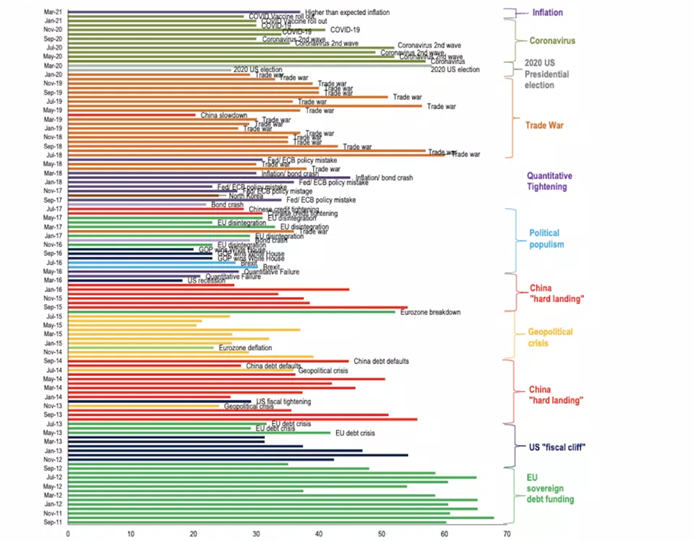
Figure 11: Evolution of Global FMS “biggest tail risk”
Source: BofA Global Fund Manager Survey
Nevertheless, in what rates are concerned, Reserve Bank President Charles Evans, who is a voting member of the Fed’s interest-rate committee, mentioned on Thursday that he does not foresee any rise in the interest rate target until 2023, the year when the inflation rate should reach its 2% target and might even overshoot it. Furthermore, he dismissed any possibility that the economy will overheat, and the inflation will directly jump to a 3.5% level. Thus, the central banks will most likely reach the inflation objective eventually, but for now, the inflation fears are slightly overstated.
The New Reopening
We have started this article with a framework explanation of how equity valuations should behave given, all else equal, falling and/or persisting low interest rates. Such analysis revolves around a negative correlation between yields and stock prices, and was shown to be empirically true over the last decade. However, in finance, such correlations between two variables very rarely are so simple or stationary over the long run. With both bonds and stocks rallying over the last years, but the correlations being historically spurred, we have to look wider and incorporate also growth and inflation expectations.
As the recovery expectations have been picking up, it is reasonable to expect the yield/equity correlation to be actually positive. In such times, historically, as rates were rising from low levels, the equity market has been performing well on the basis of the expected growth of earnings and an overall economic recovery.
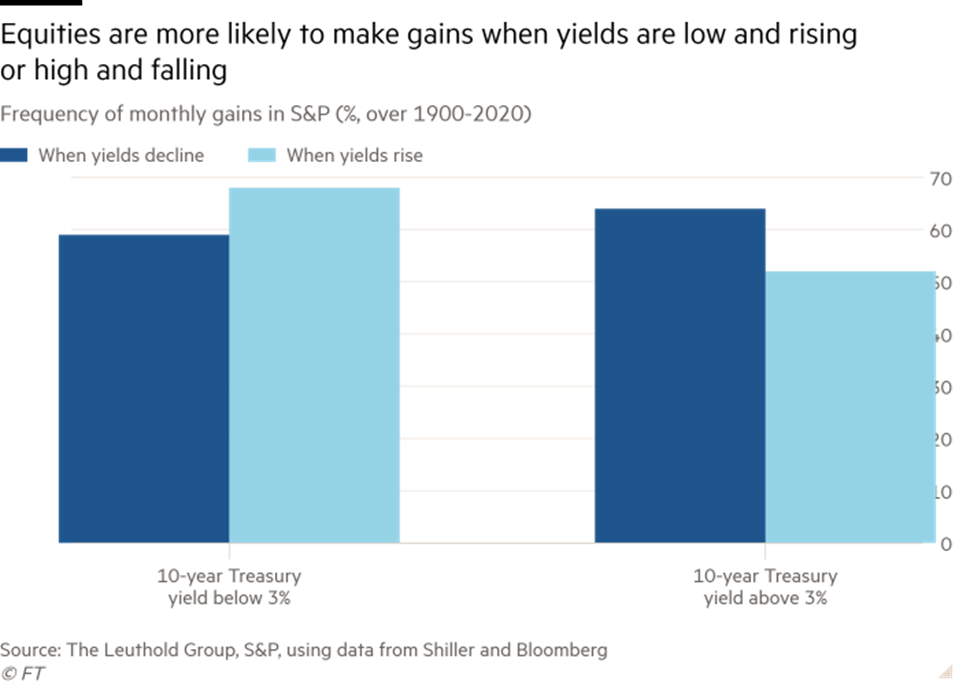
Figure 12: Equity Gains when yields are low and rising or high and falling
Source: Financial Times
It is however tempting to say that “this time is different”, as the leading stock indices tend to have a much higher equity duration than previously in history. For example, in the S&P 500 Index the tech sector currently makes up 27% of the index, perhaps justifying the higher index P/E level vs. the long term historical average. So far, however the recent rapid increases in nominal rates have not caused any particularly significant downward moves in equities over the last weeks.
Contrary to the macroeconomic trends of the past decade, one of the main themes that has been gaining traction amongst asset allocators is the reflation trade. Inflation is yet another factor playing a role in the correlation between rates and equities. Central banks have long wanted for the inflation to pick up, which $9tn in asset purchases later, is becoming present in market forecasts and allocation recommendations. It is also said to be a factor in how the correlations actually behave, meaning that investors rather than the nominal starting level, actually tend to care more about inflexion points and the second derivative of the levels.
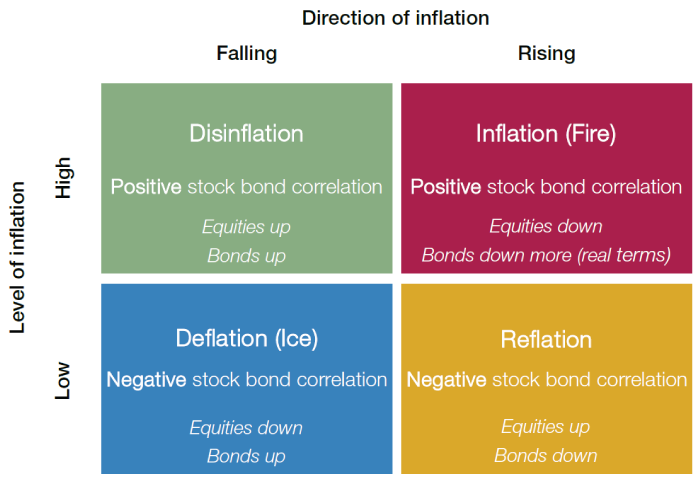
Figure 13. The relationship between Fire and Ice
Source: Man Group
Rotations
The return of expectations of a significant economic growth and inflation have caused a significant rotation between different styles and classes of equities. One of the most popular trades has been a rotation into cyclical stocks, which have been overperforming the market during the end of the year. The differences were also observed intra-sectors, as even in a cyclical, e.g. energy stocks basket, there were significant divergences between higher and lower equity duration stocks such as ones focusing on alternative, new energy sources and the benefitting oil-based producers. A similar pattern can be observed also in other cyclical sectors, which have been at least partially affected by the pandemic, such as travel.
One takeaway from this article in our view is that a general relationship between rates and equities is difficult to establish, as we have been mainly experiencing the NIRP in a very particular, secular macroeconomic trend. Nevertheless, some aspects of it are easier to single out, such as the effect on the industry concentration. Following the popular saying that “the history doesn’t repeat, but it rhymes”, we see the upcoming recovery from the historically low interest rates an especially interesting topic. Undoubtedly, the upcoming months will show how much the NIRP has structurally changed the global investment environment and how will the correlations behave.


0 Comments