Equity put-option writing strategies represent an alternative to attain equity-like returns with less volatility. In fact, by writing a put-option the seller collects the option premium and gains exposure to value changes in the underlying equity. The Chicago Board Options Exchange (CBOE) publishes already since 2007 daily return data for its S&P 500 PutWrite Index (PUT) and since 2001 for its Russell 2000 PutWrite Index (PUTR). In July of this year, the CBOE published for the first time return data on non-U.S. put-writing strategies. Dating back to April 2006, the CBOE calculated option indices on the MSCI Emerging Markets Index (PXEF) as well as on the MSCI EAFE Index (PXEA). In this article, we want to analyse how well put-writing strategies suit as an alternative to low-volatility and hedged equity strategies as well as how the results of our analysis differ among different markets. Put-writing strategies will be explained in more detail in the first two parts of this article, while the third part deals with the return analysis and performance comparison.
How do put-writing strategies work?
For simplicity, we will use the aforementioned PUT Index as an example to explain the implementation of such strategy in more detail. The put options is written on the SPX Index, better known as S&P 500, and the collected option premium is deposited in a money market account, invested in one- and three-months treasury bills. The put is sold at-the-money (ATM) on a monthly basis – roll date is usually the third Friday of the month. To cover the liabilities of the short position in the SPX put option, an additional $K cash is invested in the money market account, where K is the strike price of the SPX option. The daily index returns can therefore be calculated as:


with  and
and  representing the values of the money market account on day t and t-1, respectively,
  is the daily rate of one-month T-Bill treasuries,
  and
and  are the average of the last bid-ask quote of the SPX put option on day t and t-1, respectively. On roll days, the daily return is composed of the return attributable to the settlement of the expiring SPX option (settlement at market close) and the return from the newly sold SPX option,


with  representing the settlement value of the expiring SPX put option,
  as the average of the last bid-ask quote of the expiring put option on the previous day.
  is the average of the last bid-ask quote of the new SPX put option on trade day,
  is the last bid quote of the SPX put option on trade day.
  and
and  represent the values of the new and old money market accounts, respectively.
What drives the performance of a put-writing strategy?
Many market participants wish to minimize the impact of market turndowns on their equity exposure or may want to cover their short positions in stocks. Such demand for insurance in form of equity index options can be used to the investors advantage, since he collects the insurance premium over time by writing put options. When equity investments decline in value, volatility typically rises. A short position in options reflects a short position in volatility, due to the negative vega exposure. In simple terms, volatility influences option prices since it affects the probability and the degree to which the option will be in-the-money at expiration. An increase in volatility therefore increases the value of an option – other things held constant – which in turn results in a negative return for the option seller. A strategy that sells volatility should command a positive risk premium, due to the strong negative correlation between equity returns and implied volatility, which is the volatility sold by the option writer. The negative correlation between volatility and equity returns represents an insurance for an investor for his long equity exposure, since negative equity returns can be offset with positive returns from a long volatility position (e.g. by buying options). The option writer, or insurance seller, bears this downside risk and therefore earns a long-term risk premium.
As the put-writing strategy implemented by CBOE consists of writing ATM options with only one month to expiration, the vega exposure of the option writer sharply decreases as the value of the equity index moves away from the strike price. Once the index price has moved away from the strike price of the option, the changes in the option‘s value become more influenced by the value changes in the underlying index. In fact, when the index value drops below the strike price, the put option is in-the-money and the delta of the option increases in absolute value from 0.5 up to 1, in a non-linear fashion, as the index value falls. The investors’ exposure to value changes of the underlying is therefore remarkably less than with an actual equity investment – given there are no price jumps which would hurt returns due to the negative gamma and vega exposure.
Analyzing the return characteristics
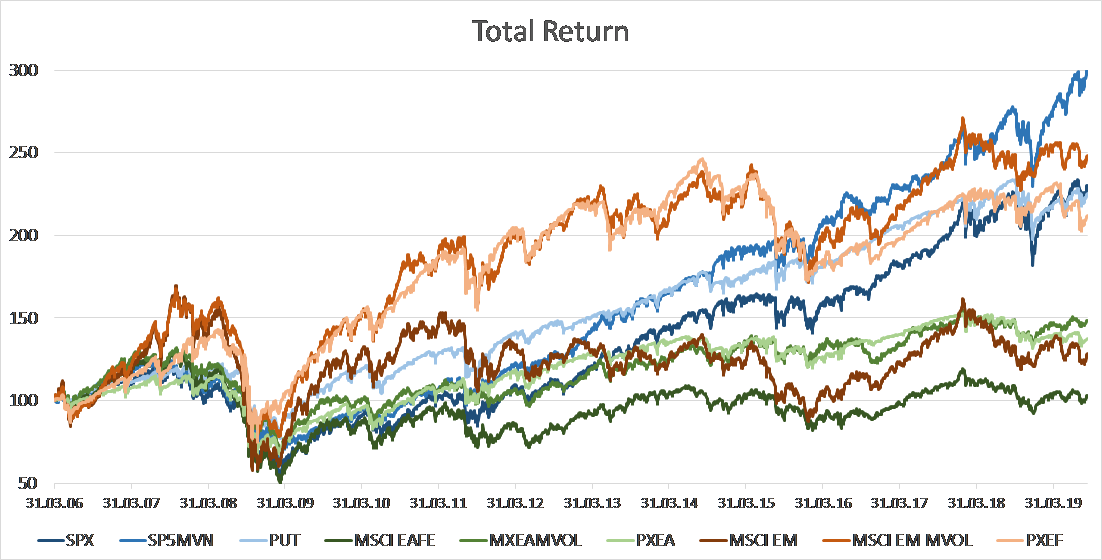
The table below shows a summary of the return distribution characteristics of the aforementioned equity indices on which the CBOE publishes return data of put-writing strategies. The SPX Index (S&P 500) tracks the performance of U.S. blue chip stocks. The MSCI EAFE Index and MSCI EM Index track the performance of large- and mid-cap stocks across 21 developed markets (excluding the U.S. and Canada) and 24 emerging markets, respectively. To analyse the effectiveness of put-writing strategies on these indices, we also report the return characteristics on optimized equity portfolios on the very same indices which promise to generate a lower volatility in returns – SP5MVN, MSCI EAFE MVOL and MSCI EM MVOL, respectively. The results were obtained using daily returns from April 1st 2006 – September 9th 2019.
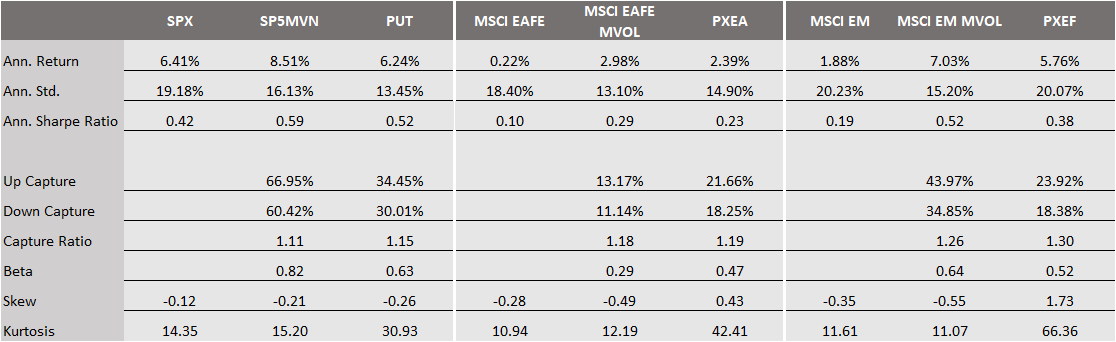
Source: Bloomberg. All calculations in USD. Data as of 09.09.2019.
It can be noted that the low volatility strategies were not only successful at reducing the return volatility but also obtained higher returns, with the most remarkable difference in emerging markets. The same holds also true for the put-writing strategies. However, they underperform the low volatility, pure equity strategies in all three markets on both, total return and risk-adjusted metrics.
For the strategies on the SPX Index and the MSCI EM Index, the put writing strategies had a remarkable lower participation in up- and downward movements of the respective equity index, which can also be drawn from a lower market beta, compared to the low volatility indices. In contrast, the put writing-strategy on the MSCI EAFE Index shows a higher market beta than the low volatility approach. But also in this market the put-writing strategy trails the low volatility approach in terms of total returns as well as return volatility.
Looking at the estimates for distribution parameters of higher order, the positive skew in the returns of PXEA and PXEF seems attractive, since investors in general should prefer investments with returns that are concentrated on the positive side. Closer inspection of the returns reveals that this is due only to the market disruptions during the financial crisis in 2007/08. The market turbulences lead to a sharp increase in investors demand for protection, causing an increase in the gap between implied and realized volatility. This resulted in an increase in the continues returns from selling put options, which were able to offset some of the market corrections. In fact, during the period 08/2007-12/2008, the put-writing strategies PUT and PXEF generated “only” a loss of 17.6% and 17.2%, respectively, compared to losses of 23.7% and 28% for the low volatility approaches on the S&P 500 and MSCI EM Index, respectively. However, the sharp market corrections lead to both, large double-digit daily gains and losses, which resulted in a fat-tailed return distribution, as seen in the last row of the table.
Summing up
While put-writing strategies were not able to outperform pure equity, low volatility indices on the three markets analysed in this article, their value contribution was shown during times of larger market disturbances, e.g. during the financial crisis. It also needs to be noted that the equity low volatility strategies represent optimized strategies, which tilt their exposures towards certain sectors and return characteristics. The put-writing strategies, however, are passive strategies implemented on the index. More sophisticated approaches may obtain improved results, even though this may affect the liquidity of the traded options.


0 Comments