The VIX, known also as the Wall Street’s fear gauge, is the most common measure for expected volatility in the equity market. It is implicitly derived from the price of currently traded options on the S&P500 and over the years it evolved into an asset class of its own.
Short-selling volatility became a popular strategy in the after-crisis era: many types of investors, from professional fund managers to retail account holders, seeking to boost returns in an environment of ultra-low interest rates started following and implementing this trade.
After the great turbulences the equity market experienced in 2008 and the all-time highs both in implied and realized volatility during the same timeframe, these two measures followed a relatively smooth downward trend, making short positions quite successful and profitable. Given the human risk averse nature, implied volatility exceeded realized volatility in the vast majority of cases.
The short-selling strategy, which amounts to speculation that stresses and uncertainty currently present in the market will fade in the future, has been losing money since mid-summer, when concerns about the global economy caused significant losses in equity markets and triggered spikes in volatility.
It is also interesting to notice how volatility tends to move in tandem with short-term interest rates, albeit with a 2.5-year temporal lag. The chart points out the sensitivity of the realized volatility to significant changes in the yield curve of the Generic 5-year U.S. note.
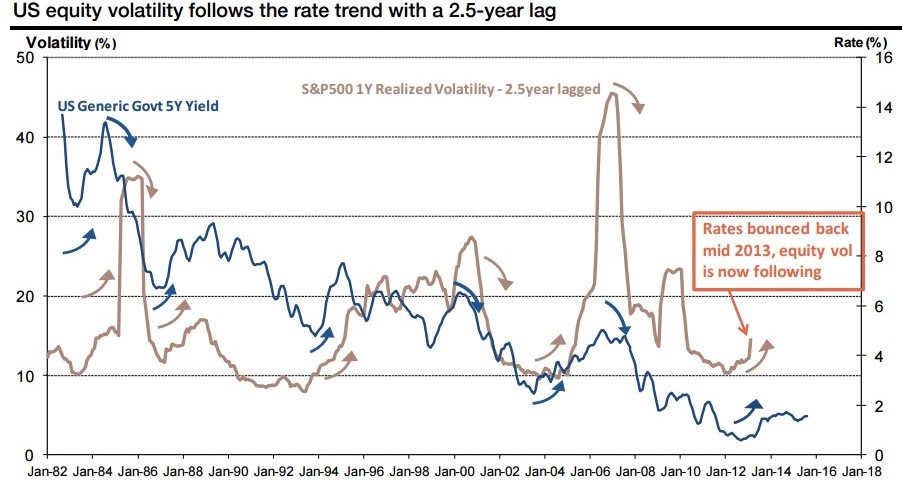
Source: Bloomberg
During the last months of 2013, the Federal Reserve roiled fixed-income markets by suggesting that it would have potentially started to scale down its bond purchase program. The announced tapering of the quantitative easing defined a marked turning point in the volatility cycle that is starting to materialize nowadays. The soon-to-come swing in the volatility cycle, endorsed and enhanced by the recent turmoil in equity markets suggest the end of this profitable trade or, at the very least, diminishes its attractiveness.
Starting 2007 the Chicago Board Options Exchange expanded its suite of volatility benchmarks also with the VVIX Index. The VVIX is the volatility of the volatility, meaning that it represents the expected volatility of the 30-day forward price of the VIX, and it is calculated from the price of a portfolio of liquid at- and out-of-the-money VIX options.

Source: CBOE data
Analyzing the historical time series it is clear how recent events, which caused great uncertainty and an increase in the underlying implied volatility, consequently impacted the VVIX. During summer 2015, it spiked close to 140, well below the level showed during the Lehman crisis and throughout all 2008-2009, which did not reach 120.
The measure also presents the same dynamics showed by the implied volatility, which in turn come from the realized volatility features. Above all, the VVIX is characterized by a leverage effect. The volatility increases proportionally more when the underlying equity drops and along the same reasoning the VVIX increases asymmetrically when the implied volatility surges. This could explain, at least in part, the recent jumps.
Academics have long proved the presence of predictable dynamics in the implied volatility surface under not so stringent assumptions, such as relative high market efficiency and moderate transaction costs. Given the fact that these features are widely satisfied by a liquid market such as the one for S&P 500 options, it could be theoretically possible to model both the VIX and VVIX in order to forecast this new regime shift.
Another way to look at the situation is to analyse the XIV, which is exactly the inverse of the VIX. On August the level dropped more 50%, from almost 50.0 to below 23.0, just to gain some momentum during the fall, but with a really slow pace.
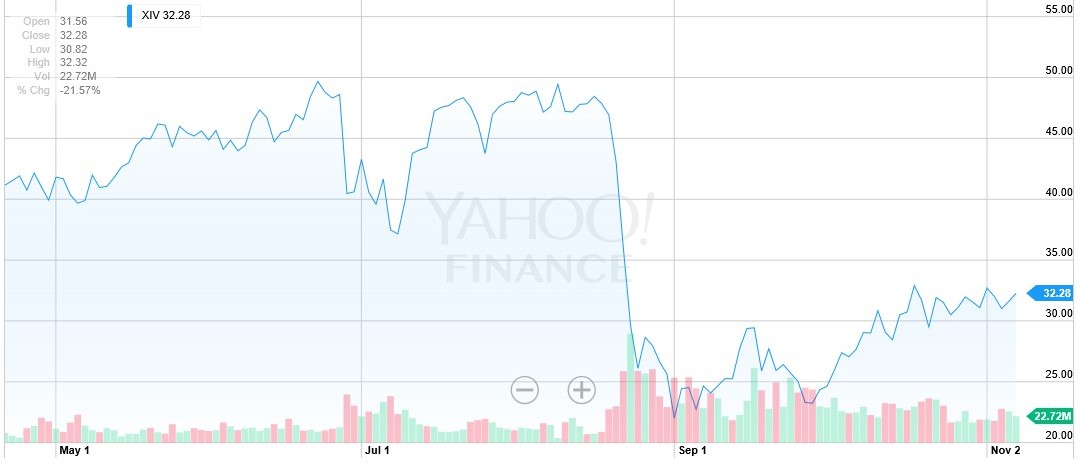
Source: Yahoo Finance
All this data confirm what some market participants have learned in the hard way over the course of last months: shorting volatility is no more a safe and profitable trading strategy. A rough awakening is ahead for those who over-relied on shorting volatility to boost their returns.
[edmc id= 3142]Download as PDF[/edmc]


1 Comment
Leonardo Pisano · 21 November 2015 at 13:33
Hi, nice article, informative. Only wanted to add one remark regarding this statement:
” Given the human risk averse nature, implied volatility exceeded realized volatility in the vast majority of cases.”
I think a reason why implied vol is generally hgher than realized vol is because banks tend to be net sellers of options, which they delta hedge, and as you would know from prof Saita’s class, you can only make money by delta hedging if the realized vol is higher than implied vol (when you are long the option). So a trader selling an option would sell at a higher implied vol than historical vol generally (realized vol is unavailable at the time unfortunately 😀 ) so that he can be protected from a future increase in realized vol.